
Dưới đây là bản dịch tiếng Việt của nội dung đầu vào, tuân thủ đầy đủ các yêu cầu về thuật ngữ, phong cách và định dạng: Báo cáo vĩ mô thị trường tiền điện tử: Bitcoin quay lại mức 80.000 đô la Mỹ, đảo chiều cục diện Mỹ-Iran và thay đổi lãnh đạo Fed
- Quan điểm cốt lõi: Tháng 5 năm 2026, thị trường tiền điện tử đang ở một nút thắt phức tạp, nơi ba chủ đề chính đan xen: địa chính trị (xung đột Mỹ-Iran), chính sách tiền tệ (thay đổi lãnh đạo Fed) và sự sâu sắc hóa của thể chế hóa (ETF tích lũy ngược chiều). Mặc dù gió ngược vĩ mô vẫn tiếp diễn, nhưng hành vi nắm giữ của các tổ chức và nhà đầu tư dài hạn cũng như quy luật chu kỳ halving cho thấy, đây nhiều khả năng là một đợt điều chỉnh sâu trong thị trường tăng giá chứ không phải là sự khởi đầu của một thị trường giá xuống.
- Các yếu tố chính:
- Biến động địa chính trị: Chiến dịch hộ tống "Kế hoạch Tự do" của Mỹ-Iran tạm dừng một cách kịch tính, nhưng rủi ro phong tỏa thực tế eo biển Hormuz vẫn chưa biến mất. Giá dầu tăng cao đã đẩy dự báo chỉ số PCE cốt lõi của Goldman Sachs lên 2,6%, tạo ra một môi trường vĩ mô kiểu "stagflation", gây áp lực hai chiều lên cả vai trò tài sản trú ẩn an toàn và định giá tài sản rủi ro của Bitcoin.
- Ngã ba đường chính sách Fed: Ông Warsh kế nhiệm ông Powell làm Chủ tịch, lập trường "pha trộn diều hâu-bồ câu" của ông cùng với sự chia rẽ nội bộ làm gia tăng bất ổn định chính sách. Sách Beige Book cho thấy chi phí năng lượng tăng trên diện rộng đang bào mòn lợi nhuận doanh nghiệp, lộ trình cắt giảm lãi suất sẽ quanh co hơn, gây áp lực trung hạn lên thị trường tiền điện tử vốn nhạy cảm với thanh khoản.
- Tín hiệu tích lũy ngược chiều rõ ràng từ các tổ chức: Khi giá giảm xuống vùng 76.000 - 81.000 đô la Mỹ, dòng vốn ròng vào hàng ngày của ETF Bitcoin giao ngay đã lên tới 630 triệu đô la Mỹ. Tính đến đầu tháng 5, tổng giá trị tài sản ròng của các ETF đạt 103,785 tỷ đô la Mỹ, chiếm 6,66% tổng vốn hóa thị trường của Bitcoin, cho thấy các tổ chức đang xây dựng vị thế một cách vững chắc trong bối cảnh thị trường yếu.
- Thay đổi sâu sắc trong cấu trúc cung-cầu: Kể từ khi ETF được phê duyệt, đã tích lũy được hơn 580.000 BTC (tương đương sản lượng khai thác khoảng ba năm), kết hợp với nguồn cung từ các nhà đầu tư nắm giữ dài hạn liên tục tăng lên. Cấu trúc nắm giữ kép này dẫn đến sự thu hẹp nguồn cung lưu thông thực tế, tạo ra một mức hỗ trợ đáy ngầm cho giá.
- Xác minh quy luật chu kỳ halving: Thời điểm hiện tại (tháng 5 năm 2026) nằm trong giai đoạn cửa sổ khám phá giá 12-18 tháng sau halving vào tháng 4 năm 2024. Lịch sử cho thấy giai đoạn này thường là "rửa sạch và tích lũy" hơn là đỉnh chu kỳ, nhưng hiệu quả trong môi trường thể chế hóa mới vẫn còn nhiều bất ổn định.
1. Geopolitical Game: The Reversal of the "Freedom Plan" at the Strait of Hormuz and Resurgent Inflation
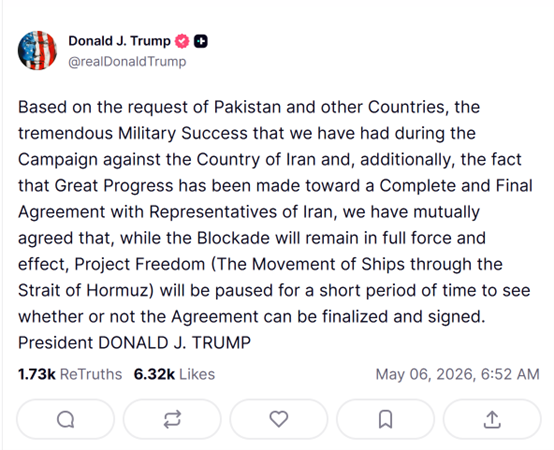
On May 4, 2026, US President Donald Trump grandly announced on Truth Social that the US would officially launch the "Freedom Plan" escort operation for merchant ships in the Strait of Hormuz at 9:00 AM local time in the Middle East, deploying guided-missile destroyers, over 100 land-based and sea-based aircraft, multi-domain unmanned platforms, and 15,000 active-duty troops. The US characterized this as a "defensive humanitarian operation," ostensibly to bypass the 60-day authorization limit for presidential military action under the US War Powers Resolution. However, just one day later, Trump issued another statement announcing that, citing "significant progress in the comprehensive US-Iran agreement," he had decided to suspend the execution of the "Freedom Plan," but emphasized that the maritime blockade of Iran would "continue to be fully and effectively implemented." This dramatic reversal caught global markets off guard, causing crude oil prices to experience violent fluctuations following the announcement.
Iran's stance, meanwhile, was far more resolute than the US description suggested. Ali Akbar Velayati, a top foreign policy advisor to Iran’s Supreme Leader, clearly stated that the Strait of Hormuz had been closed and would not reopen unless "the national will of the Islamic Republic of Iran so decides"; all vessels planning to transit the strait must submit an application via the official email address and obtain a transit permit from Iran before proceeding. The Chairman of the Iranian Parliament's National Security Commission warned that any foreign armed forces (especially US troops) approaching or entering the Strait of Hormuz would be attacked. On key issues such as the nature of a ceasefire, the right of passage through the strait, and whether the "Freedom Plan" is truly suspended, the positions of the US and Iran are starkly opposed, indicating that the market's pricing of geopolitical risk is far from a point where relief is warranted.
The direct consequences of this geopolitical game are already becoming apparent in global inflation data. Under the dual impact of escalating US-Iran military conflict and the UAE's announcement on May 1 to withdraw from the OPEC+ alliance, international oil prices continued to rise from late April to early May, significantly pushing up energy prices. Goldman Sachs subsequently revised its year-end core PCE inflation forecast up from 2.5% to 2.6%, and its overall PCE forecast up from 3.1% to 3.4%. More alarmingly, the driving force behind this inflationary surge is not overheating on the demand side, but supply-side shocks (oil prices) combined with tariff effects. This complicates the Federal Reserve's monetary policy response mechanism – it neither dares to raise interest rates easily (for fear of exacerbating downward economic pressure) nor can it readily initiate rate cuts (due to the rising risk of de-anchored inflation expectations). For Bitcoin, this "stagflationary" macro environment has historically exerted downward pressure from both sides: its safe-haven status has not yet gained broad consensus, while expectations of tightened liquidity continue to suppress risk asset valuations.
2. On the Eve of the Fed Chair Change: Beige Book Warnings and the Crossroads of Policy Independence
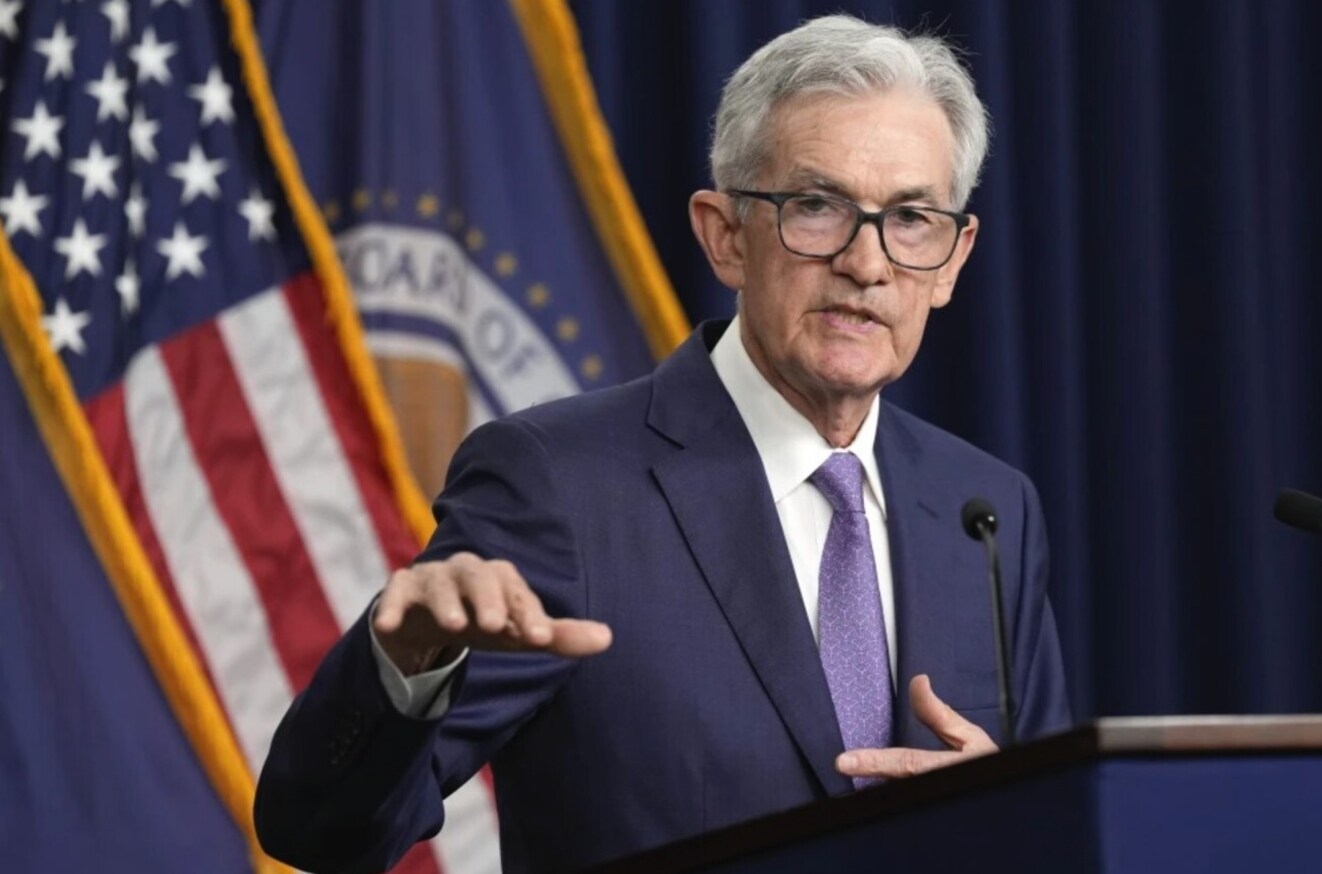
In mid-May 2026, the Federal Reserve is about to witness the most controversial chairmanship transition in modern history: Kevin Warsh will officially succeed Jerome Powell as Chair of the Federal Reserve. Breaking with a 75-year tradition, Powell will remain on the Board of Governors after stepping down as Chair, a move widely interpreted by the market as a political compromise indicating "incomplete decoupling" between the White House and the Fed. Warsh's policy stance presents a subtle "hawkish-dovish mix": he leans hawkish on inflation control and balance sheet management, emphasizing monetary policy discipline and framework restructuring, having publicly criticized the Fed's ultra-loose policies over the past two decades as having "severely strayed from its mission." However, he leans dovish regarding the long-term interest rate trajectory, acknowledging the natural suppression of inflation by technological progress and supporting rate cuts when data permits. This mixed stance leaves the market deeply divided over the monetary policy path of the "Warsh era," making it a key source of uncertainty for crypto market macro-pricing in May.
The FOMC meeting concluding on April 30 was the last one chaired by Powell. As widely expected, the federal funds rate was held steady at 3.50% to 3.75%. The signals in the post-meeting statement and Powell's press conference were complex. On one hand, the impact of rising energy prices on inflation "has already begun to show and could expand further in the short term," with Powell stating unequivocally that "no official currently supports a rate hike, but some officials advocate reducing the accommodative tone of the FOMC statement." On the other hand, Powell emphasized that he would "not become a shadow chair" after leaving office, attempting to assuage market concerns about damage to the Fed's policy independence. However, internal Fed divisions surfaced just days after the meeting: Stephen Miran, a Fed governor nominated by Trump, dissented in favor of a rate cut, while "hawkish heavyweights" like Cleveland Fed President Beth Hammack and Minneapolis Fed President Neel Kashkari also dissented (but in favor of maintaining the status quo). The intensity of internal disagreement at the Fed casts a heavy shadow of uncertainty over Warsh's first FOMC meeting after taking office.
The Fed's Beige Paper released on April 16 provided valuable grassroots insights into the real state of the US economy. The report indicated that among the 12 Federal Reserve Districts, eight experienced slight to modest economic expansion, two saw little or no change in activity, and two reported slight to modest declines. The most closely watched inflation-related statement was: "Energy and fuel costs increased substantially across all 12 Districts," with businesses widely reporting that input cost increases were outpacing selling price increases, compressing profit margins. Decision-making regarding hiring, pricing, and capital investment had become more complex for businesses, with "wait and see" becoming the most prevalent business strategy. For crypto assets, the core signal from the Beige Paper is that while the US economy is not in recession, growth momentum is being eroded by energy inflation. The Fed's rate cut path will be more tortuous than previously anticipated by the market, which represents a sustained constraining macro backdrop for the liquidity-sensitive crypto market in the medium term.
3. Deepening Institutionalization: ETF Counter-Trend Inflows and Miner Balance Sheet Optimization
Against the backdrop of Bitcoin's significant drawdown from its highs, the contrarian buying behavior of institutional capital became the most noteworthy structural signal in the crypto market in May 2026. According to SoSoValue data, on May 1 (Eastern Time), US spot Bitcoin ETFs recorded a massive single-day net inflow of $630 million, with BlackRock's IBIT taking the lead at $284 million and Fidelity's FBTC ranking second at $213 million. On May 4, spot ETFs recorded another net inflow of $532 million. This capital flow showed a significant divergence from BTC's price trend: prices fluctuated repeatedly in the $76,000 to $81,000 range, but ETFs continued to see net inflows, indicating that institutions were steadily building positions during price weakness, rather than the retail pattern of buying high and selling low. As of early May, the total net asset value of US spot BTC ETFs had reached $103.785 billion, accounting for approximately 6.66% of BTC's total market capitalization. The continuously rising share of institutional holdings is fundamentally altering Bitcoin's price discovery mechanism – transitioning from a highly volatile, retail-dominated speculative asset towards an asset allocated by institutions.
From a broader perspective, the deepening of institutionalization is reshaping Bitcoin's supply and demand dynamics. Since the approval of US spot Bitcoin ETFs in January 2024, the ETF channel has cumulatively absorbed over 580,000 BTC, equivalent to roughly three years of Bitcoin network issuance. Concurrently, the supply held by long-term holders has been steadily rising since mid-February 2026, indicating that long-term investors' willingness to hold positions has increased rather than decreased during the price correction. This pattern of dual "locking up" by institutions and long-term holders continually reduces Bitcoin's actual circulating supply, providing implicit support for prices amidst macroeconomic headwinds.
4. Bitcoin Back at $80,000: Halving Cycle Patterns and Bullish/Bearish Dynamics at the Current Node
At the beginning of May 2026, Bitcoin is staging a key comeback rally from a deep correction. After hitting a low near $60,000 in early February, BTC staged a strong rebound in early May and reclaimed the $80,000 level, representing a rebound of over 33% from the cycle's trough. This "return to $80,000" move is still roughly 46% below the all-time high set in October 2025. However, compared to the retail panic selling and large-scale miner shutdowns characteristic of the bear markets of 2018 and 2022, this 2026 correction exhibits distinctly different structural features: continued net inflows into ETFs, rising holdings by long-term holders, and leading mining companies optimizing their balance sheets rather than cutting production and exiting the market. These signals collectively point to the assessment that this is more likely a "deep correction within a bull market" rather than the start of a bear market where the "bull run is over."
Looking at the pattern of halving cycles, Bitcoin underwent its fourth halving in April 2024 (block reward reduced from 6.25 BTC to 3.125 BTC). Historical data suggests that the 12 to 18 months following a halving are typically the most intense phase of price discovery. BTC broke its previous all-time high approximately 12 months after the 2012 halving; the major bull run began about 17 months after the 2016 halving; and the cycle peak was reached roughly 12 months after the 2020 halving. Using this historical pattern as a reference, the 12-to-18-month window following the April 2025 halving corresponds to the period from April 2026 to October 2026, precisely the current timeframe. This suggests that the current price correction is highly likely part of the "shakeout and accumulation" phase post-halving, rather than a cyclical top reversal. Of course, whether this historical pattern remains valid in the new environment of deepening institutionalization is highly uncertain.
Technically, the core battle zone after Bitcoin's "return to $80,000" is between $76,000 and $83,000. The $80,000 level itself is an important psychological barrier and short-term support. The $83,000 level corresponds to the 200-day simple moving average (SMA) and is a critical "bull/bear line" fiercely contested by both sides. A decisive daily close above this level could target the $89,000 to $94,000 range. To the downside, $76,000 represents a low tested multiple times in April 2026; a breakdown below this level would open the technical downside towards the $70,000 to $65,000 range. Regarding momentum indicators, the RSI-7 has risen to 71.27, approaching overbought territory, suggesting short-term technical pullback pressure. However, the MACD formed a golden cross in mid-April, providing some momentum support for a medium-term upward move. Synthesizing the technical signals, the most reasonable assessment for the current node is that BTC is in a "confirmation phase after returning to $80,000." Range-bound trading may persist for another 2 to 4 weeks until clear macro catalysts emerge.
5. Outlook: Three Scenario Projections and Key Observational Nodes
Integrating the three main storylines – geopolitics, Fed policy path, and institutional capital flows – the crypto market from May to July 2026 could evolve along the following three scenarios.
Scenario One (Probability ~35%): Geopolitical Easing + Dovish Fed Signals -> BTC challenges $89,000 to $94,000. If the US and Iran reach a substantive framework agreement within the negotiation window following the suspension of the "Freedom Plan," the Strait of Hormuz returns to normal transit, oil prices decline from highs, and inflation expectations consequently cool; simultaneously, Warsh signals a dovish stance in his first public speech after taking office on May 15. The simultaneous improvement in these two storylines would trigger a "double boost" effect at the macro level: a significant recovery in risk appetite, accelerated ETF inflows, and BTC likely breaking above $83,000 (200-day SMA) within 2 to 4 weeks and mounting a challenge towards the $89,000 to $94,000 range. Key observation nodes for this scenario include: Warsh's inaugural speech around May 15, the April US non-farm payrolls report released on May 8, and interim announcements from US-Iran negotiations.
Scenario Two (Probability ~45%): Geopolitical Stalemate + Fed Maintains Wait-and-See -> BTC oscillates in $70,000 to $85,000 range. This is the neutral scenario currently most priced in by the market. The US and Iran cannot reach a comprehensive agreement within the 4-week ceasefire period, but no new large-scale military conflict erupts, and the Strait of Hormuz remains in a "semi-blockade" state. Under this scenario, BTC is most likely to maintain a wide-range consolidation pattern, with ETF flows becoming the most direct short-term price driver. If weekly net inflows remain above $300 million, prices will tend towards the upper bound. If weekly net outflows reappear, prices will test support at the lower bound. Range trading is the most suitable strategy for most investors in this scenario.
Scenario Three (Probability ~20%): Escalated Geopolitical Conflict + Runaway Inflation -> BTC retraces to $65,000 to $70,000 range. If the ceasefire agreement completely collapses, Iran announces a full blockade of the Strait of Hormuz, oil prices break through $120/barrel, forcing further upward revisions to Goldman Sachs' year-end PCE forecast; and hawkish Fed officials publicly discuss the possibility of "raising rates to combat inflation if necessary." This macro "perfect storm" would simultaneously shock liquidity expectations and risk appetite, potentially pushing BTC below the crucial $70,000 psychological level. Although the probability is relatively low, if it occurs, leveraged positions in the crypto market would face systemic liquidation pressure. Cash and short-term Treasuries would be the optimal holdings in this scenario, and Bitcoin positions should only be established after confirming a macro turning point.
6. Conclusion: Identifying Structural Signals in the Macro Fog
The crypto market in May 2026 finds itself at a historic confluence of three main storylines: geopolitics, monetary policy, and the institutionalization process. The dramatic reversal of the "Freedom Plan," the policy uncertainty surrounding the Fed chair transition, the test phase of Bitcoin's post-halving cycle pattern, and the structural shift of continuous contrarian accumulation through the ETF channel collectively form an exceptionally complex and rich macro chessboard. For investors, the key to navigating this phase lies in distinguishing "noise" from "signals." The back-and-forth of geopolitical events and the hawkish-dovish debates of Fed officials are essentially short-term noise – they affect prices on an intraday to weekly basis but cannot alter the medium-term trend direction pointed to by the structural signals of deepening institutionalization and post-halving supply contraction.
Macro headwinds are often the best friend of long-term allocators. The macro pressures Bitcoin faces in May 2026 – rising oil prices, uncertain Fed hawk/dovish stance, ongoing geopolitical conflict – are actually quite mild compared to the darkest moments of the "liquidity crisis" in March 2020 or the "FTX collapse + aggressive Fed rate hikes" in 2022. Meanwhile, the continuous rise in institutional holdings, the ongoing expansion of the ETF product line, and the fact that leading miners can still optimize their capital structures during a downturn all quietly point to a larger narrative: Bitcoin is gradually evolving from a fringe speculative asset into a permanent fixture within the global asset allocation landscape. This process is full of volatility, but the direction is clear. We recommend focusing on three key variables: First, Warsh's inaugural speech around May 15 will determine the direction of repricing for rate cut expectations. Second, the substantive progress of US-Iran ceasefire negotiations within the 4-week window will define the evolution path for oil prices and inflation expectations. Third, if US spot BTC ETF weekly flows record net inflows exceeding $500 million for two consecutive weeks, it would be the clearest signal of accelerated institutional accumulation. The macro fog will eventually dissipate, and investors who maintain composure and identify structural signals within the fog will be the most composed winners in the next market cycle.


