
BitMart VIP Insights | May Crypto Market Review & Hot Topics
- Key Insight: In May 2025, the macro environment of "high inflation + hawkish stance" intensified, leading to a "surge-then-pullback" trend in the crypto market. Core hotspots centered on regulatory compliance progress driven by the CLARITY Act and the upgrade of on-chain financial infrastructure driven by Uniswap V4. Institutional capital clearly concentrated in BTC, while ETH and SOL faced relatively greater downward pressure.
- Key Factors:
- Macro Pressure Dominates Market Sentiment: The U.S. April CPI rose to 3.8% year-over-year. FOMC minutes showed internal分歧 reaching the highest level since 1992, with expectations for rate cuts this year nearly diminishing to zero, leading to increased volatility in risk assets.
- Crypto Market Cap Rose then Fell: Total market capitalization rose to a monthly high of $2.821 trillion at the start of the month, then rapidly retreated due to hawkish signals, closing the month at $2.657 trillion, effectively wiping out the month's gains.
- Divergent Performance of Core Assets: BTC corrected after breaking $80,000 but still showed institutional "resilience"; ETH fell approximately 11% MoM due to declining institutional preference; SOL underperformed BTC, dragged down by slow ecosystem liquidity recovery.
- Regulatory Legislation Milestone: The CLARITY Act passed the Senate Banking Committee vote with a 15-9 margin, establishing a dual-track classification standard for digital assets as commodities/securities, marking a significant turning point in the U.S. crypto regulatory framework.
- On-Chain Financial Infrastructure Upgrade: The Uniswap V4 Hook ecosystem exploded, propelling DeFi into the era of "programmable liquidity"; Hyperliquid hit all-time highs driven by ETF and derivatives expansion, focusing on high-growth on-chain financial platforms.
- Capital Structure Shift & Rise of New Stablecoins: The total stablecoin market cap remained largely flat, but USDT and USDC saw slight contractions, while emerging compliant stablecoins like USD1 and USDe grew against the trend, reflecting capital shifting towards yield-bearing and compliant instruments.

TL;DR
- The overall macro environment in the U.S. in May was characterized by "high inflation + a hawkish bias." FOMC minutes revealed significantly heightened internal policy分歧, with market expectations for a rate cut this year rapidly cooling. Meanwhile, the April CPI rose to 3.8% year-over-year, further reinforcing market pricing for higher rates for longer. Concurrently, U.S. stocks maintained strength driven by AI capital expenditure expansion and better-than-expected tech earnings, but experienced a阶段性 pullback at month-end due to inflation and hawkish signals, leading to markedly increased volatility in risk assets.
- The crypto market in May showed a "surge followed by a decline" pattern. The月初 saw a rebound in risk appetite and a BTC rally, driving up trading volume and total market cap. However, starting mid-May, hawkish signals from the Fed led to a clear divergence between price and volume and signs of capital exodus. Total market cap quickly fell after reaching its monthly high. Although it stabilized slightly at month-end, most of the monthly gains were erased, indicating that macro pressures still dominate market sentiment. Among newly listed projects, GENIUS and BILL represent two popular narratives: on-chain trading infrastructure and AI identity verification, reflecting current capital preference for projects with strong narratives related to AI, compliance, and infrastructure.
- ETF flows in May showed a pattern of "BTC being relatively resilient, ETH facing sustained pressure." Although BTC ETFs experienced periodic net outflows, their cumulative capital scale remained at historical highs, indicating that the institutional long-term allocation logic has not fundamentally changed. In contrast, ETH ETF outflows and liquidity pressures were more pronounced, reflecting a clear institutional risk preference for BTC. The total stablecoin market cap remained largely stable, with USDT and USDC contracting slightly. Meanwhile, emerging stablecoins like USD1, USDe, and PYUSD grew counter-trend, indicating a capital shift from traditional trading stablecoins towards yield-bearing and compliant stablecoins.
- In May, BTC followed a "new highs then pullback" trajectory. It briefly broke through the $80,000 mark to hit a new local high, but subsequently fell due to higher-than-expected inflation, hawkish Fed rhetoric, and ETF outflows, leading to a significant cooling of market sentiment. In comparison, ETH and SOL underperformed BTC. ETH faced persistent headwinds from declining institutional preference, while SOL was hampered by a slow recovery of ecosystem liquidity, showing that market capital is mainly concentrated in core assets like BTC.
- The core hotspots in the crypto market in May were concentrated on two main themes: "regulatory compliance" and "on-chain financial infrastructure upgrades." The advancement of the CLARITY Act is seen as a pivotal turning point for the U.S. crypto regulatory framework. The SEC's proposed "innovation exemption" for tokenized stocks further reinforced the long-term imagination space for RWA and on-chain securities markets. Meanwhile, Hyperliquid hit all-time highs driven by its ETF and on-chain derivatives expansion, reflecting market capital refocusing on high-growth on-chain financial platforms. In DeFi, the explosion of the Uniswap V4 Hook ecosystem made "programmable liquidity" a new narrative.
- In June, the market will closely focus on Warsh's first FOMC meeting and the latest dot plot. The Fed's stance on inflation and the interest rate path will directly impact U.S. Treasury yields, BTC's trajectory, and overall risk appetite. On the regulatory front, the CLARITY Act enters the full Senate vote stage. If it progresses smoothly, it will further clarify the digital asset regulatory framework and accelerate institutional capital, ETFs, and compliant stablecoins. Meanwhile, Hong Kong's stablecoin HKDAP completed its Ethereum mainnet test and is scheduled for official issuance at the end of Q2, suggesting that competition for Asian compliant stablecoins and the development of on-chain payments and RWA ecosystems may intensify in June.
1. Macro Perspective
Policy Direction
In May, the Fed's policy framework underwent its most significant leadership transition of the current cycle. The minutes of the Fed's April 28-29 FOMC meeting (Chair Powell's last) were released on May 20, revealing the highest level of internal policy分歧 since 1992: 4 dissenting votes. Governor Stephen Milan favored a 25 basis point rate cut, while members Hammack, Kashkari, and Logan opposed retaining the phrase "easing bias" in the statement, effectively calling for a more hawkish stance. The minutes also showed that most officials clearly stated that if inflation remains persistently above the 2% target, a rate hike would become an "appropriate option." Market pricing subsequently adjusted sharply, with expectations for a rate cut this year nearly zero, and the implied probability of a rate hike from late 2026 to early 2027 rose significantly.
On the personnel front, the Senate confirmed Kevin Warsh as the 16th Fed Chair on May 13 with a 54-45 vote, the narrowest margin in modern history, almost entirely along party lines. Only Democratic Senator Fetterman of Pennsylvania crossed party lines to support him. Powell's term officially ended on May 15. Warsh's first FOMC meeting as Chair is scheduled for June 16-17, where the latest dot plot and Summary of Economic Projections (SEP) will be released. The market will scrutinize his every word with maximum sensitivity.
U.S. Stock Market Performance
U.S. stocks generally maintained their strength in May. The S&P 500 recorded positive returns for eight consecutive weeks, its longest winning streak since December 2023. The Nasdaq rose in seven out of eight weeks. The Dow Jones Industrial Average closed near 50,580 points on May 22, hitting a new local high for the month. The primary driver was a better-than-expected Q1 earnings season, with major tech companies generally exceeding profit expectations and continued expansion in AI capital expenditure boosting sentiment. Progress in U.S.-Iran ceasefire negotiations also provided external support for risk assets. In late May, the jump in the April CPI to 3.8% and the hawkish signals from the FOMC minutes triggered a brief pullback, but overall U.S. stock market resilience remained solid.
Inflation Data
The U.S. Bureau of Labor Statistics released April CPI data on May 12: CPI grew 3.8% year-over-year, the highest since May 2023, with a monthly increase of +0.6% (down from March's +0.9% but still significantly above expectations). Core CPI (excluding food and energy) was +2.8% year-over-year and +0.4% month-over-month, both exceeding forecasts. By component, energy prices rose another 3.8% month-over-month in April, a continuation of the lagged effects of the March oil price shock. The shelter index rose 0.6% month-over-month, showing persistent stickiness. Food prices rose 0.5% month-over-month, with food at home up 0.7%. Overall, the higher-than-expected inflation readings dashed market hopes for a natural decline in inflation after the energy shock subsides. The 2.8% year-over-year core reading makes it difficult for the Fed to return to an accommodative stance anytime soon.
Employment Data
The U.S. Department of Labor released the April nonfarm payrolls report on May 8: 115,000 new jobs were added, a significant slowdown from the revised March figure of 185,000, but still slightly above the market consensus average which had been boosted by a ceasefire rally. The unemployment rate held steady at 4.3%, and the labor force participation rate edged up. Average hourly earnings rose 3.6% year-over-year and 0.2% month-over-month to $37.41, indicating manageable wage inflation pressure. Job gains were primarily in healthcare (+37,000), transportation and warehousing (+30,000), and retail trade (+22,000). Federal government employment continued to decline, while information and manufacturing sectors saw slight decreases. Overall, the April employment data showed a pattern of "moderate deceleration" rather than a sharp deterioration. In the context of high inflation, this is insufficient to trigger a rate cut for the Fed, nor does it constitute an urgent reason for a rate hike, further narrowing the policy window.
Political Factors
The U.S.-Iran ceasefire was the core geopolitical variable throughout May. Following the initial ceasefire on April 8, the U.S. and Iran reached a new two-week temporary truce in early May, mediated by Pakistan. The U.S. simultaneously advanced "Operation Freedom" to ensure commercial shipping through the Strait of Hormuz. Brent crude oil fell significantly from its peak to around $94.80 per barrel, and WTI dropped to near $95.75. However, the ceasefire's fragility remained prominent, with Iran's Supreme National Security Council continuing to reject the full reopening of the strait. Oil prices subsequently rebounded to around $108 per barrel for Brent. The temporary easing of geopolitical tensions provided breathing room for global risk assets and was a key macro catalyst for BTC's breakout above $80,000.
On the crypto regulatory legislative front, the full text of the "Digital Asset Market Clarity Act" (CLARITY Act) was released by the Senate Banking Committee on May 11. It passed the committee by a vote of 15-9 on May 14, advancing to a full Senate vote. This is a substantive step forward following the committee's markup in late April. Polymarket's probability of its passage within the year subsequently rose to over 85%.
Next Month Outlook
Looking ahead to June, Warsh's first FOMC meeting (June 16-17) is the most critical macro event. The updated interest rate dot plot will be released concurrently, and the market will highly sensitively interpret his trade-offs between inflation and employment. If the April readings of 3.8% overall inflation and 2.8% core persist, Warsh will face immense pressure. If he adopts significantly hawkish language, Bitcoin's ability to hold above $75,000 will be tested. The May CPI data, to be released on June 10, is the last key inflation input before the dot plot. On the legislative front, the result of the full Senate vote on the CLARITY Act will be the most important regulatory signal of this cycle.
2. Crypto Market Overview
Cryptocurrency Data Analysis
Trading Volume & Daily Growth Rate
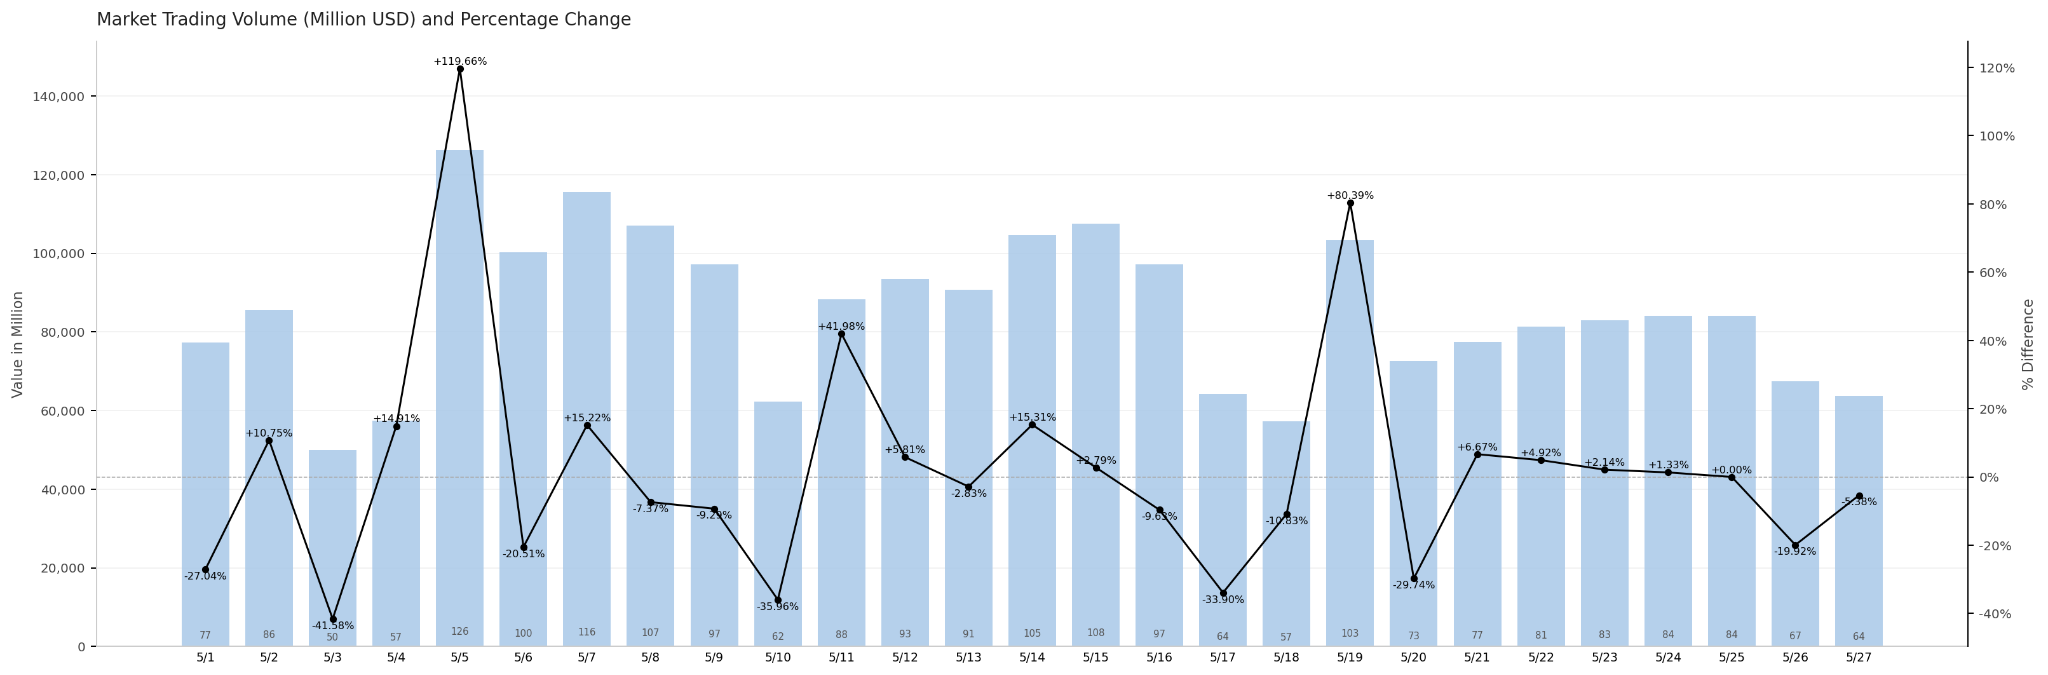
Market trading volume in May remained active overall, but the structure showed clear signs of a "price-volume divergence." Volume concentrated in two phases during the month. The first phase was from May 5 to 7, with daily turnovers reaching $126.2 billion, $100.3 billion, and $115.6 billion respectively – the highest levels of the month. During this period, market cap rose concurrently, a classic sign of a trend-driven rally with rising price and volume. The second phase occurred around May 14-15 and May 19, when volume picked up again to the hundreds of billions level, but market cap fell in tandem. This divergence of rising volume and falling price suggested bearish dominance and concentrated selling pressure. Towards month-end (May 26-27), volume shrank to $67.4 billion and $63.7 billion, the lowest range of the month, indicating a cautious turn in short-term market sentiment and increased hesitation among participants. Overall, the volume structure in May reveals a complete emotional evolution chain for the market: from "chasing gains" to "stop-loss exits" and finally to "wait-and-see dormancy."
Total Market Cap & Daily Change
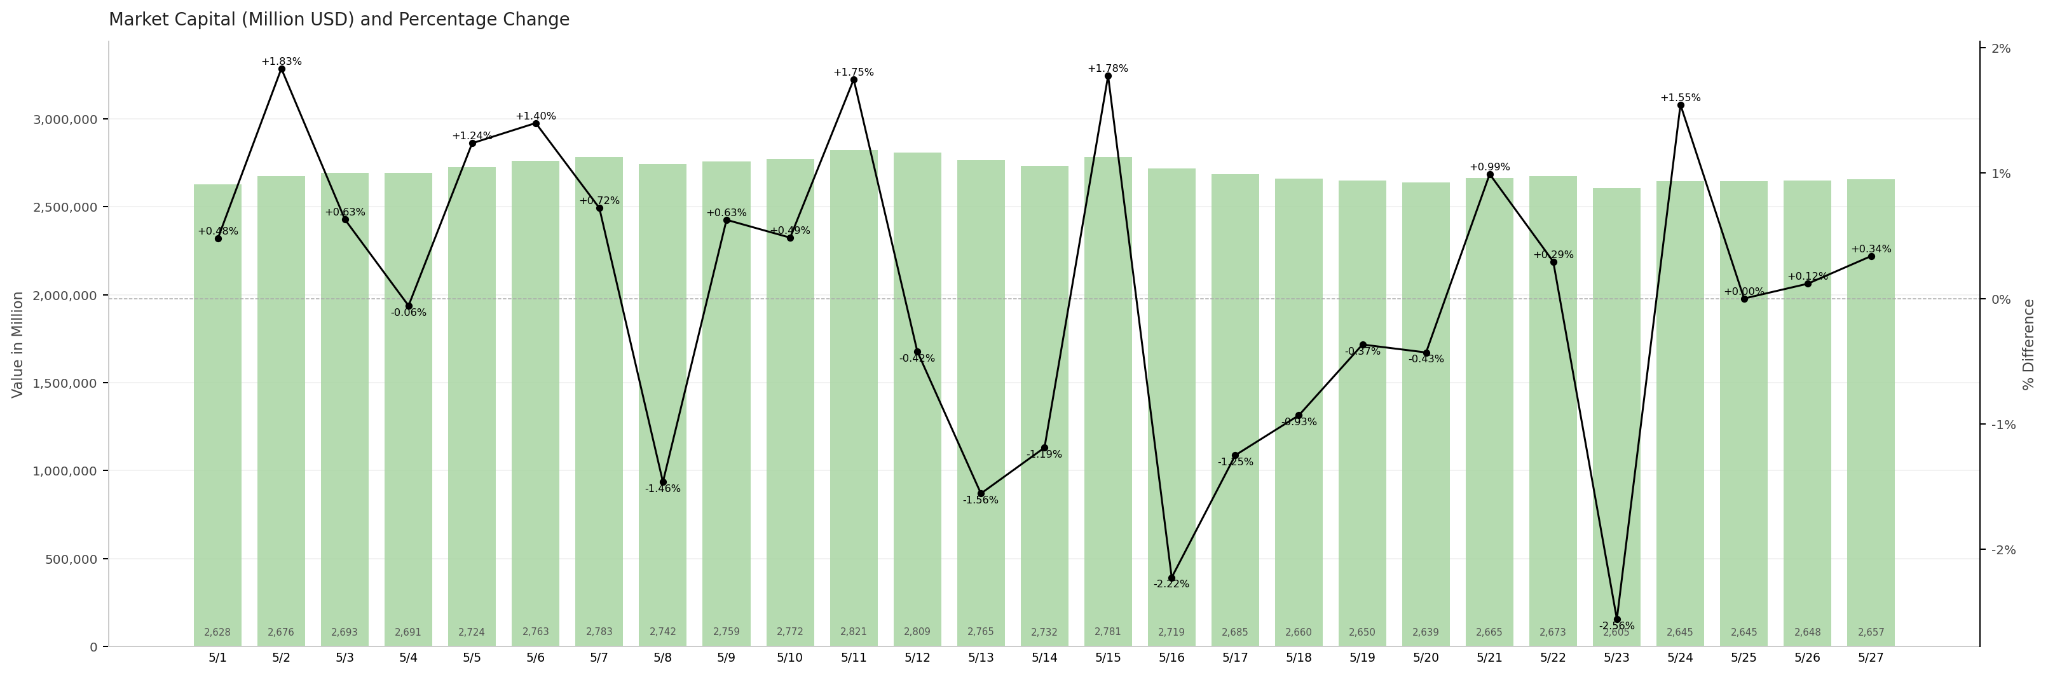
The total cryptocurrency market cap in May followed a "rise first, then fall, stabilizing at month-end" trajectory. Starting from the end of April's base of $2.615 trillion, the market cap climbed steadily as risk appetite rebounded and BTC broke through $80,000. It hit a monthly high of $2.821 trillion on May 11, a gain of 7.8% from the start of the month. However, the good times were short-lived. The release of the FOMC minutes on May 20, with their hawkish signals, caused a sharp reversal in sentiment. The market cap rapidly fell from its peak, dropping to a monthly low of $2.605 trillion on May 23, a decline of about 7.7% from the peak. It rebounded slightly to $2.657 trillion at month-end, roughly flat (+1.6%) compared to the end of April, erasing almost all the monthly gains. Overall, the "surge and fall" pattern of the total market cap in May clearly reflects the suppressing effect of macro disturbances on crypto market sentiment: short-term catalyst-driven rallies struggled to counter systemic risk aversion.
Hot Tokens in May
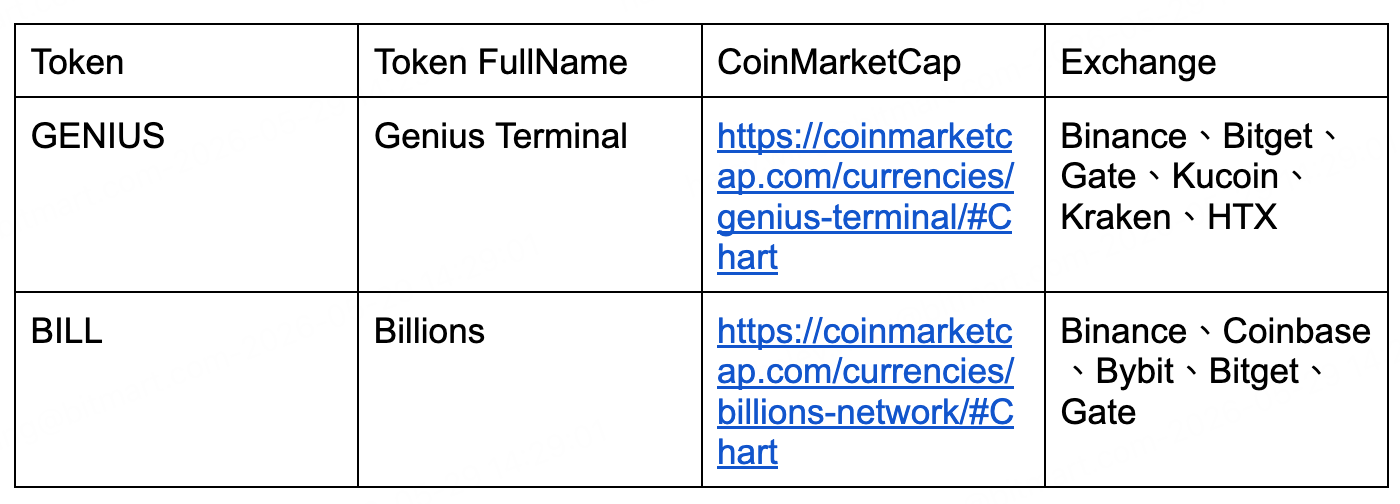 Among newly listed tokens in May, GENIUS and BILL represent the two main narrative threads currently favored by capital: on-chain trading infrastructure and AI identity verification. GENIUS, incubated by YZi Labs, is positioned as an all-in-one on-chain trading operating system. Its trading volume exceeded $2 billion in its first week on Binance. BILL, leveraging a ZK-proof-driven decentralized human identity protocol, surged over 10x from its TGE price after being endorsed by Coinbase Ventures and Polychain. Their common characteristics include strong backers, simultaneous listings on major exchanges, and clear product narratives. This confirms that in the current market environment, projects that can resonate with macro themes like AI and compliant infrastructure still enjoy significant liquidity premium advantages.
3. On-Chain Data Analysis
Analysis of BTC & ETH ETF Inflows/Outflows
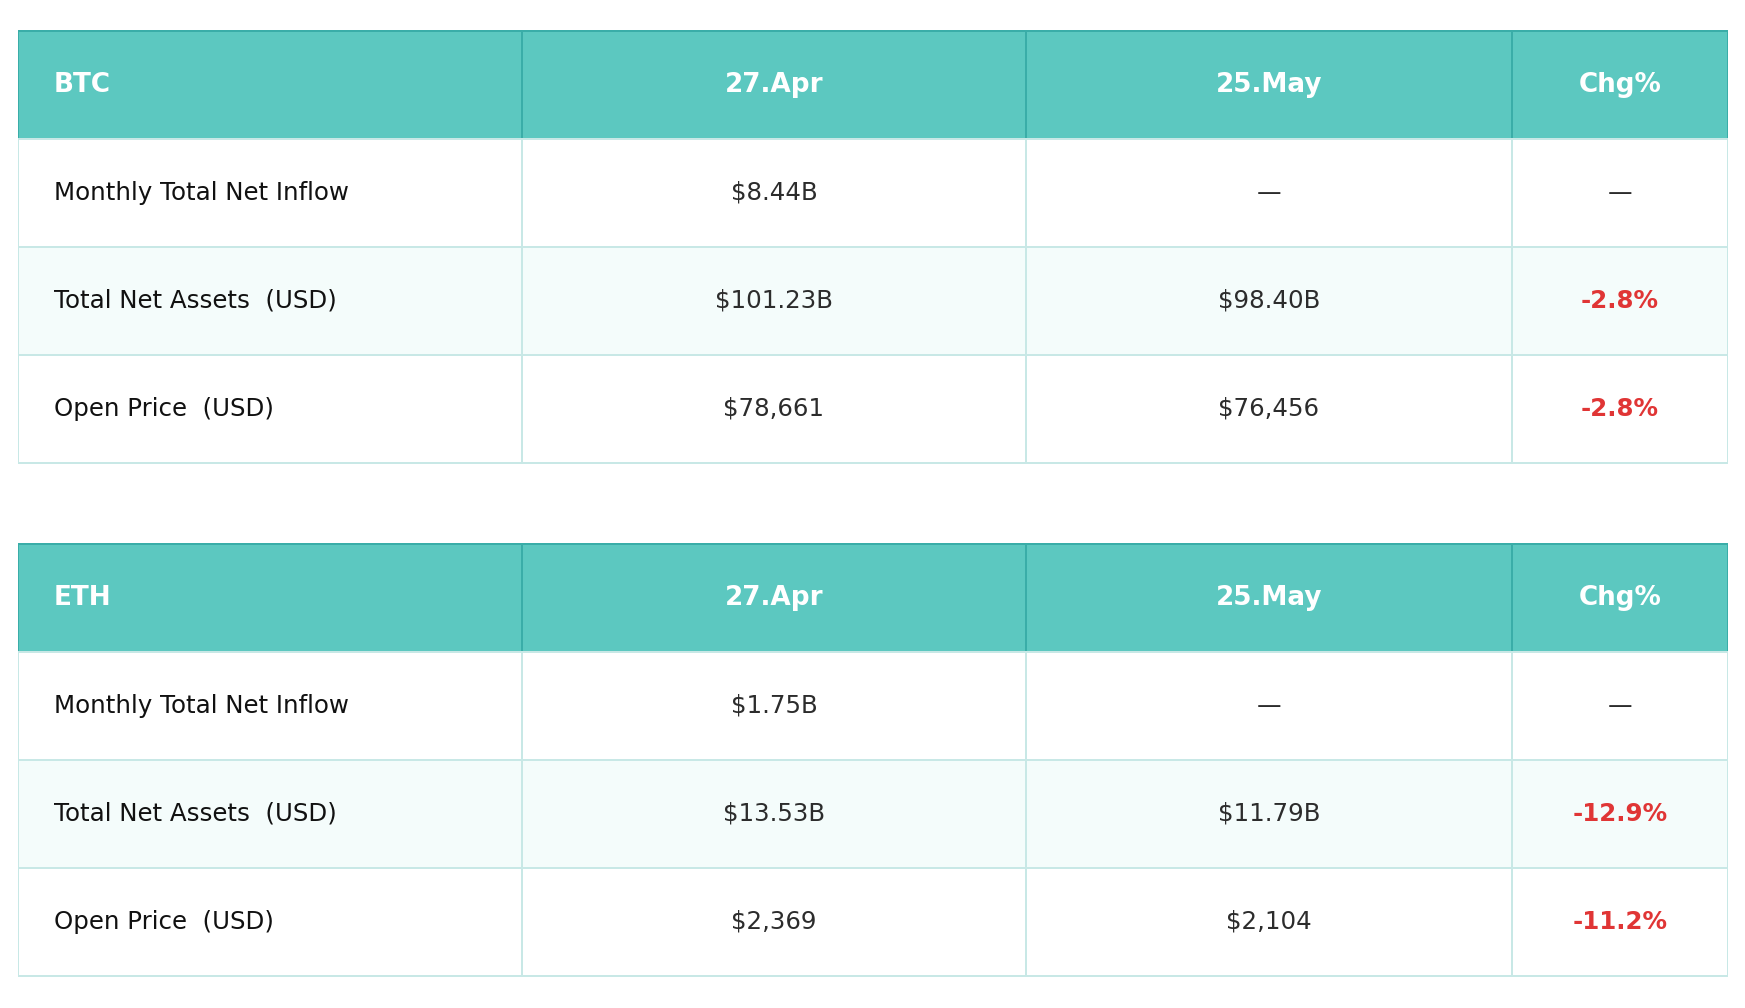
Spot BTC ETFs came under pressure in May, with net asset value declining from $101.23 billion at the end of April to $98.40 billion (-2.8%). This decline was largely in line with the concurrent BTC price drop, indicating relatively stable holdings, with the asset shrinkage mainly driven by price factors rather than large-scale redemptions. As of May 26, BTC ETFs saw a daily net outflow of $334 million, but cumulative net inflows had reached an all-time high of $56.75 billion, suggesting that the long-term institutional allocation logic remains intact. The pressure on ETH ETFs was more pronounced: net asset value fell from $13.53 billion to $11.79 billion (-12.9%). The ETH price fell 11.2% during the month, and coupled with marginal net outflows on the capital side, both factors dragged it down. On May 26, the ETH ETF saw a daily net outflow of $35.04 million, with a daily trading volume of only $614 million, a significant gap compared to BTC ($4.4 billion). This indicates that institutional willingness to allocate to ETH remains significantly weaker than to BTC. Overall, the May ETF data presents a pattern of "BTC resilient, ETH under pressure," consistent with the periodic contraction in market risk appetite. However, the massive cumulative holdings basis also suggests that institutional capital has not yet entered a systematic withdrawal mode.
Analysis of Stablecoin Inflows/Outflows
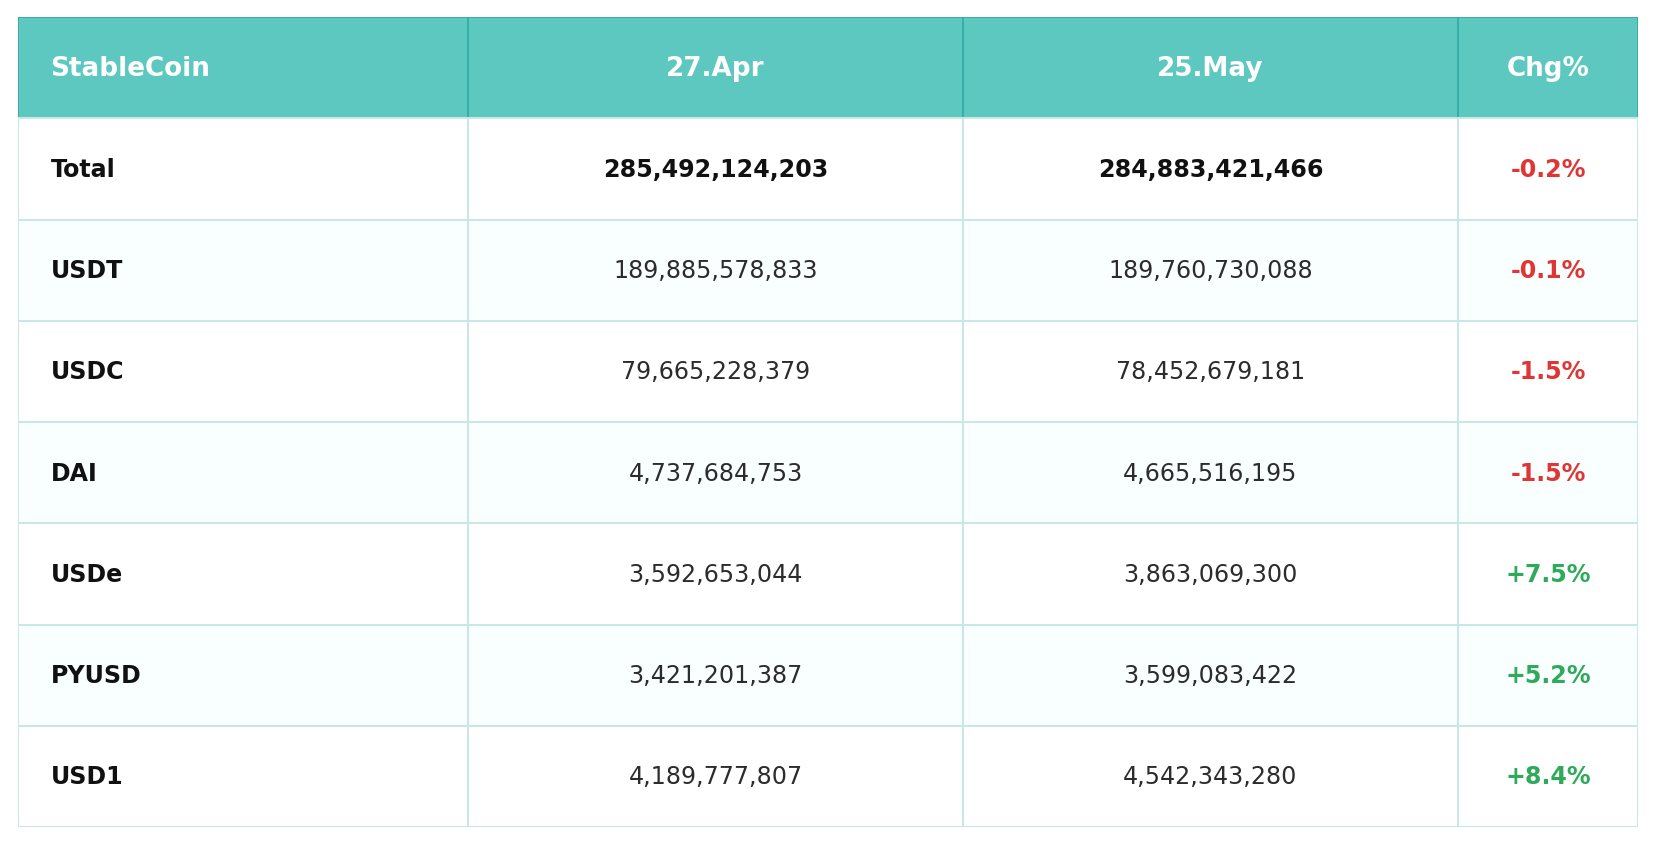
The total stablecoin market cap was roughly flat in May, contracting slightly from $285.49 billion on April 27 to $284.88 billion on May 25 (-0.2%), indicating no systemic exodus of capital from the crypto space. The structural differentiation is more noteworthy: the two major stablecoins, USDT (-0.1%) and USDC (-1.5%), saw a modest contraction in supply, possibly related to some institutions marginally reducing on-chain exposure amid rising macro uncertainty (Moody's downgrade of the U.S. sovereign rating, hawkish FOMC statements). Meanwhile, emerging stablecoins expanded counter-trend: USD1 grew 8.4%, USDe grew 7.5%, and PYUSD grew 5.2% during the month. The rapid growth of USD1 is particularly notable, highly resonant with the improved regulatory expectations catalyzed by the CLARITY Act's legislative progress. Overall, the stabilization of total stablecoin supply means the market has ample "dry powder," while the structural shift towards new varieties reflects capital pre-positioning for the compliant regulatory track.
4. Price Analysis of Major Cryptocurrencies
Bitcoin (BTC) Price Analysis
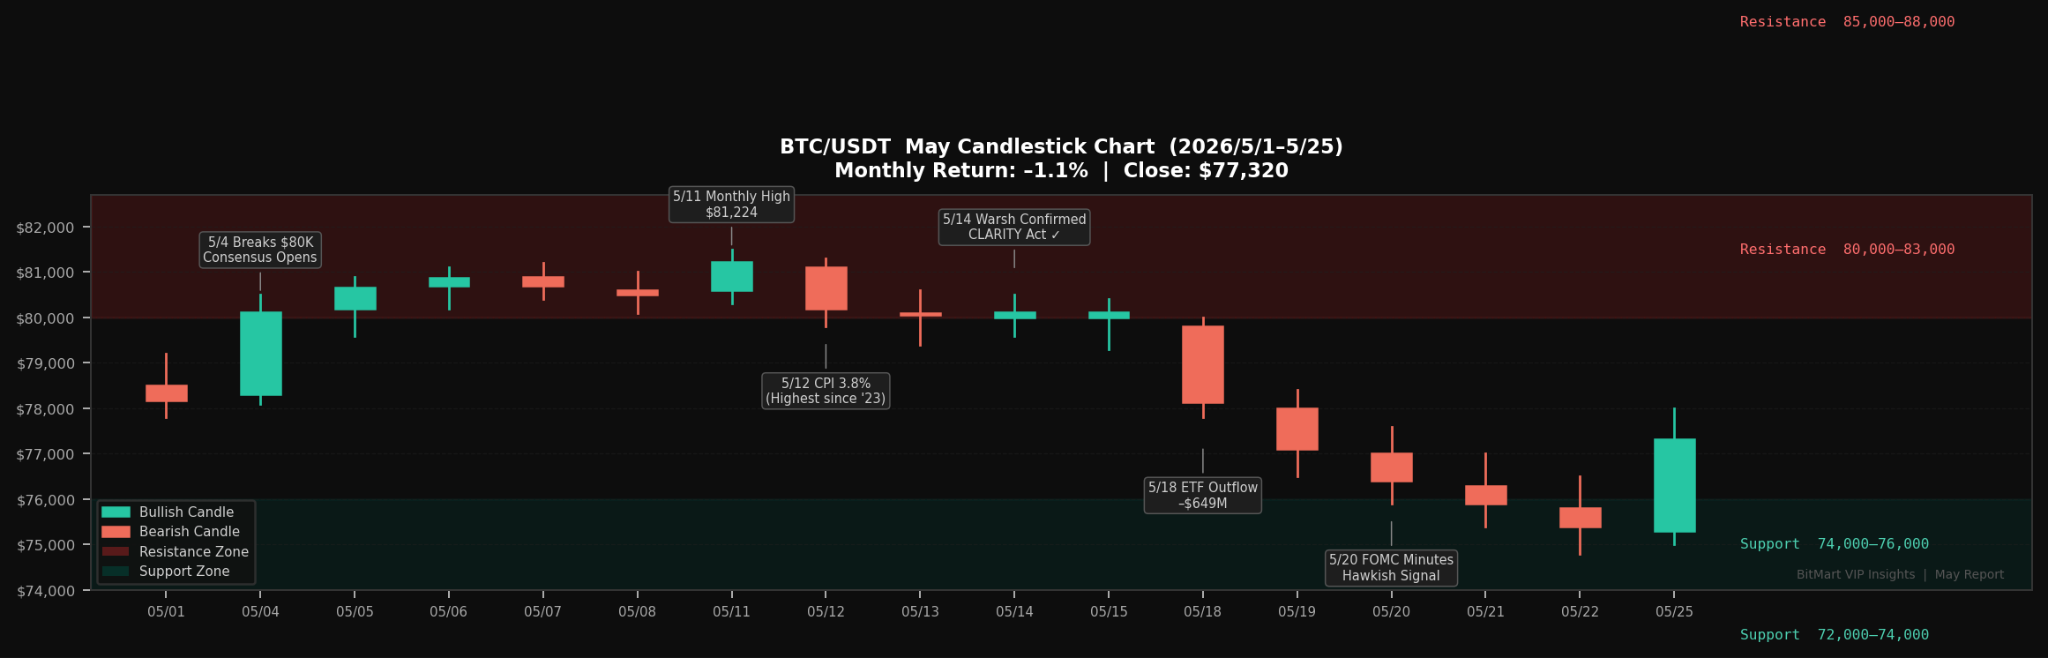
In May, Bitcoin completed its most anticipated technical breakout of the year so far, followed by a significant pullback. The month's trajectory unfolded in a three-stage structure: "volume breakout – institutional profit-taking – ETF capital exodus."
BTC started from around $78,661 at the end of April, opening May at $78,178. Fueled by the geopolitical ceasefire, the battle between bulls and bears intensified around the $80,000 mark. On May 4, BTC closed above $80,000 for the first time since January 2026, simultaneously triggering short liquidations of approximately $300 million, creating a brief mechanical acceleration upwards. BTC hit a


