
比特币反弹遇阻回落:78200美元变阻力,71400美元成关键支撑
- 核心观点:比特币结构上仍具韧性,已重回关键成本均线,但现货需求减弱、ETF资金流入放缓及多头仓位拥挤表明上行动能正在冷却,短期可能进入震荡盘整期。
- 关键要素:
- 比特币已收复真实市场均线(78,300美元),但历史周期表明需数周至数月盘整才能确认牛市转换。
- 30天已实现盈亏比SMA从0.4飙升至1.8,表明获利了结速度快于需求吸收能力,需持续站上2才能确认买方复苏。
- 近期成本基础78,200美元从支撑转为阻力,2-4月积累群体的成本基础71,400美元成为最直接支撑位。
- 现货市场走弱,总现货CVD偏向负值,Coinbase活动落后于Binance,机构现货参与度疲软。
- 宏观环境收紧,美元走强、收益率攀升及能源通胀压力限制了风险偏好,但比特币展现了相对韧性。
- 期权市场现防御性倾斜,偏度显示下行保护需求回升,75,000美元附近短Gamma区域易放大价格波动。
Original Author: Glassnode
Original Translation: AididiaoJP, Foresight News
Bitcoin remains structurally resilient, but weakening spot demand, slowing ETF inflows, and increasingly crowded long positions suggest that upward momentum is gradually cooling beneath the surface.
Summary
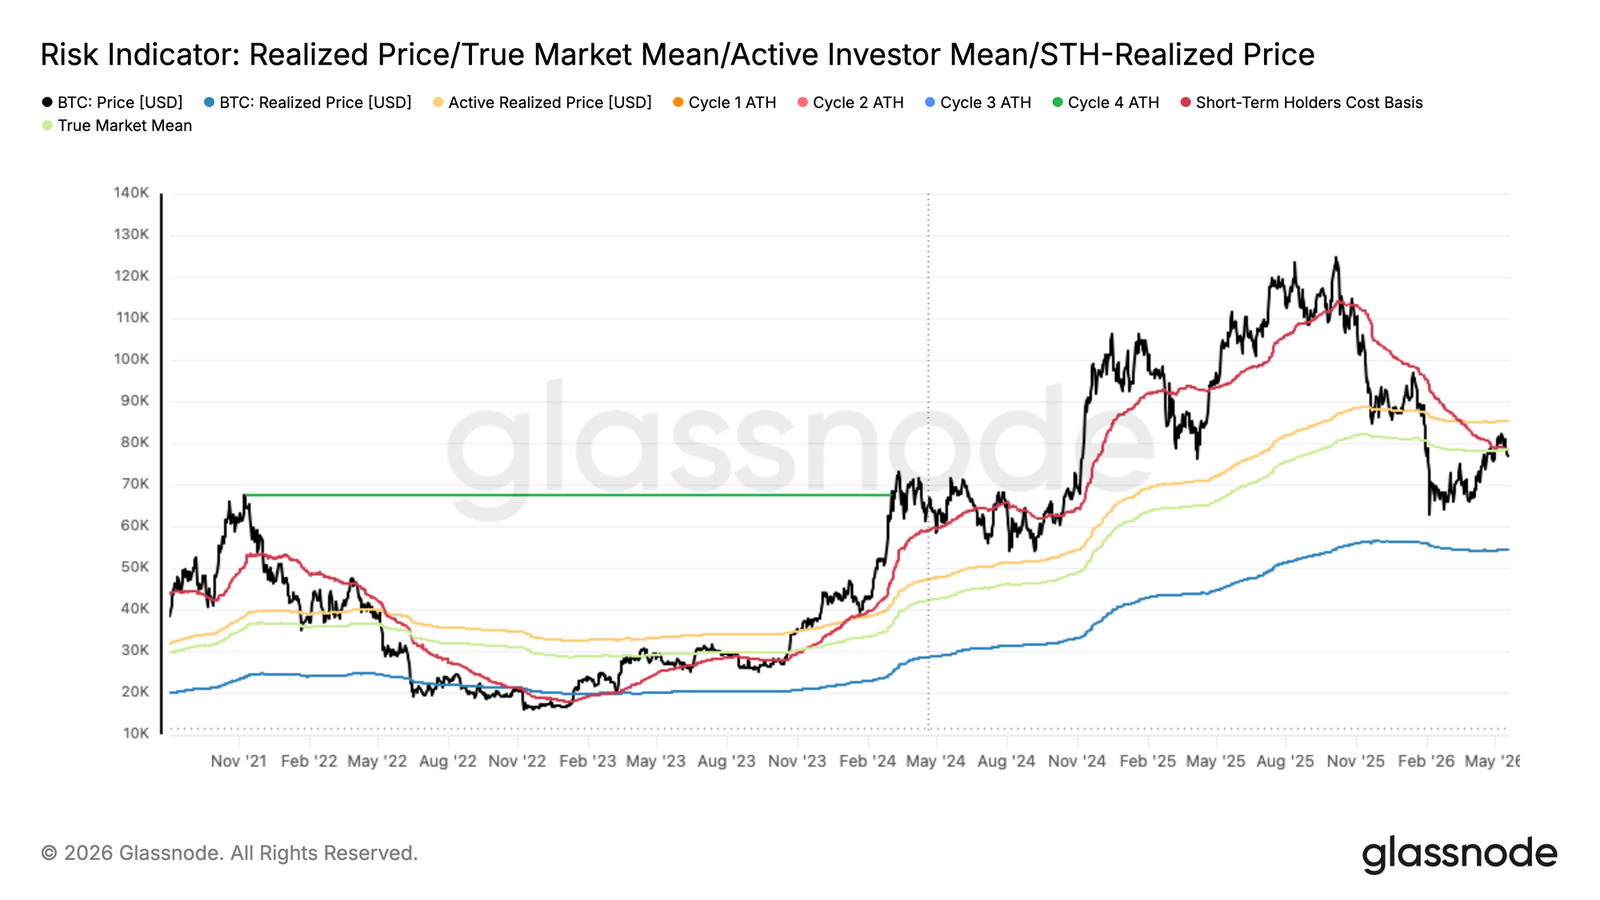
- Bitcoin has reclaimed the True Market Mean of $78,300 but failed to hold it steadily. Based on historical cycles, weeks to months of consolidation around this level are needed to confirm a credible bullish regime shift.
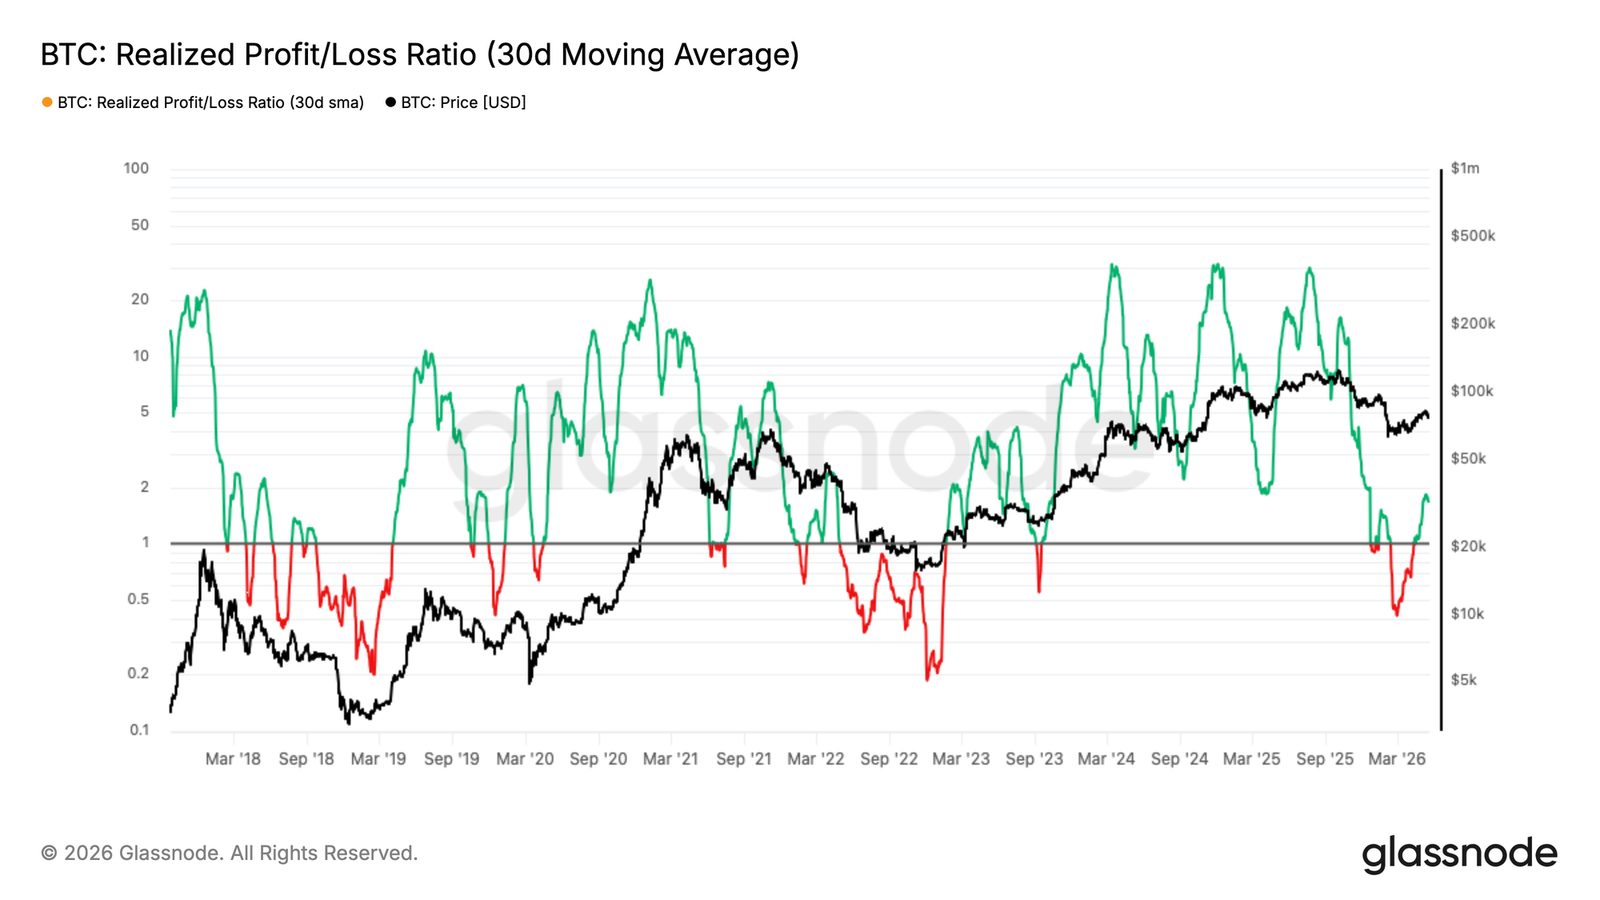
- The 30-day SMA of the realized profit-loss ratio surged from 0.4 in February to 1.8 during the rebound, indicating demand is insufficient to absorb the wave of profit-taking. A sustained hold above 2 is required to signal genuine buyer recovery.
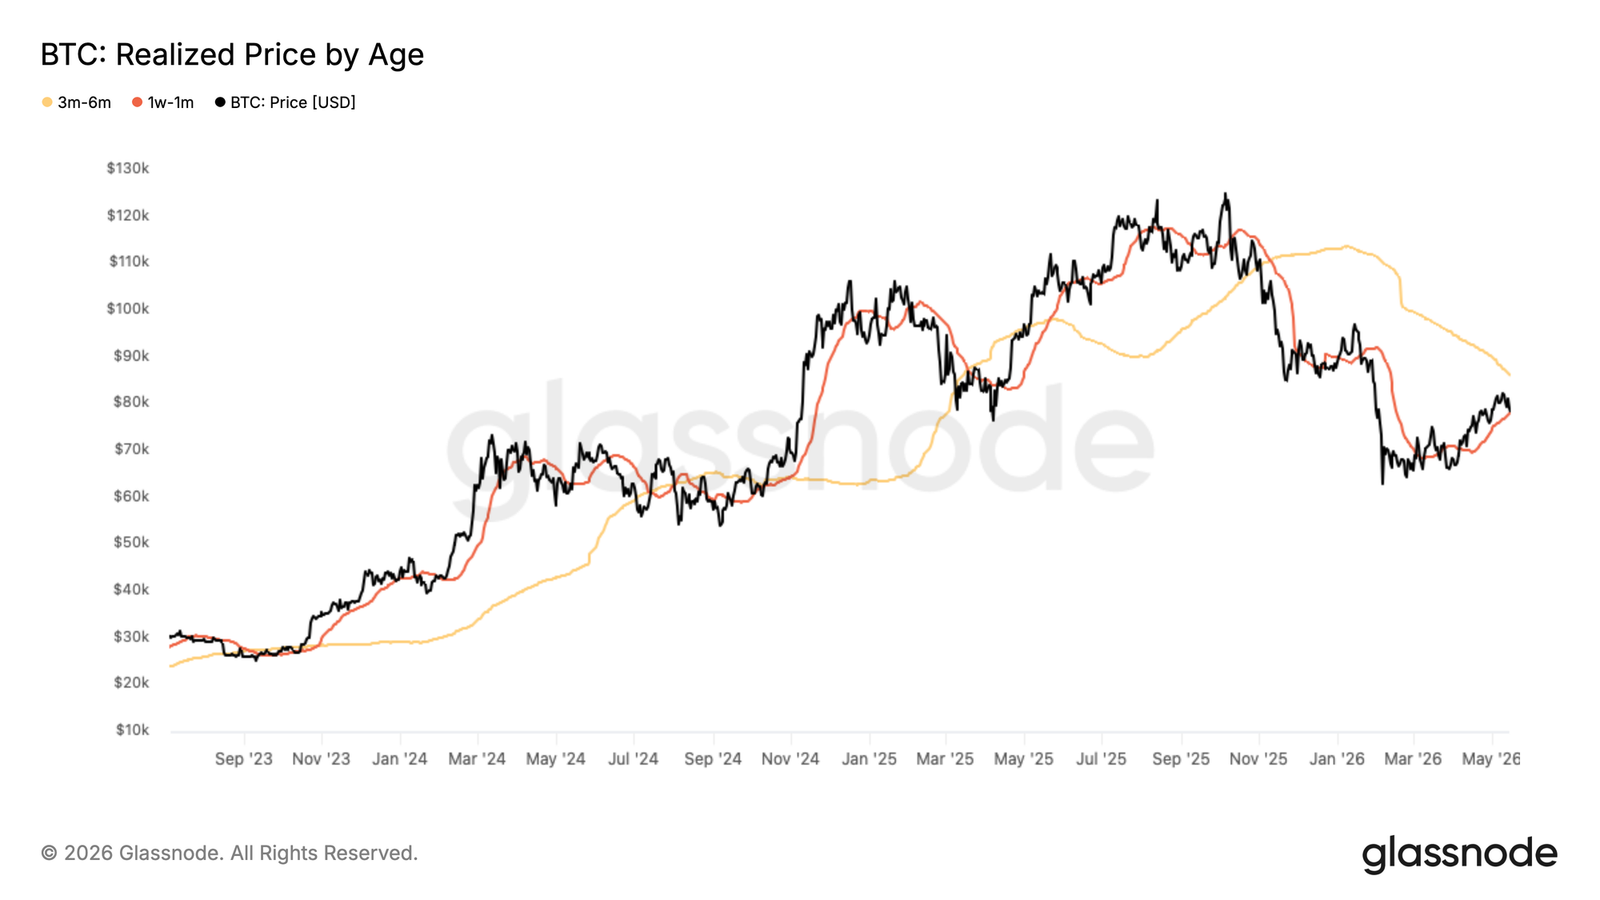
- The 30-day cost basis of $78,200 has shifted from support to overhead resistance, while the cost basis of the accumulation cohort from February to April, currently at $71,400, now serves as the most immediate support level for this pullback.
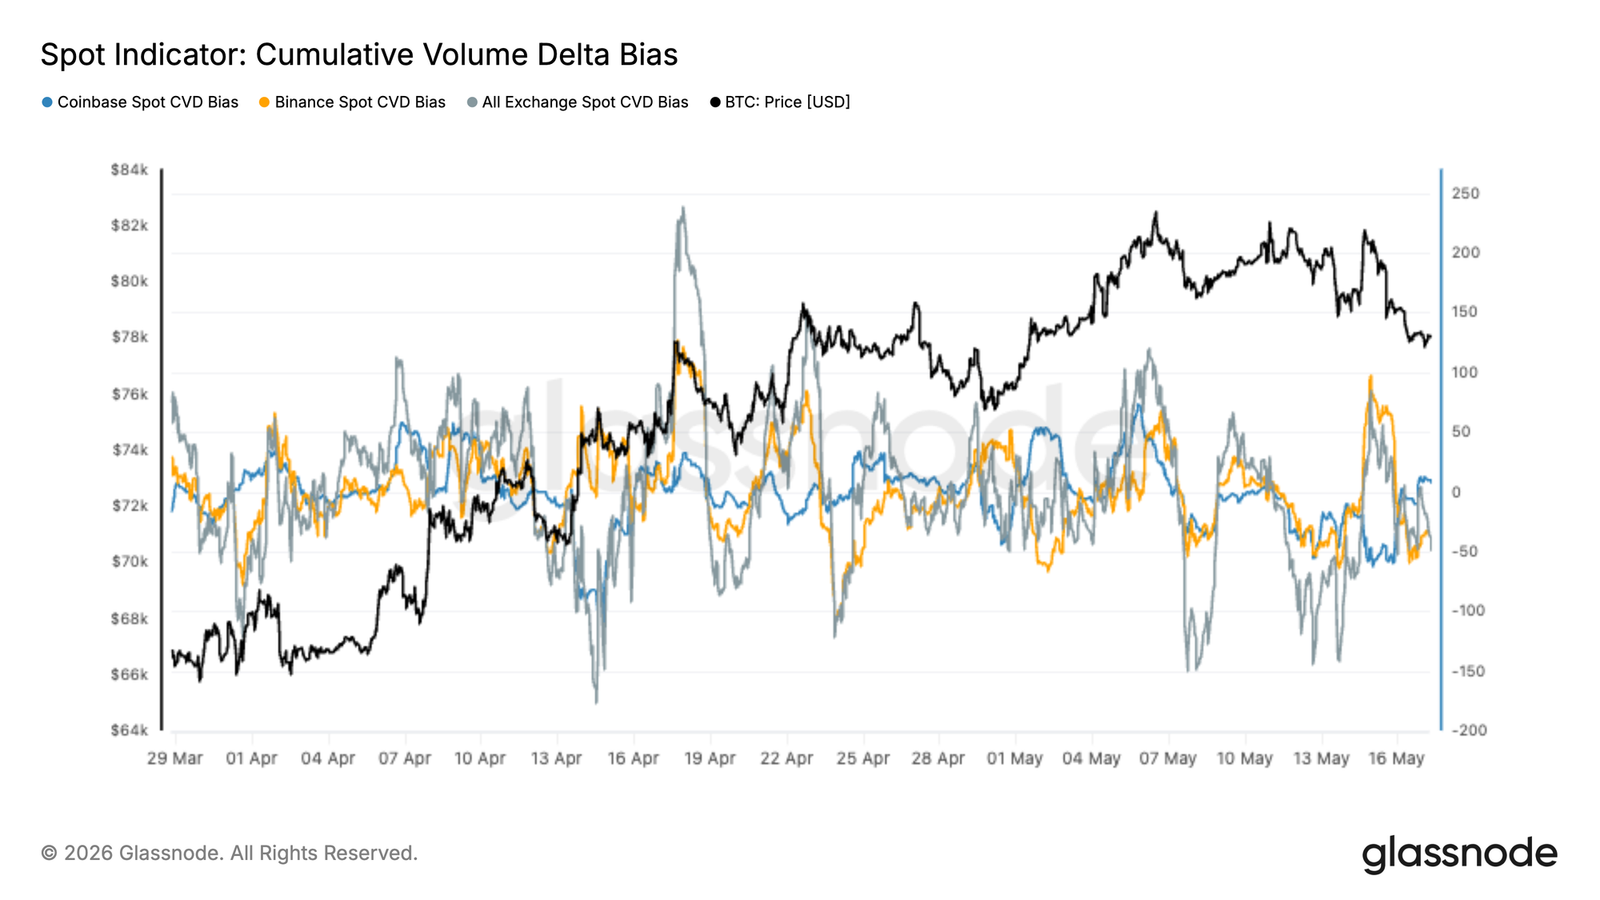
- Spot market internal indicators have weakened in recent weeks. The aggregate spot CVD remains predominantly negative, with Coinbase activity continuously lagging. This suggests that despite occasional bursts of speculative demand overseas, US institutional spot participation remains weak.
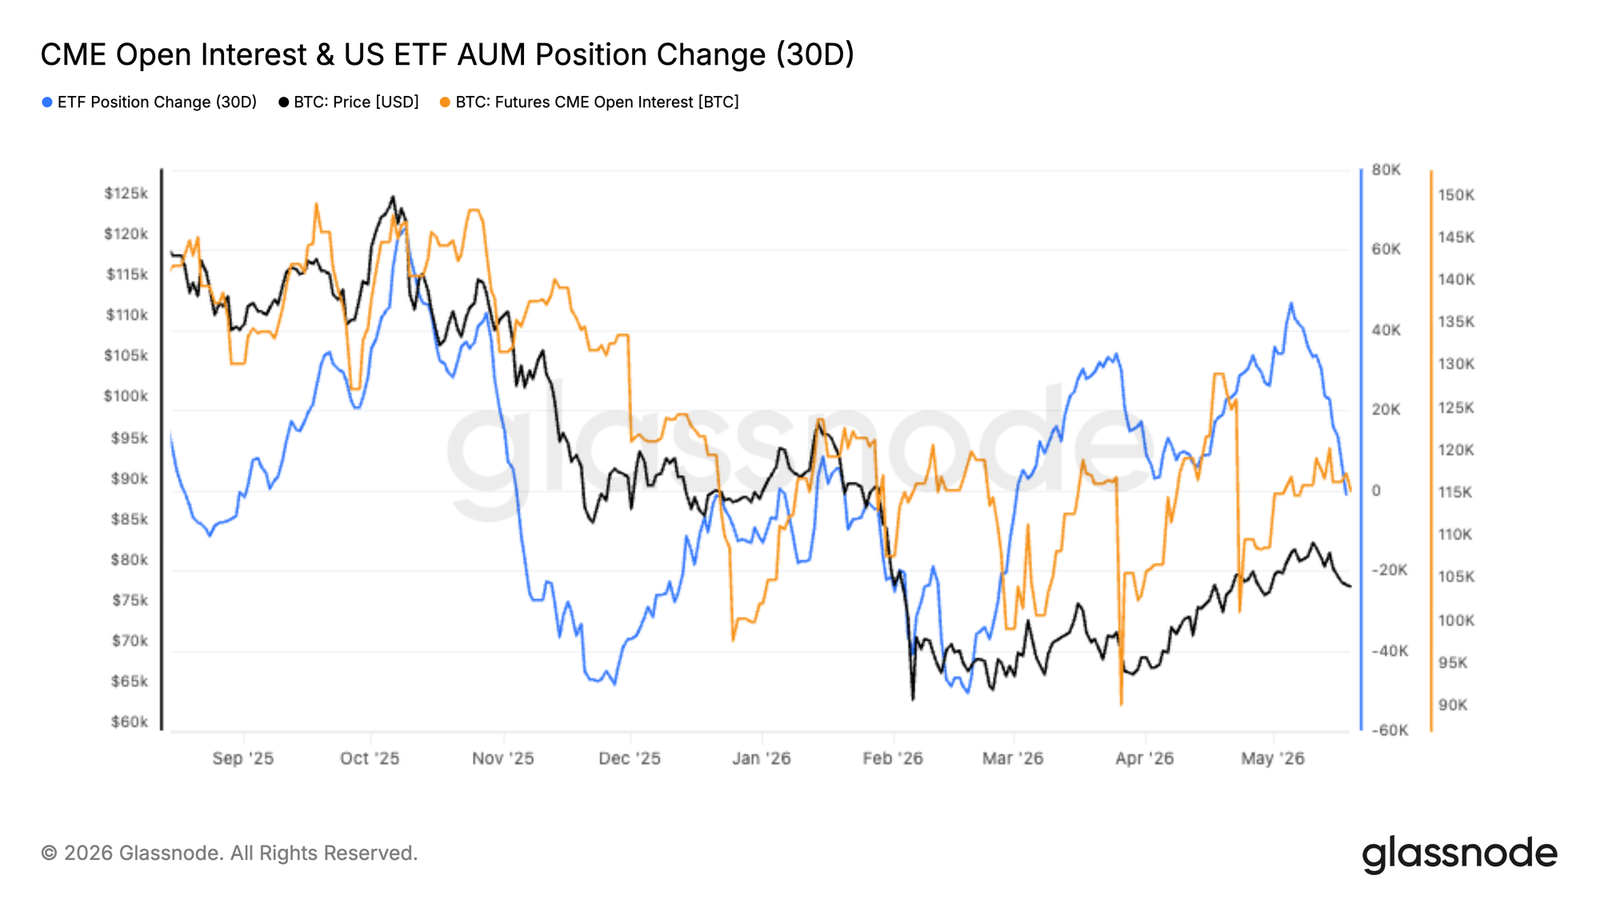
- CME futures open interest has continued to recover alongside the price, indicating improving institutional participation in the derivatives market, although spot demand remains indecisive near the upper end of the current range.
- Momentum in US spot ETF accumulation has recently begun to slow. The 30-day change in ETF holdings has noticeably flattened after strong buying in April and early May, suggesting that US institutional spot demand has become less aggressive near the upper end of the current price range.
- Implied volatility is rebuilding from low levels, concentrated in the front end, while longer-dated expectations remain stable. Realized volatility continues to decline, widening the volatility risk premium and making the cost of protection relatively cheap.
- Options positioning remains defensive. Skew shows increased demand for downside protection, and the short gamma zone near $75,000 leaves spot vulnerable to amplified hedging flows and sharper price movements.
Macro Overview
The macro backdrop has tightened notably, with markets facing a stronger US dollar, higher yields, and renewed inflationary pressures from energy markets. The DXY has risen to six-week highs, the US 10-year yield has climbed above 4.6%, and the 30-year yield is heading towards multi-year highs, reflecting a sharp repricing of rate expectations. Markets now assign a higher probability to a Fed rate hike before year-end, reversing previous expectations for easing.
Commodities are reinforcing this tighter macro shock. Oil remains elevated due to Middle East supply risks, keeping inflation expectations active and constraining the scope for rate cuts. Gold is struggling to extend gains amid rising real yields and a stronger dollar, indicating that safe-haven flows are being challenged by tighter financial conditions.
For digital assets, the landscape remains constructive but more fragile. Bitcoin's resilience in the face of higher yields and a stronger dollar suggests underlying demand persists, but the macro tailwind is no longer unequivocally positive. Sustained upside would likely require oil to stabilize, yields to pull back, and the DXY to lose momentum, thereby allowing liquidity conditions to ease and risk appetite to expand again.
On-Chain Insights
Testing the Bull-Bear Divide
The recent rally to $82,000 marked a significant recapture of the True Market Mean of $78,300. This pricing model tracks the average cost basis of actively traded Bitcoin supply and historically acts as the demarcation line between bear and bull markets. Reclaiming this level is necessary, but not sufficient, for a structural regime shift. By convention, the pre-bull phase requires sustained consolidation for weeks to months around this model to confirm a credible trend change. A single decisive break above the True Market Mean, while constructive, does not yet meet this criterion.
Therefore, any deeper pullback from current levels would redefine the recent rally as a local high within a continuing bear market. This structure has appeared multiple times in previous cycles and remains the higher-probability outcome until sustained follow-through is demonstrated.
Profit-Taking Outpacing Demand
Looking deeper into the internal mechanics of the recent rally, the realized profit-loss ratio provides a precise measure of market health. This metric tracks the ratio of the USD value of realized profits to losses on-chain. A value above 1 indicates profit-taking dominance, while below 1 reflects loss realization dominance.
The 30-day SMA of this ratio surged from the February low of 0.4 to 1.8, reflecting the logical shift in spending as prices recovered. However, the market's failure to sustain momentum amidst this rising wave of profit-taking suggests that demand has not yet fully recovered enough to absorb sellers capitalizing on the bounce exit opportunity.
A decisive and sustained stabilization of the 30-day (or 90-day) SMA of the realized profit-loss ratio above 2 for multiple weeks would constitute a more meaningful signal of genuine buyer conviction recovery and the market's ability to digest distribution pressure without rolling over.
Cost Basis Levels Define New Range
With the price falling back below the True Market Mean, the realized price metric segmented by holding period provides a granular framework for mapping the most immediate support and resistance levels. This model tracks the average purchase price of coins by holding period, directly mapping the behavioral anchors of different investor groups onto the price chart. The cost basis of the most recent 30-day accumulation wave, which drove the rally momentum, is approximately $78,200. With the price now below this level, this cohort has shifted to unrealized losses, transforming the former support floor into an overhead supply zone, adding extra selling pressure on any rally attempt.
Below spot, the cost basis of investors who accumulated during the February to April consolidation period (now classified as 1-3 month holders) lies near $71,400. As this group's profit margins shrink and they face increasing incentives to defend gains before conditions worsen further, this represents the most likely near-term support level.
Off-Chain Insights
Spot Selling Pressure Returns
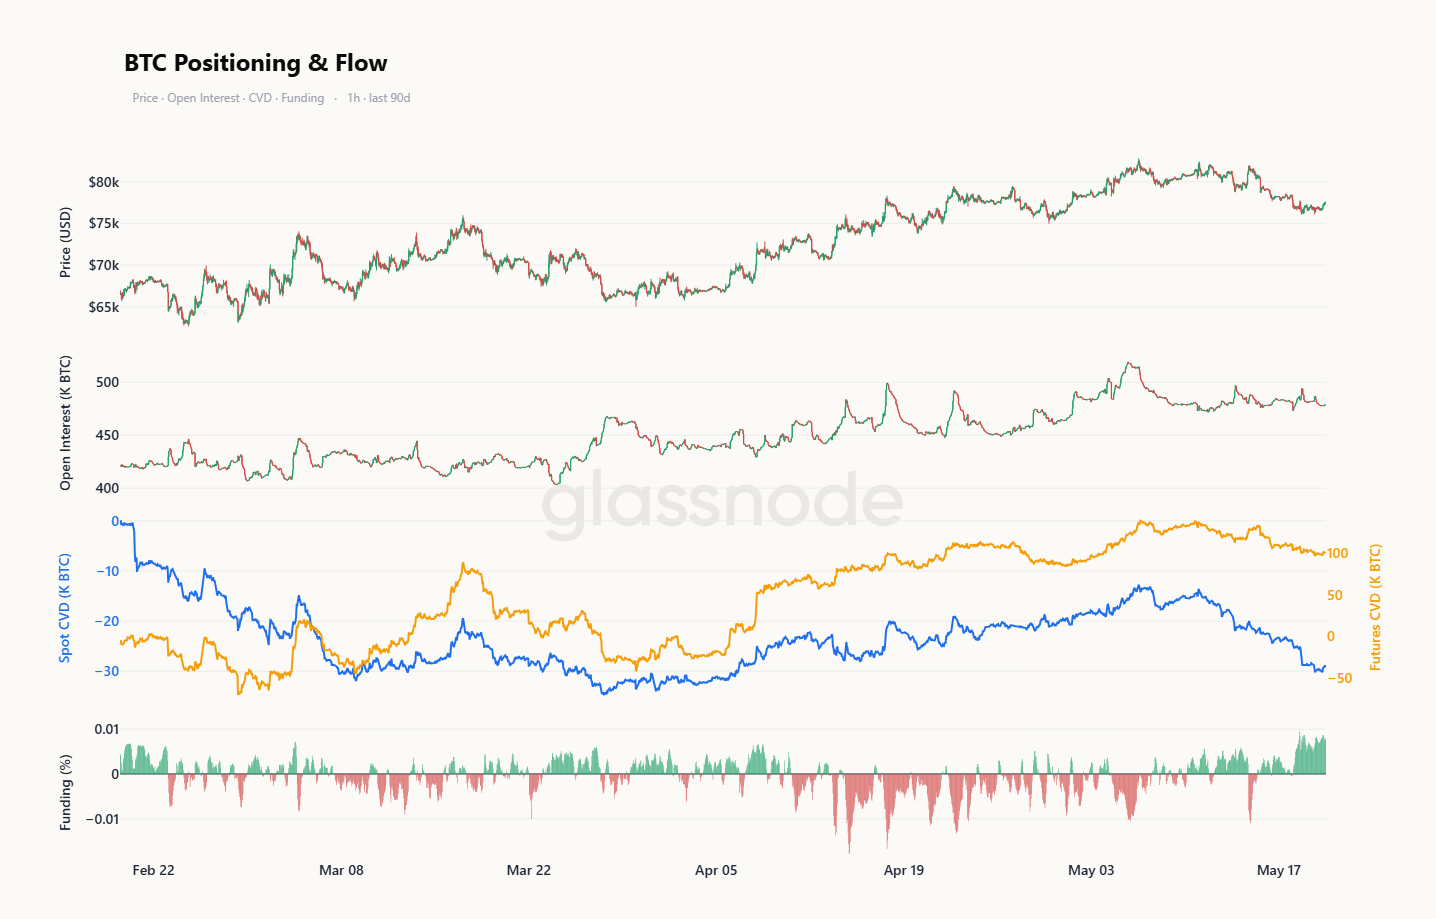
The latest spot flow data continues to show weak aggregate demand beneath the surface. The all-exchange spot CVD remained negative during the recent pullback towards the high $77,000s, indicating that selling pressure continues to outweigh aggressive spot buying across major trading venues.
Recently, Binance spot flows have recovered modestly from deep negative territory, while Coinbase activity remains relatively subdued. This divergence suggests stronger speculative participation overseas, while US institutional spot demand lacks conviction near current price levels.
Despite Bitcoin's relative structural resilience, the latest spot positioning data indicates that broad-based spot accumulation has not fully re-emerged.
CME Recovers While ETF Demand Slows
CME futures open interest has continued to rise steadily alongside Bitcoin's recovery to the low $80,000s, suggesting institutional traders are rebuilding exposure after the February sell-off. The revival in CME activity indicates that institutional participation in the derivatives market is growing, even as macro conditions remain restrictive.
Meanwhile, momentum in US spot ETF accumulation has begun to slow. The 30-day change in ETF holdings has noticeably flattened after strong buying in April and early May, suggesting that US institutional spot demand has become less aggressive near current price levels.
The result is a market increasingly driven by futures positioning rather than robust spot accumulation. Recent upside continues to attract leveraged participation, but the pace of fresh spot buying has slowed as Bitcoin approaches the upper end of its current range.
Weak Spot, Crowded Longs
The latest order flow data reveals that the recent pullback is primarily spot-driven beneath the surface. Futures open interest has only mildly declined, remaining elevated relative to the last time Bitcoin traded in this range, while the weakness in spot CVD is far more pronounced than in futures CVD. This suggests the recent downside is driven more by persistent spot selling than by aggressive short positioning.
Funding rates reinforce this picture. Rather than resetting as the price fell, funding rates remained positive and have recently begun to strengthen again, indicating that leveraged longs continue to pay fees to maintain their exposure amidst weakness.
Together, this paints a picture of the market maintaining elevated long positioning even as spot demand weakens—a pattern typically resolved either through spot buying or a broader derivatives reset.
Implied Volatility Rebuilding from Lows
Starting with implied volatility, the market is beginning to price in volatility again, but from a low base.
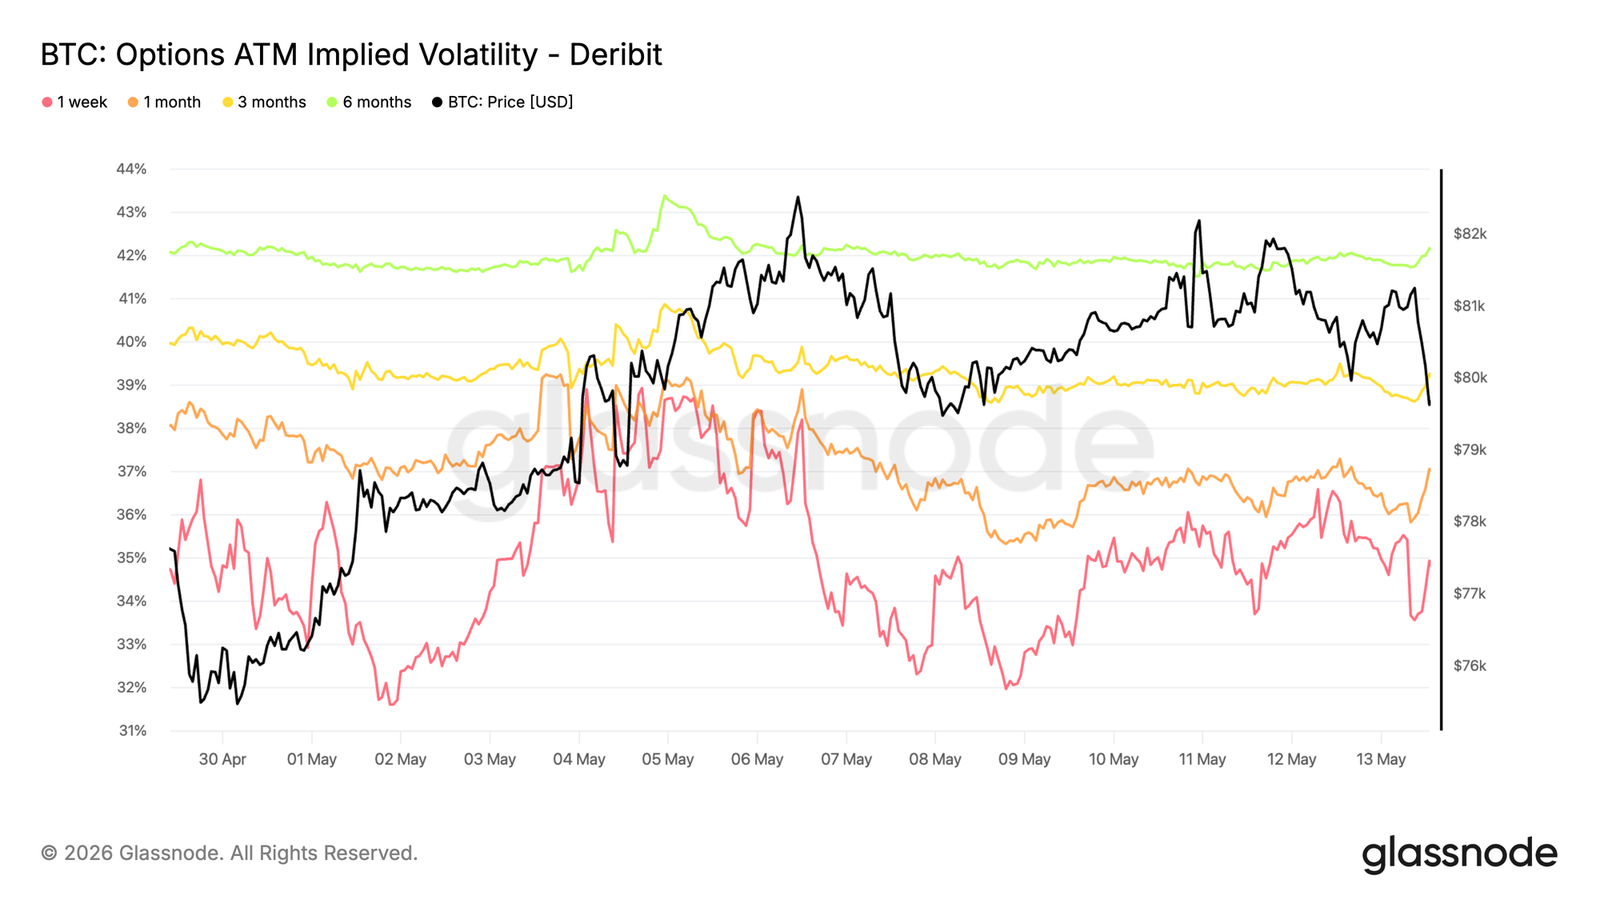
Bitcoin's implied volatility across tenors has risen compared to last week, with the front end moving from 32% to 36%. The 6-month tenor remains relatively stable near 42%, indicating that longer-dated expectations have changed little despite recent spot movements.
The chart shows the front-end reacting noticeably as spot moves within the range, while the back-end remains anchored. This suggests traders are paying slightly higher premiums for short-term options but have not yet priced in a broader regime shift for volatility.
With implied volatility still near recent lows, hedging costs remain relatively cheap, especially for short-term event risk.
The current structure reflects a moderate rebuilding of short-term volatility demand, while longer-dated expectations remain stable and largely unchanged.
Realized Volatility Declines, Volatility Risk Premium Widens
As implied volatility rebuilds moderately, realized volatility continues its trend decline.
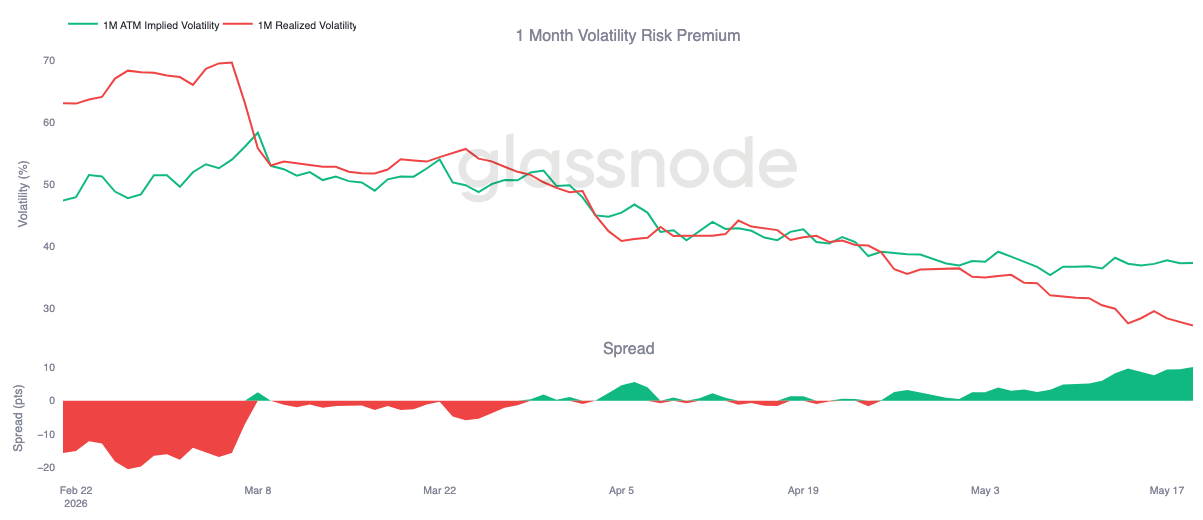
Bitcoin's 30-day realized volatility currently stands at 27%, extending the overall decline of recent weeks. Meanwhile, 1-month implied volatility remains near 37%, keeping implied volatility significantly above realized volatility.
This pushes the 1-month volatility risk premium back towards around 10 vol points, the highest level in recent weeks. The right side of the chart shows a steady widening, driven more by the continued compression of realized volatility as spot action stabilizes, rather than aggressive implied buying.
For hedgers, the key takeaway is that despite the recent rebuilding of implied volatility, the cost of protection remains relatively cheap.
The current structure reflects a market where realized volatility is declining faster than implied volatility can reprice lower, allowing the volatility risk premium to continue expanding.
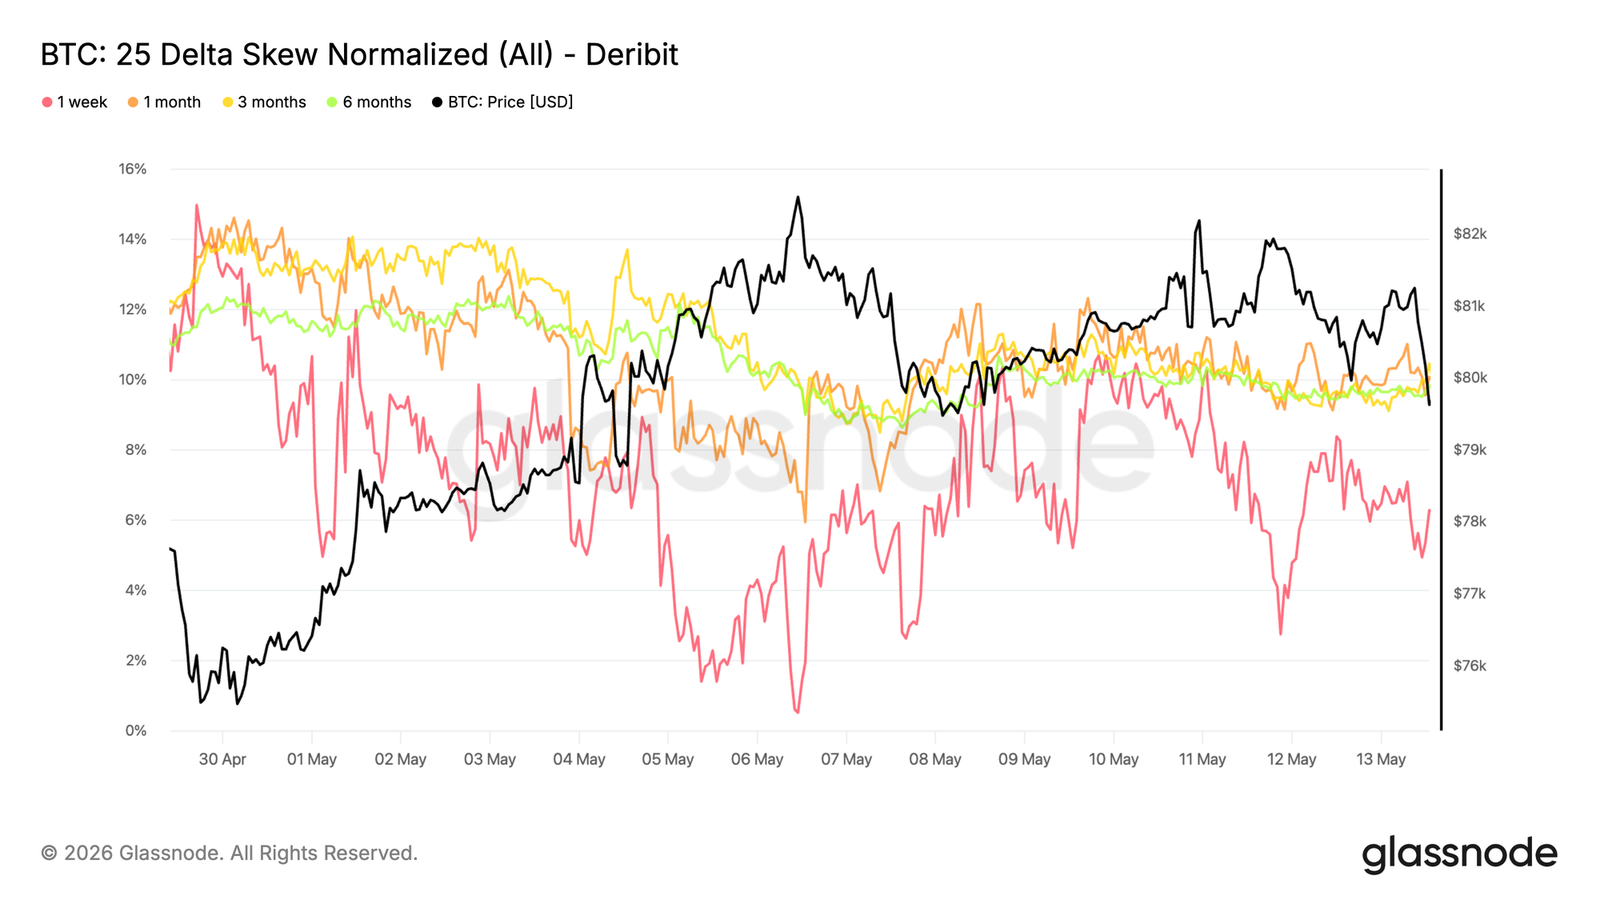
25 Delta Skew Shows Rising Downside Demand
While implied volatility has begun to rebuild modestly, skew indicates that traders are still predominantly bidding for protection rather than upside exposure.
Bitcoin's 25 delta skew has become more bearish over the past week, with traders paying higher premiums for downside protection across all tenors. This shift is most pronounced at the front end, where skew rose from 2.7% to 6.2%, indicating a significant increase in short-term put demand.
Longer tenors also show higher put premiums, though to a lesser extent, with the 6-month tenor remaining near the 10% range. This suggests the market is not only hedging short-term risks but also maintaining a broader preference for downside protection.
The current skew structure reflects a clear defensive tilt, with short-term hedging demand rebuilding even as implied volatility remains relatively low.
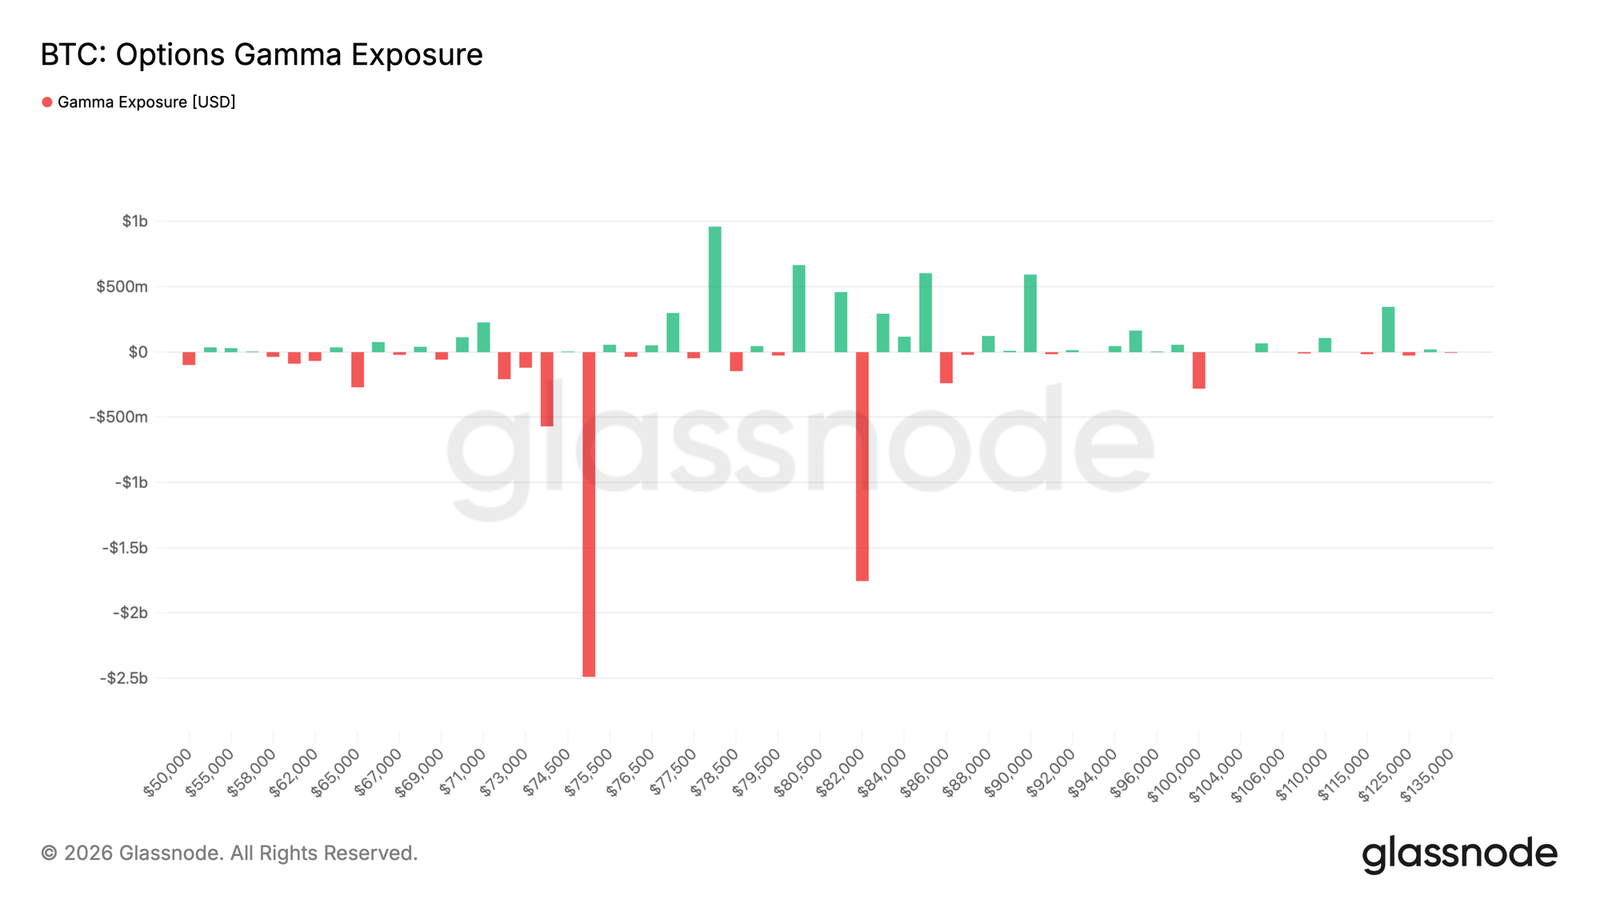
Gamma Exposure Reveals Vulnerable Price Zone
The largest short gamma cluster resides near the $75,000 strike price, with approximately $2.5 billion in negative exposure below the current spot price of $77,500. Another large short gamma cluster remains near $82,000, with exposure close to $2 billion. However, there is nearly $2 billion in positive gamma spread across three strikes above spot, forming a resistance zone before reaching the higher short gamma acceleration zone at $82,000.
This structure leaves spot more sensitive to sharp downward moves near the major negative gamma strike of $75,000, where dealer hedging flows could amplify weakness. This accumulation aligns with recent flow activity. Over the past 7 days, put buying constituted 55.5% of taker premium flow, rising to over 90% in the past 24 hours, indicating a clear rotation towards downside hedging.
The current gamma distribution reflects a more fragile structure, where concentrated put demand has created critical zones that could amplify volatility if spot re-enters them.
Conclusion
Bitcoin remains in a structurally constructive position, but the latest positioning and flow data suggest that momentum is becoming increasingly selective beneath the surface. Institutional futures participation continues to recover, and prices remain resilient above key support levels. However, broad-based spot demand has not yet fully re-accelerated, particularly at US institutional venues.
Meanwhile, options positioning and the volatility market point to a more cautious environment forming near the upper end of the current range. The combination of weaker aggregate spot accumulation, softer ETF momentum, and renewed demand for downside hedging suggests the market is still searching for a stronger catalyst capable of sustaining expansion above the low $80,000s.
In summary, the broader trend remains constructive, but the latest data suggests the market is increasingly driven by positioning and derivatives activity rather than widespread spot conviction. Until liquidity conditions improve further and stronger spot demand re-emerges, Bitcoin may continue to experience more choppy price action within its current range.


