
BTC's roller-coaster ride, HYPE hitting new highs repeatedly | Expert Analysis
- Core View: Bitcoin is currently at a critical juncture for direction. The outcome of the battle between bulls and bears in the $78,500-$79,500 range will determine whether the market embarks on a new uptrend or continues the B-wave rebound within a monthly-level major correction.
- Key Factors:
- Since the rebound from the February low ($60,000), the market has been considering two possible paths: Path 1 views it as the start of an upward impulse wave, while Path 2 views it as a B-wave rebound within a monthly-level correction. No conclusion has been reached yet.
- Whether the rebound can break through the $90,000-$93,100 area is a key quantitative threshold for determining if the market structure has fundamentally changed.
- From a monthly perspective, the current market is in a corrective cycle from the 3rd to 4th segment. If following the principle of cycle alternation, Path 2 (B-wave rebound) has a higher probability, and the bottom structure is more likely to form in the fourth quarter of this year.
- On the 4-hour timeframe, the price has broken below the central support area ($78,500-$79,200). If this breakdown is confirmed as valid, a daily-level correction structure may commence.
- Last week, based on model signals, a short-term long trade was executed, opening at $79,812 and closing at $81,426, achieving a profit of approximately 2.02%.
After this week, it feels like being on a roller coaster.
This week, macro pressures were released in a concentrated manner — the bond market crashed, interest rate hike expectations intensified, oil prices broke $110, and BTC dropped below $78K, currently hovering within a critical range.
Structurally, I focused on analyzing two path scenarios since the February low: has a new uptrend already started, or is this just a B-wave rebound within a larger monthly-level correction? This judgment remains inconclusive for now, but the outcome of the bulls-and-bears battle in the $78,500-$79,500 area serves as the most important observation window this week.
In terms of operations, I'm staying on the sidelines for mid-term positions, and for short-term trades, I've prepared Plan A and B around support and resistance levels, keeping positions under 30% and strictly adhering to stop-losses.
Summary of Core Trading Views for This Week:
• BTC multi-timeframe structure analysis (comparison of two subsequent scenarios) (Detailed in Part 1)
• BTC price forecast and mid/short-term trading strategies for this week (Detailed in Part 2)
• HYPE daily-level structure analysis (Detailed in Part 3)
• HYPE price forecast and short-term trading strategies for this week (Detailed in Part 4)
Market Validation of Last Week's Trading Strategy and Core Views:
• BTC Short-term Trade Outcome: Last week, Bitcoin completed one short-term long trade (1x leverage), successfully achieving a profit of approximately 2.02%. (Detailed in Table 1)
• Market Validation of BTC Price Forecast: In last week's article, we pointed out that the market was likely to engage in a high-level wide range oscillation around the $79,500~$80,600 area. Current market movements have validated our previous forecast.
I. Let's First Look at the BTC Scenario
1. Analysis of BTC's Structure Since the February Low: Two Key Path Scenarios and the Bulls vs. Bears Game
In previous weekly reviews, we proposed three main wave structure scenarios in our analysis of Bitcoin's daily-level correction structure since the October 2025 high ($126,200). Currently, because in Scenario 2 (a complex five-wave correction structure), the rebound cycle of Wave D has significantly exceeded the preceding Wave B, overly extending in the time dimension and disrupting the balance of the wave structure, its probability has substantially decreased. Therefore, the core market divergence and future direction choice will focus on the other two scenarios. This issue will conduct an in-depth analysis and probability comparison of these two path scenarios.
①. Path 1: Correction Ended, New Uptrend Started (Bullish Mindset)
Bitcoin _ Daily K-line Chart:
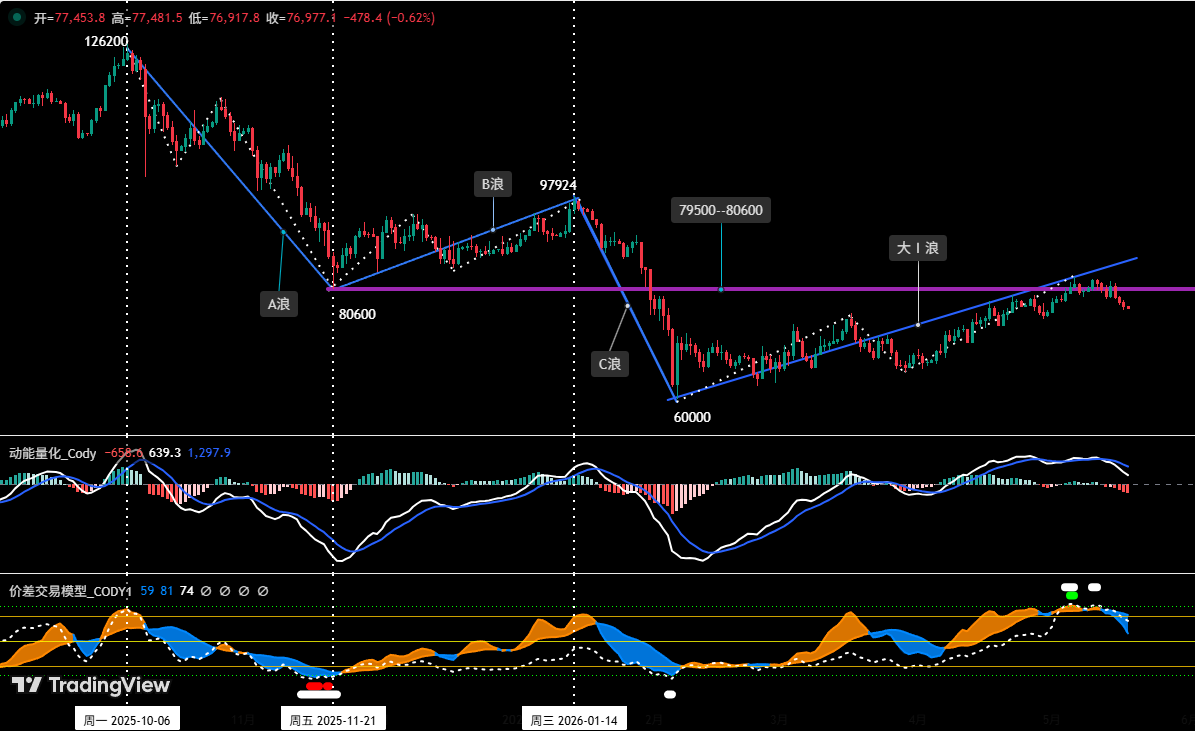
Figure 1
As shown in (Figure 1), this view suggests that the daily-level correction starting from the previous high of $126,200 has completed an A-B-C three-wave structure, where Wave C ended at $60,000 (the February 6 low). The market has transitioned from a downtrend to an uptrend. It is currently running the Major Wave I (the initial uptrend wave). (This has been detailed in previous articles and will not be repeated here.)
• Major Wave I (Initial Uptrend Wave): $60,000 (2026-02-06) to present, running for approximately 100 days, with a maximum gain of about 38.1% during the period. It is still in progress.
• Potential Major Wave II (Corrective Wave): The corrective wave expected after Major Wave I ends, whose low will not break below $60,000.
②. Path 2: Monthly-Level Correction Structure, Currently in B-Wave Rebound (Bearish Mindset)
Bitcoin _ Monthly K-line Chart:
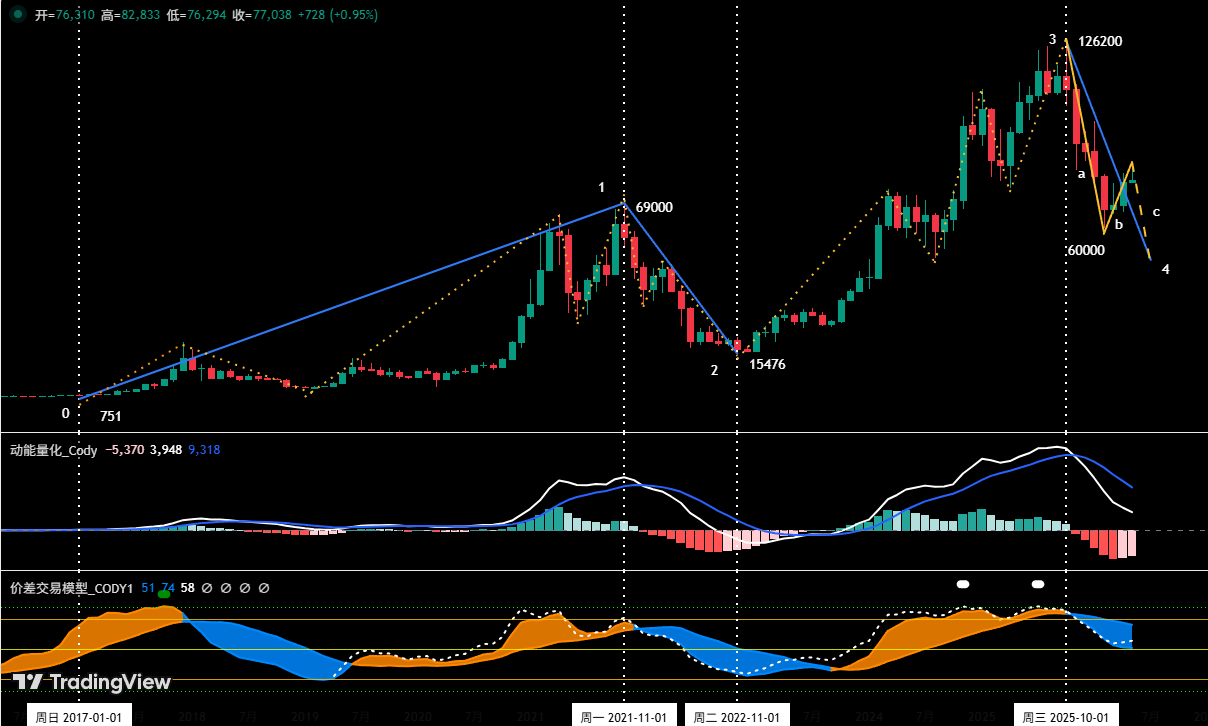
Figure 2
As shown in (Figure 2), this view suggests that the correction starting from the previous high of $126,200 may present a monthly-level a-b-c three-wave correction structure, currently undergoing a b-wave rebound.
• Wave a (Downward Wave): $126,200 (2025-10-06) to $60,000 (2026-02-06), lasting about 4 months (approx. 122 days), with a maximum decline of about 52.5%.
• Wave b (Rebound Wave): $60,000 (2026-02-06) to present, lasting over 3 months (approx. 100 days), with a maximum gain of about 38.1%. It is still in progress.
• Potential Wave c (Downward Wave): The corrective wave expected after the b-wave rebound ends, whose low might break below the $60,000 threshold.
③. Assessing the Probability of "Path 2" from a Monthly Perspective
The Bitcoin monthly chart shows: From January 1, 2017, to the present (using only this segment of complete trading data), it can be subdivided into a 4-segment structure:
• Segment 0-1 (Uptrend Cycle): From $751 (2017-01-01) to $69,000 (2021-11-10), lasting approximately 59 months (about 1,774 days).
• Segment 1-2 (Correction Cycle): From $69,000 (2021-11-10) to $15,476 (2022-11-21), lasting approximately 13 months (about 376 days). A deep retracement of the previous uptrend phase (Segment 0-1), with a maximum decline of about 77.57%.
• Segment 2-3 (Uptrend Cycle): From $15,476 (2022-11-21) to $126,200 (2025-10-06), lasting approximately 35 months (1,050 days). The main uptrend that created a new all-time high, with a maximum gain of about 715.46%.
• Segment 3-4 (Correction Cycle): From $126,200 (2025-10-06) to the present, approximately 7 months (about 223 days), with a maximum decline of 52.46%. It is still in progress. A retracement of the previous main uptrend phase (Segment 2-3).
• From a monthly level perspective, the current market is in the correction cycle of Segment 3-4. If it follows the principles of cycle alternation and time symmetry, and maintains a certain proportional relationship in magnitude and time with "Segment 1-2" and "Segment 2-3", then the probability of the correction structure described in "Path 2" occurring increases significantly. This means the current rebound since the February 6 low is only a part of a larger-scale correction.
④, Based on the analysis of the two path scenarios above, both are realistically possible in the current macro and technical environment. To study their relative probability, the core lies in examining the nature of the rebound rally initiated since the February 6 low. Its running time span and spatial magnitude have become key judgment criteria.
⑤, Our core views are as follows:
• If this rebound exhausts itself and ends in the near term, the probability of the market choosing "Path 2" will increase significantly.
• Conversely, if the rebound continues to extend in both time and space, the possibility of the market choosing "Path 1" will increase substantially.
To this end, we propose an observable quantitative threshold: If the height of this rebound can break through the $90,000 to $93,100 area, it could become an important factor in confirming whether the market structure has undergone an essential transformation.
We also believe that, regardless of which path the market chooses, by analyzing historical cycle patterns and macro liquidity expectations, a relatively reliable bottom structure is more likely to gradually form and be confirmed in the fourth quarter of this year.
2. In-depth Analysis of BTC's Hourly-Level Structure: (Using 4-hour as the analysis timeframe)
Bitcoin _ 4-hour K-line Chart
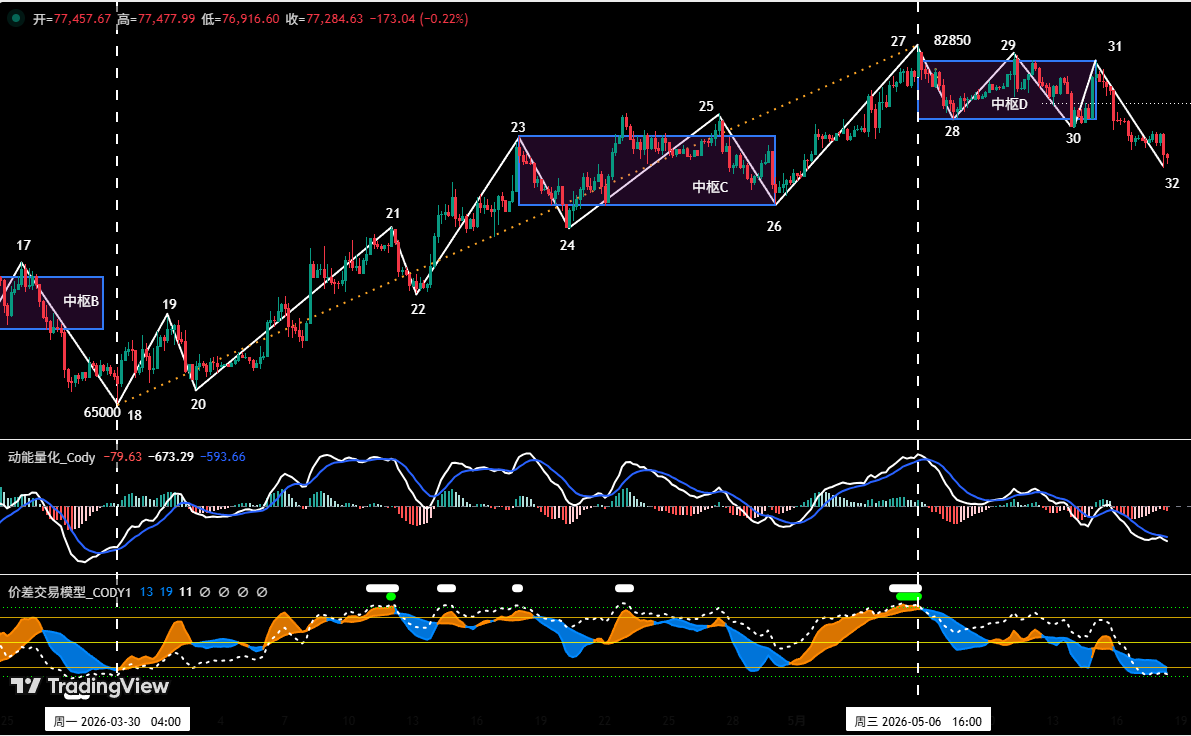
Figure 3
As shown in (Figure 3), from the exit segment (26-27) of "Zhongshu C" to the present:
• On the 4-hour chart, it can be subdivided into a 6-segment structure: 26-27, 27-28, 28-29, 29-30, 30-31, 31-32. Since segments 27-28, 28-29, 29-30, and 30-31 overlap with each other, they form Zhongshu D.
• Currently, the exit segment (31-32) is running downward and has broken below the support of the lower rail of "Zhongshu D" ($79,200) and the upper rail of "Zhongshu C" ($78,500). If the price subsequently confirms an effective break below the $78,500~$79,200 area, the daily-level correction structure might be initiated.
II. How to Operate Next
1. BTC Price Forecast for This Week:
Core View This Week: The key to the price action lies in observing the outcome of the battle between bulls and bears over the $78,500~$79,500 area. Gaining or losing this area can serve as an important basis for judging whether the price can maintain a high-level oscillation or turn downward.
2. Key Resistance Levels:
• First Resistance Area: $78,500~$79,500 (Near the upper and lower rails of the two Zhongshus)
• Second Resistance Area: $83,500~$84,500 (Previous dense trading zone for bullish and bearish positions)
3. Key Support Levels:
• First Support Level: $73,500~$75,000 area (Previous important support level)
• Second Support Level: $69,500~$70,500 area (Previous important support level)
4. Trading Strategy for This Week (Excluding unexpected news impact)
①. Mid-term Strategy:
Bitcoin _ Daily K-line Chart: (Position Monitoring Model)
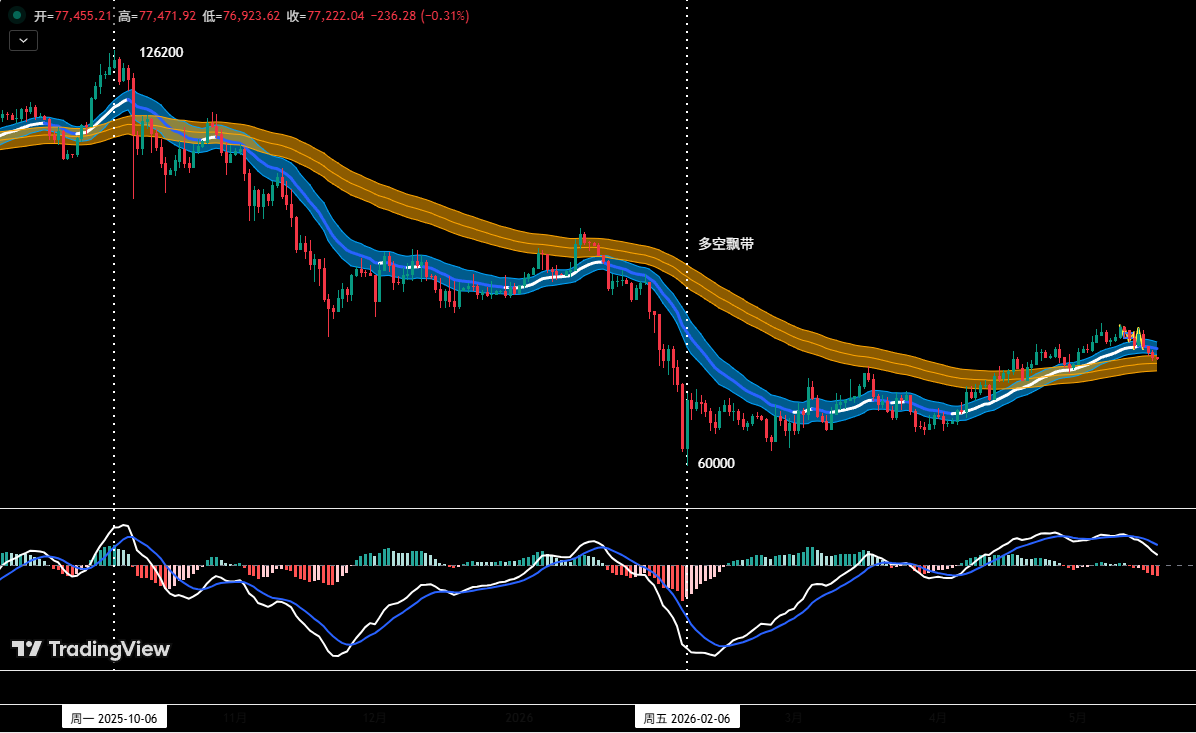
Figure 4
Position Monitoring Model: As shown in (Figure 4), based on trading rules, the mid-term market direction is not yet clear. This week, the mid-term strategy is to maintain an empty position and wait-and-see.
②. Short-term Strategy: Use 30% of position capital, set stop-loss points, and look for "spread" trading opportunities based on support and resistance levels. (Use 30-minute/60-minute as the operating timeframe).
③. In short-term operations, to dynamically respond to complex market developments, we have preemptively drafted two specific operation plans: Plan A/B.
• Plan A: Resistance on Rebound, Short on Rallies.
• Entry: When the price rebounds to the $78,500~$79,500 area and meets resistance, combined with top signals from the quantitative model, establish a short position below 30% of capital.
• Risk Control: Initial stop-loss set above $80,600.
• Exit: When the price declines to important support levels, combined with model signals, gradually close the position to take profits.
• Plan B: Effective Break of Support, Short the Breakout.
• Entry: When the price effectively breaks below the $73,500~$75,000 support area, combined with top signals from the model, establish a short position below 30% of capital.
• Risk Control: Initial stop-loss set above $76,500.
• Exit: When the price drops to important support levels, combined with model signals, gradually close the position to take profits.
III. After BTC, Let's Look at HYPE
While BTC is locked in a tug-of-war within the $78K-$82K range, with neither bulls nor bears gaining an advantage, HYPE has been independently hitting new highs, up over 10% this week.
HYPE _ Daily K-line Chart
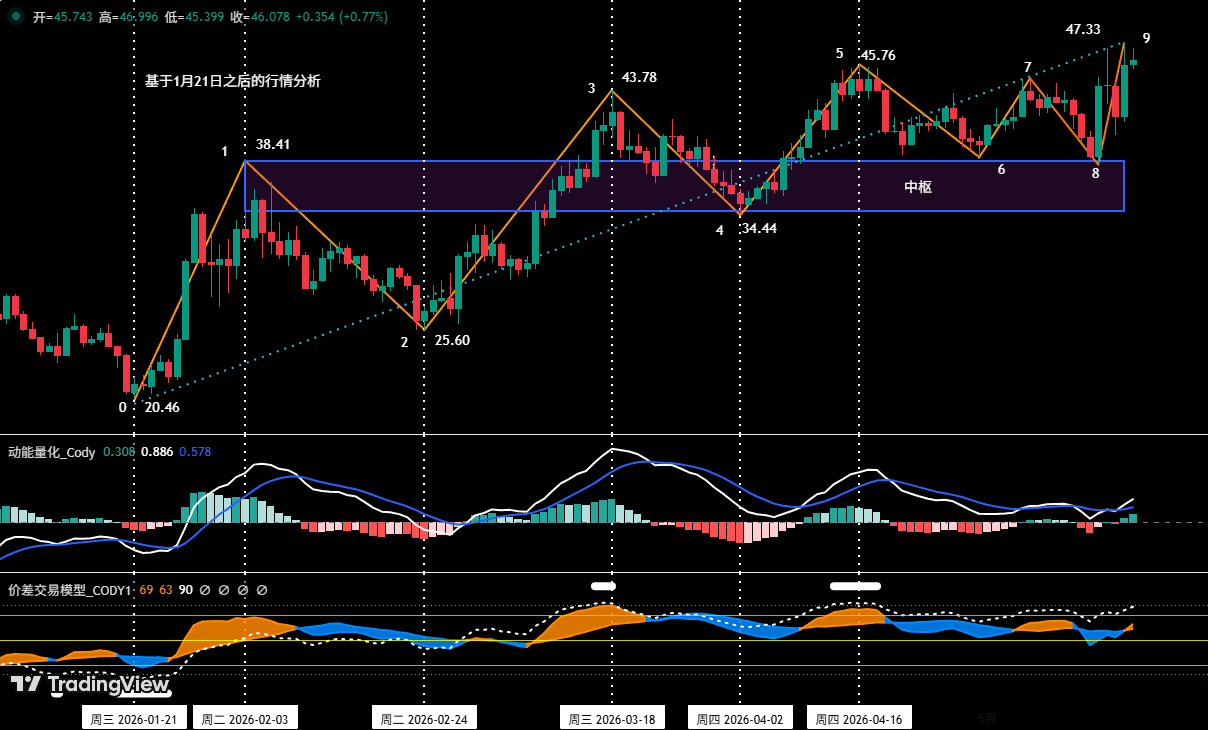
Figure 5
1. As shown in (Figure 5), the uptrend of HYPE since the January 21 low of $20.46 can be divided into a nine-segment structure on the daily chart: 0-1, 1-2, 2-3, 3-4, 4-5, 5-6, 6-7, 7-8, 8-9. Since the recent price made a new high of $47.30 (Endpoint 9) since the uptrend from $20.46, the current trend structure is still in a daily-level uptrend.
2. In (Figure 5), because segments 1-2, 2-3, and 3-4 overlap with each other, they collectively form a daily-level "uptrend Zhongshu".
3. If the HYPE price can consistently operate above the key point of $38.41 (upper rail of the Zhongshu), the market is expected to maintain a high-level consolidation pattern on the daily chart, digesting previous gains and accumulating directional momentum.
IV. HYPE Trend Judgment and Subsequent Operation Forecast
1. HYPE Price Forecast for This Week:
Core View on HYPE This Week: Focus on observing the outcome of the battle between bulls and bears around the Zhongshu upper rail ($38.41) and the previous high ($45.76).
2. HYPE Short-term Trading Strategy for This Week:
Based on the current market structure, we have optimized and formulated the following three short-term operation plans, centered around the game of "Zhongshu Upper Rail ($38.41) and Previous High ($45.76)".
• Plan A: Breakout and Go Long (Trend Continuation)
If the price effectively breaks through and holds above the $45.76 resistance, simultaneously triggering bottom signals from both models, consider a small long position. Position must be controlled under 30%, and strictly adhere to stop-loss discipline.
• Plan B: Breakdown and Shift to Short (Trend Reversal)
If the price effectively breaks below the $45.76 support, simultaneously triggering top signals from both models, consider a small short position. Position must be controlled under 30%, and strictly adhere to stop-loss discipline.
• Plan C: Support and Go Long (Trend Reversal)
If the price pulls back to near $38.41, stops falling, and shows stabilization signals, simultaneously triggering bottom signals from both models, consider a small long position. Position must be controlled under 30%, and strictly adhere to stop-loss discipline.
V. Finally, Let's Discuss the Results
1. Short-term Trade Review: (See Table 1)
We strictly followed the operation plan. Based on the trading signals from our proprietary spread trading model and momentum quantitative model, we executed one short-term trade (long) last week, achieving a profit of 2.02%.
①. Summary of Bitcoin Short-term Trade Details: (Leverage: 1x)
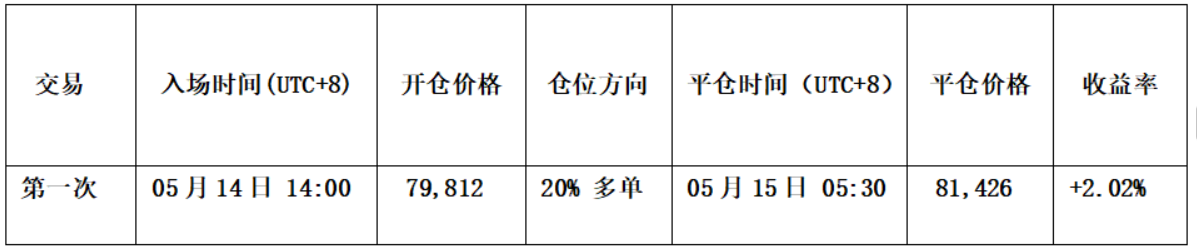
Table 1
②. Short-term Trade Review: (See Figure 6)
• Entry Strategy:


