
8,000 ดอลลาร์สหรัฐฯ สำหรับ Bitcoin: การฟื้นตัวชัดเจน แต่ยังขาดความเชื่อมั่นในตลาดกระทิง
- มุมมองหลัก: การที่ Bitcoin ดีดตัวกลับขึ้นไปเหนือ 80,000 ดอลลาร์สหรัฐฯ เป็นผลมาจากเงินทุนไหลเข้าของ ETF ความต้องการ spot ที่เพิ่มขึ้น และการปรับตัวของสถานะการถือครอง อย่างไรก็ตาม แรงของเงินทุนที่ไหลเข้ายังอ่อนแอ และแรงกดดันด้านอุปทานใกล้ระดับ 86,000 ดอลลาร์ บ่งชี้ว่าความเชื่อมั่นของตลาดยังไม่ฟื้นตัวสู่ระดับในช่วงตลาดกระทู้ก่อนหน้านี้ ปัจจุบันมีแนวโน้มไปในทิศทางของการฟื้นตัวเชิงโครงสร้างมากกว่าการพุ่งทะยานแบบก้าวกระโดด
- ปัจจัยสำคัญ:
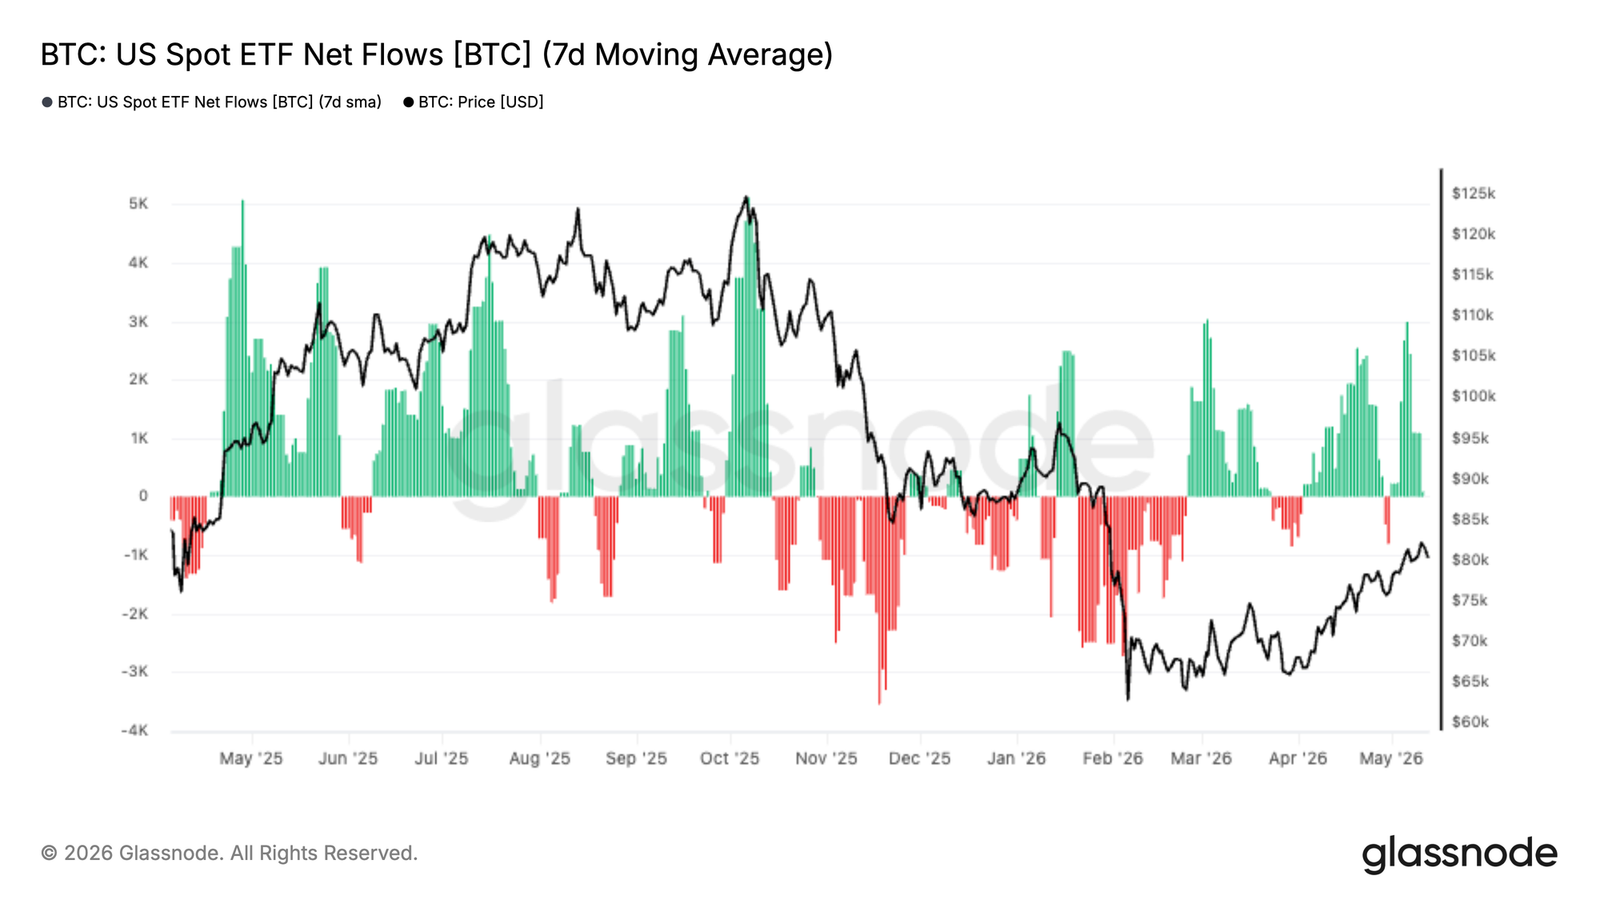
- กระแสเงินทุนไหลเข้าของกองทุน Bitcoin ETF แบบ spot ในสหรัฐฯ กลับมาเป็นบวกอย่างชัดเจน ส่งสัญญาณความต้องการจากสถาบันที่กลับมาอีกครั้ง แต่ขนาดยังคงต่ำกว่าระดับกว่า 1 หมื่นล้านดอลลาร์สหรัฐฯ ต่อเดือนในช่วงตลาดกระทู้ก่อนหน้านี้ แสดงให้เห็นว่าแรงของเงินทุนที่ไหลเข้ายังไม่เพียงพอ
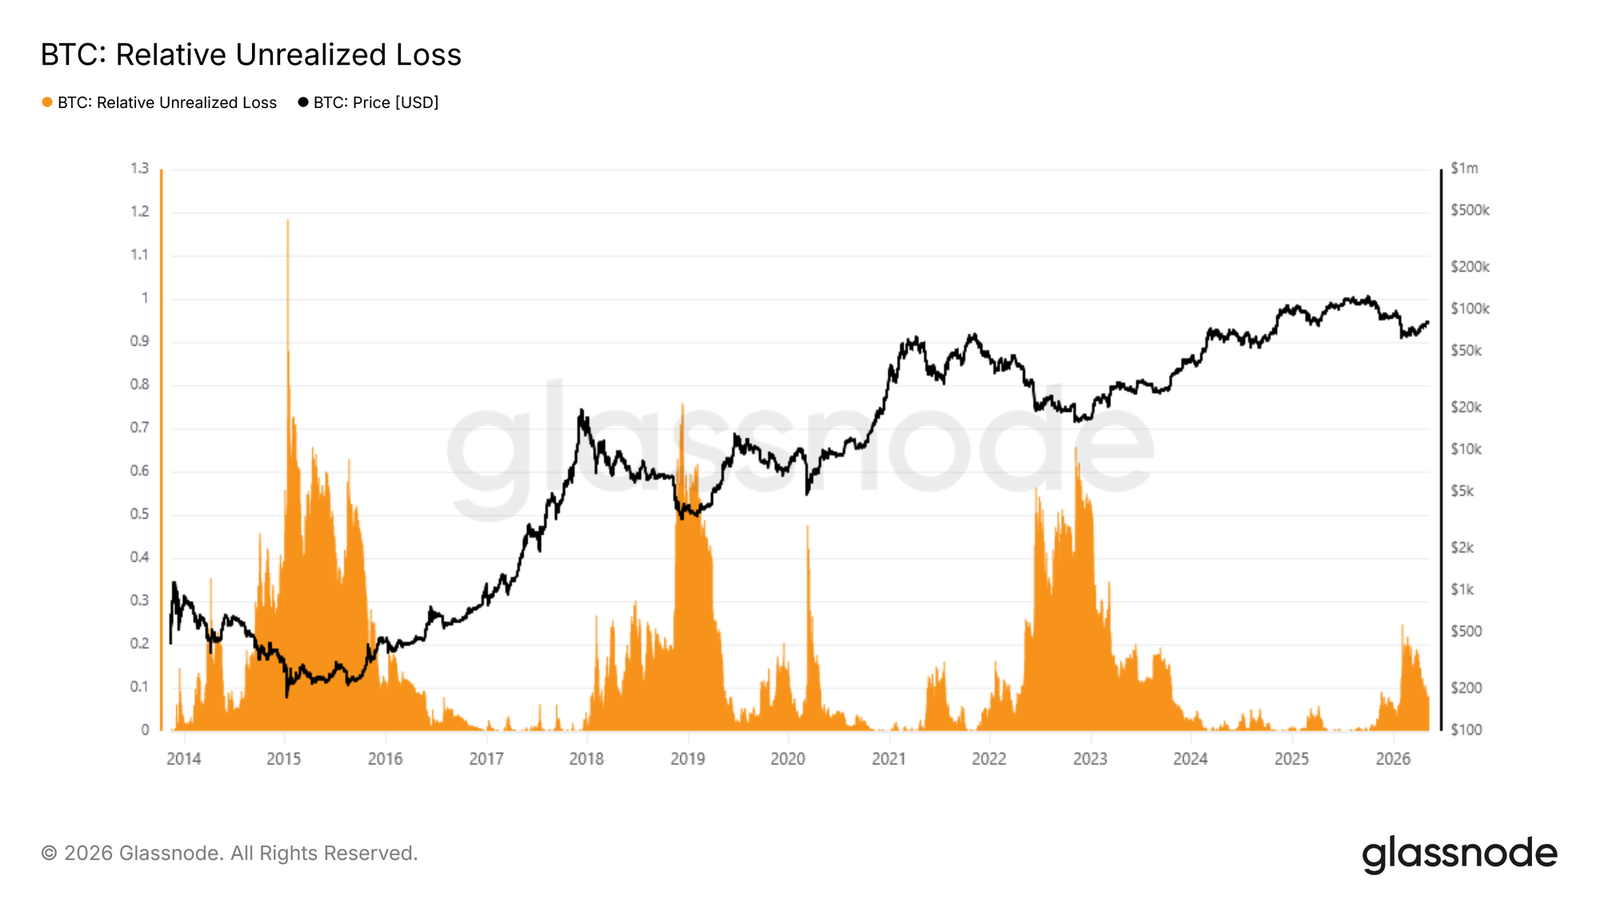
- การขาดทุนที่ยังไม่เกิดขึ้นจริงสัมพัทธ์ (Relative Unrealized Loss) พุ่งสูงถึง 25% ของมูลค่าตลาดในช่วงการเทขายเดือนกุมภาพันธ์ ก่อนจะลดลงเหลือ 8% หากราคา 60,000 ดอลลาร์ยังคงยืนหยัดได้ ก็จะสนับสนุนมุมมองที่ว่าภาวะตลาดหมีรอบนี้เป็นแบบตื้นเขิน
- ต้นทุนฐาน 30 วันที่ 76,900 ดอลลาร์เป็นแนวรับระยะสั้น ในขณะที่ระดับ 86,900 ดอลลาร์จากช่วงสะสมระหว่างเดือนพฤศจิกายนถึงกุมภาพันธ์เป็นแนวต้านสำคัญในระยะใกล้ สะท้อนถึงแรงกดดันด้านอุปทานที่หนักหน่วงเหนือระดับนี้
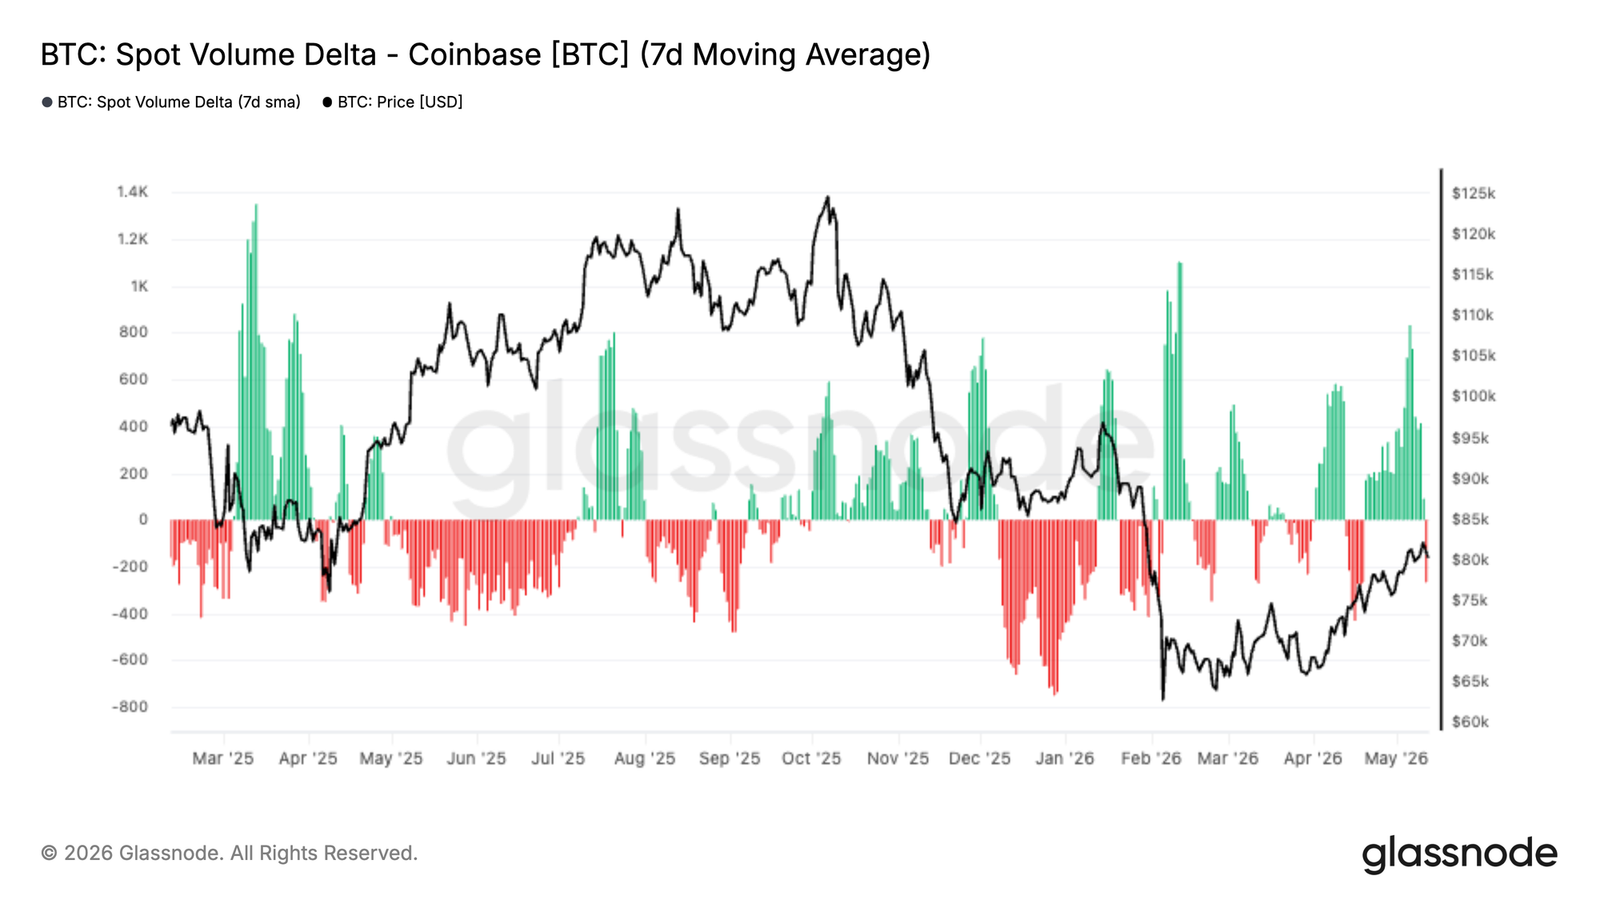
- ปริมาณการซื้อขายสะสมสุทธิ (Cumulative Volume Delta) ของ Coinbase spot ปรับตัวเพิ่มขึ้นอย่างแข็งแกร่งและสอดคล้องกับกระแสเงินทุนไหลเข้าของ ETF บ่งชี้ว่านักลงทุนสถาบันและในประเทศสหรัฐฯ กำลังกลับเข้ามามีส่วนร่วมอีกครั้ง ทำให้ความต้องการ spot เพิ่มขึ้น
- ความผันผวนโดยนัย (Implied Volatility) ยังคงถูกบีบอัดลง และความเอนเอียง (Skew) กลับเข้าสู่ภาวะปกติ บ่งชี้ว่าตลาดกำลังกำหนดราคาสำหรับช่วงเวลาระยะสั้นที่เงียบสงบขึ้น ความต้องการป้องกันความเสี่ยงด้านขาลงลดลง และโครงสร้างออปชั่นมีความสมดุลมากขึ้น
- สถานะของ Market Maker มีกลุ่ม Gamma ลบจำนวนมากใกล้ระดับ 82,000 ดอลลาร์ หากราคา spot เคลื่อนกลับเข้ามาในบริเวณนี้อีกครั้ง อาจขยายความผันผวนของราคาให้รุนแรงขึ้น เพิ่มความอ่อนไหวในระยะสั้น
Original Author: Glassnode
Original Translation: AididiaoJP, Foresight News
Bitcoin has returned above $80,000, with improvements in ETF inflows, spot demand, and positioning. However, weaker capital inflows and heavy overhead supply near $86,000 keep market conviction below levels seen in previous bull market phases.
Summary
- U.S. spot Bitcoin ETF inflows have turned decisively positive again, with institutional demand reigniting as Bitcoin recovered from the mid-$60,000s to the low $80,000s.
- Bitcoin's relative unrealized loss peaked at 25% of market cap during the February sell-off, subsequently compressing to 8% after reclaiming $80,000. This supports the view of a shallow bear market structure if the $60,000 level holds.
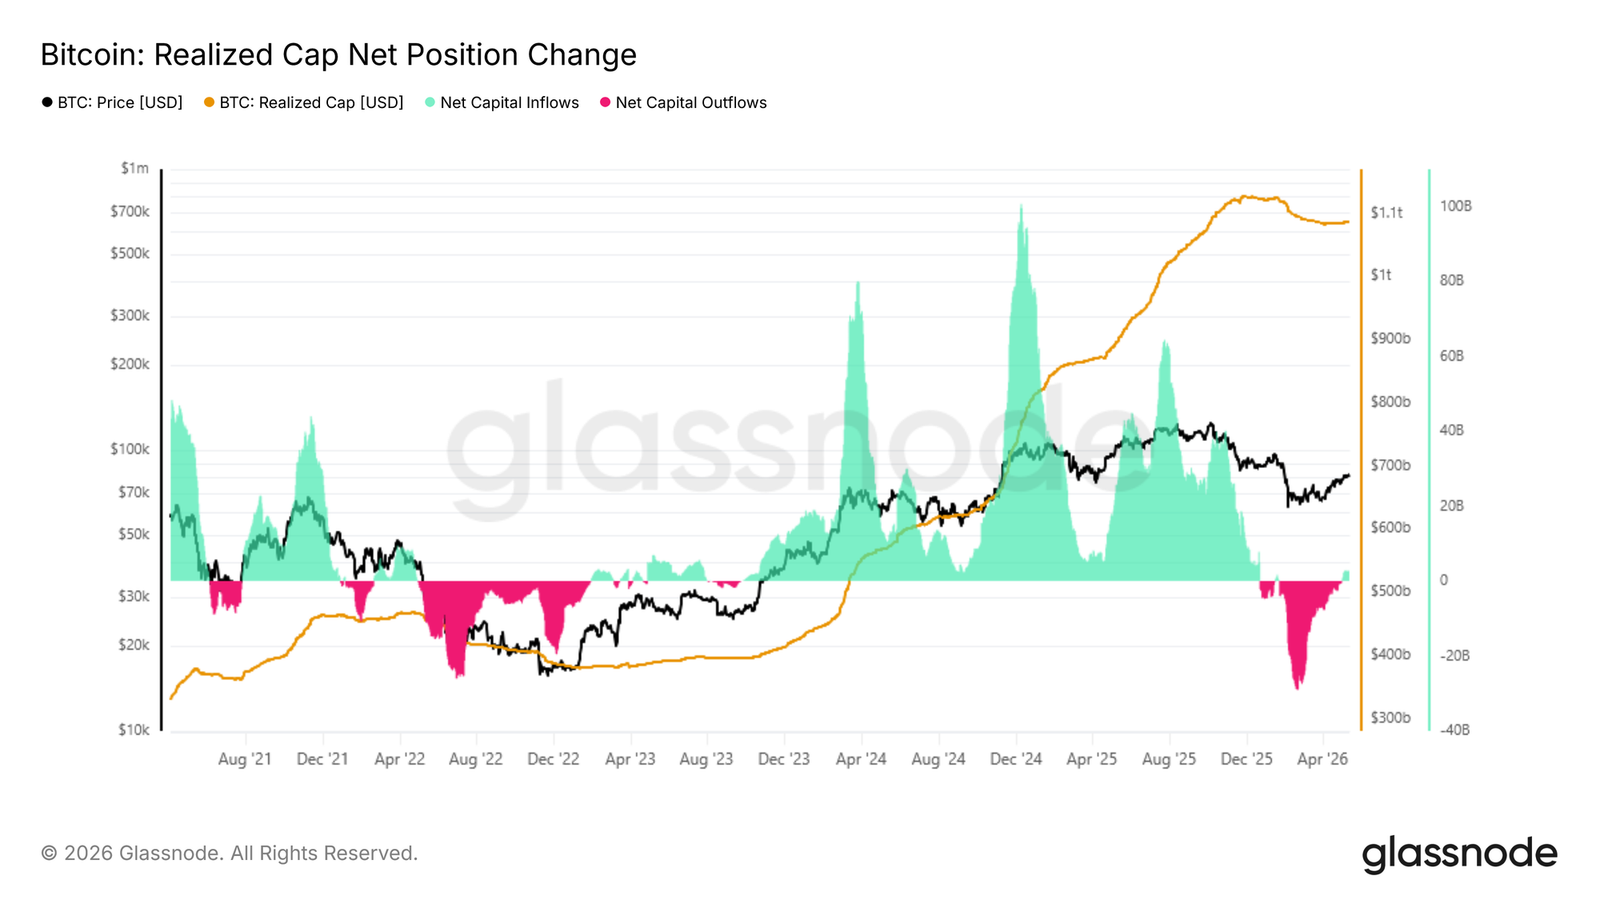
- The 30-day net position change in realized capitalization has rebounded to $2.8 billion per month, indicating improving capital inflows, though still far below the monthly inflows exceeding $10 billion seen during previous bull market expansions.
- The 30-day cost basis sits at $76,900, providing short-term immediate support, while the $86,900 level from the November to February accumulation zone remains a key near-term resistance for the recovery.
- The Coinbase spot volume delta has turned sharply positive over the past two weeks, indicating increasingly aggressive buying activity and strengthening spot market demand.
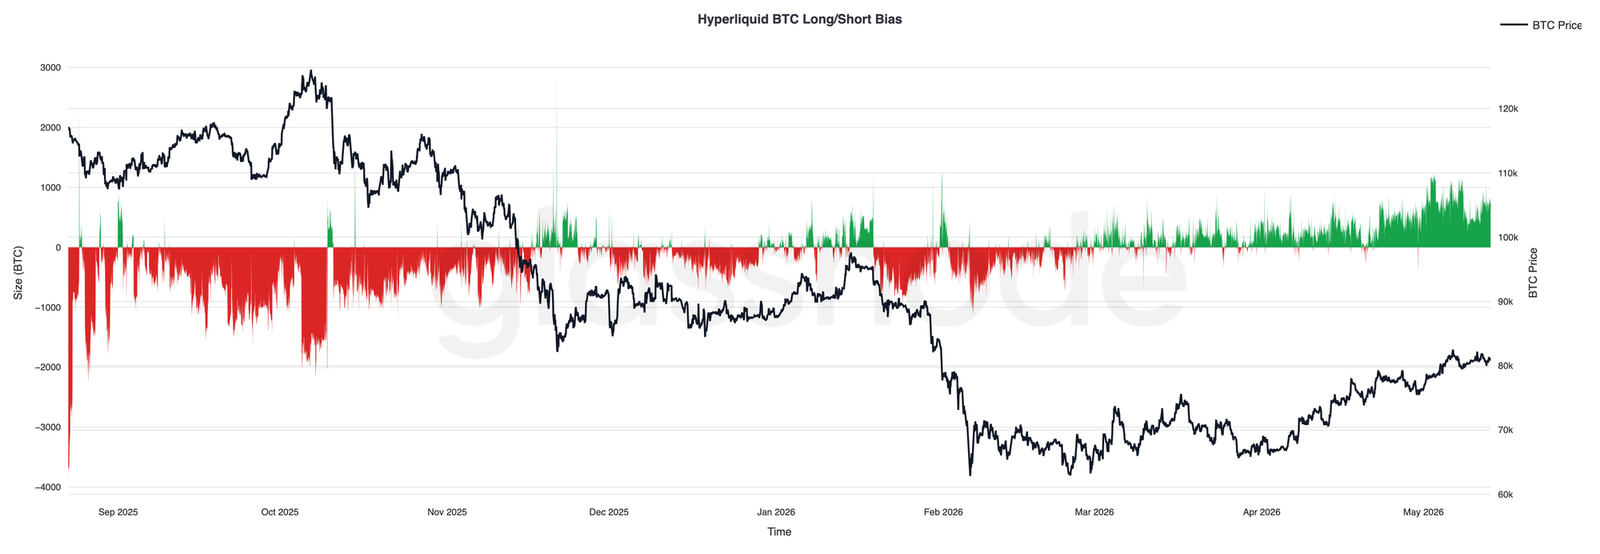
- Hyperliquid traders have steadily rebuilt long exposure as prices rose, reflecting improving speculative sentiment and growing confidence in further upside continuation.
- Implied volatility continues to compress across the term structure, led by the front end, while realized volatility trends downward, with the market pricing in a calmer short-term outlook.
- Skew compression suggests weakening demand for downside protection, with the options structure around $80,000 becoming more balanced.
- Market maker positioning remains a key driver of short-term dynamics. A large negative gamma cluster near $82,000 could still amplify price movements if spot re-enters that zone.
Macro Insights
The macro backdrop remains a tug-of-war between slowing economic growth and persistent inflation. Recent U.S. inflation data came in stronger than expected, while the labor market has proven more resilient than many anticipated. Consequently, the market has pushed back expectations for rate cuts, Treasury yields remain elevated, and financial conditions are relatively tight.
Liquidity continues to be a key driver for risk assets. Equities are slowly grinding higher, but beneath the surface, the environment remains fragile as the market adjusts to a higher-for-longer interest rate reality. Meanwhile, strength in oil and commodities continues to push inflation expectations higher, particularly against a backdrop of ongoing geopolitical tensions.
For digital assets, the picture remains constructive but selective. Bitcoin has shown resilience despite tightening liquidity conditions and a strong dollar, suggesting underlying demand remains intact. However, softer ETF inflows and high real yields imply that a more sustained upside move may require easier financial conditions or a new catalyst to rekindle broader risk appetite.
On-Chain Insights
From Fear to Uncertainty
Against a macro backdrop of sticky inflation, high Treasury yields, and tighter financial conditions, Bitcoin continues to demonstrate relative resilience, suggesting underlying demand remains intact even as the broader risk environment stays unsettled. To assess the current cycle's position structurally, the Relative Unrealized Loss (a measure of the total dollar value of unrealized losses held by all investors relative to market cap) provides a precise cyclical barometer. During the February flash crash, this metric peaked at 25% of market cap – a reading indicating significant stress, but still far below the extreme levels recorded in previous bear market cycles. Following the subsequent reclaim of $80,000, the metric has compressed to around 8%, shifting mainstream sentiment from fear to uncertainty rather than outright collapse.
If $60,000 proves to be the cycle low, this bear market would be the shallowest on record – registering fear, but falling far short of the widespread washouts that historically mark durable cycle bottoms.
Magnitude of Capital Inflows
As sentiment shifts from fear to uncertainty, the key question is whether the current rally is a typical bear market bounce or an early stage of a genuine bull market transition. The most direct measure is net capital inflows, tracked by the 30-day net position change in realized capitalization, which monitors the monthly change in total capital stored on-chain. Following the recent rally to $82,000, this metric has reached $2.8 billion per month, a positive reading explaining the constructive momentum of recent weeks.
However, context is crucial: during the early stages of each major upswing in the 2023-2025 bull market, this metric rapidly accelerated from roughly $2 billion per month to over $10 billion. While encouraging, the current reading remains far below that threshold, indicating that the capital inflows supporting this recovery lack the conviction seen at similar inflection points in the previous cycle.
Support and Resistance Through the Lens of Cost Basis
Despite a 37% rally from $60,000 to $82,000, capital inflows remain modest and uncertainty persists. The realized price indicators stratified by holding period provide a granular framework for identifying the most immediate support and resistance levels. This model tracks the average acquisition price of coins by holding period, mapping the behavioral anchors of different investor groups onto the price chart.
The current rally's momentum is primarily driven by the accumulation wave of the past 30 days. The cost basis for this cohort sits around $76,900, forming the most immediate short-term support floor. Above this, investors who accumulated during the consolidation range between November and February have a cost basis concentrated near $86,900. As these holders approach breakeven and face increasing distribution incentives, this represents the most likely near-term resistance zone.
Off-Chain Insights
Reconstruction of ETF Demand
U.S. spot Bitcoin ETF inflows have turned decisively positive in recent weeks, with sustained inflows returning as Bitcoin reclaimed the $80,000 level. After months of uneven demand and significant outflows in the first quarter, this latest shift indicates that institutional demand is beginning to re-emerge in a more meaningful way.
Importantly, this resurgence in ETF demand has maintained continuity rather than being driven by a single allocation surge, suggesting institutions are steadily accumulating as market conditions improve. Inflow intensity has also accelerated alongside the price increase, reinforcing the view that traditional capital is once again supporting momentum rather than exiting during rallies.
The current structure shows significant market structure improvement relative to earlier this year. ETF inflows now act as a tailwind rather than a source of sustained selling pressure, removing one of the key headwinds that previously constrained recovery attempts. If sustained, continued institutional accumulation could provide the demand base necessary for Bitcoin to challenge higher overhead supply zones in the coming weeks.
Coinbase Spot Buying Accelerates Again
The Coinbase spot volume delta has turned sharply positive over the past two weeks, with aggressive buying activity returning as Bitcoin reclaimed the low $80,000s. This latest shift stands in stark contrast to the persistent selling pressure that characterized most of the first quarter, when negative volume consistently reinforced downward momentum.
Importantly, the recent move higher is accompanied by repeated increases in positive spot buying volume, rather than isolated buying surges, suggesting that sustained demand is beginning to absorb overhead supply. The strengthening activity on Coinbase is also highly correlated with the recovery in ETF inflows, indicating that U.S.-based and institutional buyers are re-engaging.
The current structure suggests that spot demand is once again becoming a supportive force for price rather than a source of distribution. Continued strength in Coinbase buying flow, particularly its synchronized rise with ETF inflows, indicates improving market conviction and healthier underlying demand conditions for the latest rally.
Hyperliquid Traders Increasingly Bullish
Over the past few weeks, positioning on Hyperliquid has become increasingly skewed towards longs, with BTC net positioning steadily rising as Bitcoin recovered to the low $80,000s. This shift marks a significant reversal from the persistent bearish bias that characterized most of the first quarter, when the market was retracing to the low $60,000s.
Importantly, the recent increase in long exposure has been a gradual development rather than a surge via a single crowded position, indicating that traders are steadily rebuilding directional bullish exposure as market conditions improve. Net positioning is now approaching its strongest bullish bias since late 2025, reflecting growing confidence in upside continuation.
The persistent long positioning alongside rising price action suggests improving trader sentiment and a more constructive speculative backdrop, although increasingly crowded long exposure could make the market more sensitive to short-term volatility and liquidation-driven pullbacks.
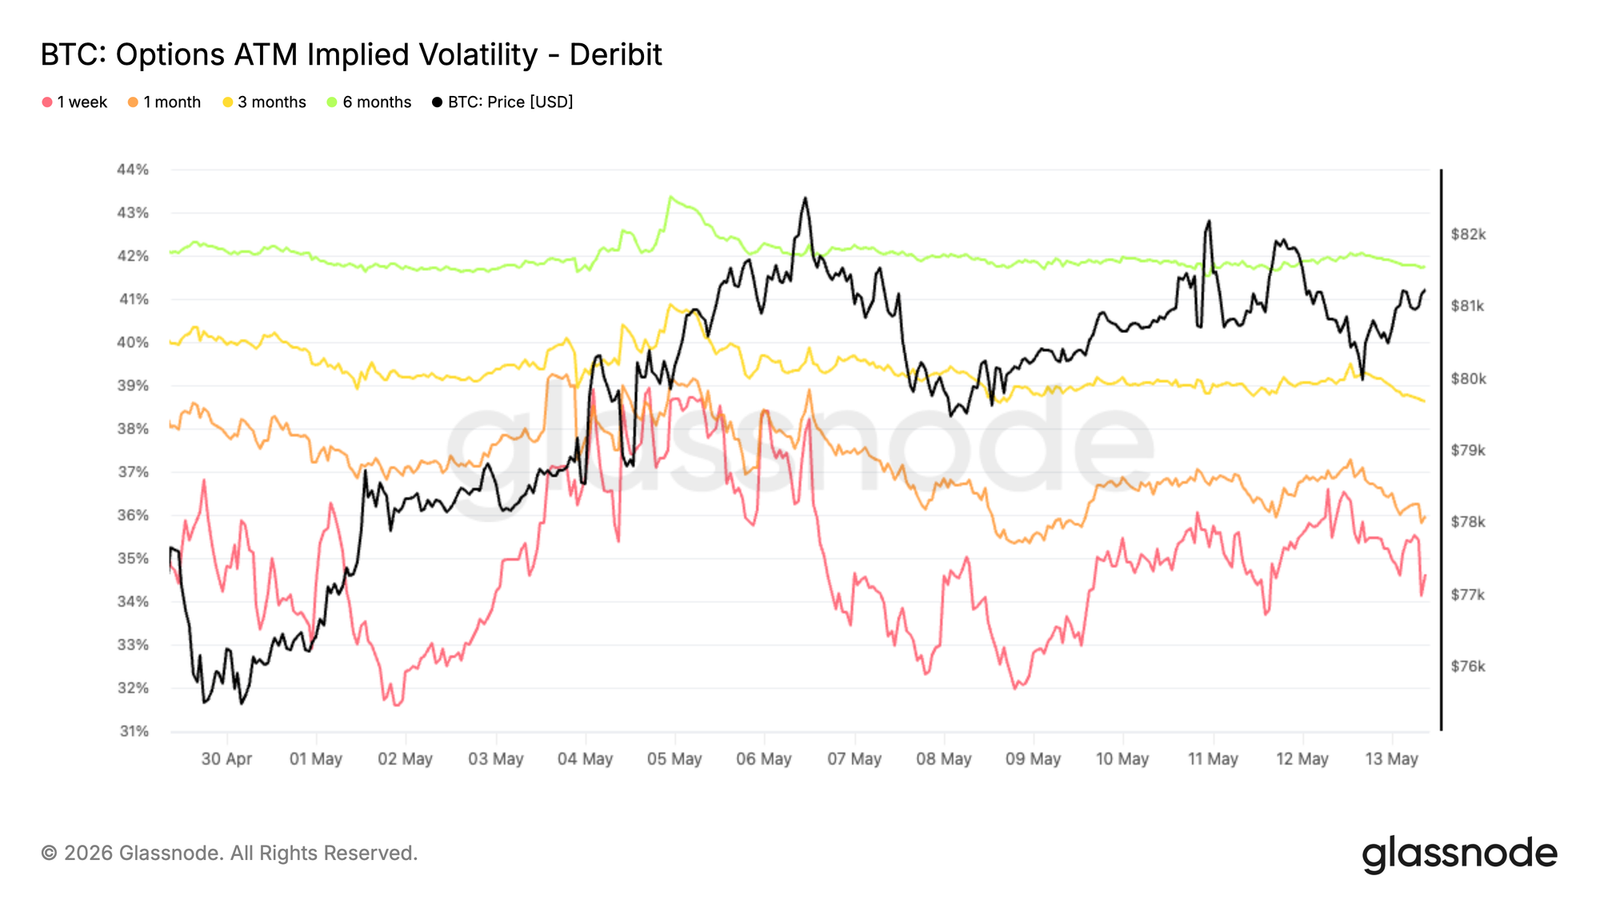
Implied Volatility Declines
Over the past week, Bitcoin implied volatility has turned lower, with the front month declining from 39% to 34.6%. Longer tenors have moved lower in tandem, with the entire curve falling by approximately 1 to 2 volatility points.
This move reflects a broader repricing lower across the term structure as traders reduce expectations for short-term realized volatility. The decline follows a recent volatility spike and coincides with more controlled spot action, reinforcing the view that the market is returning to a calmer regime.
As implied volatility compresses, the cost of options across tenors decreases, particularly at the front end which is most sensitive to short-term positioning and demand shifts.
The current structure reflects the market pricing in less expectation of significant directional moves ahead, with volatility supply continuing to outpace demand across the curve.
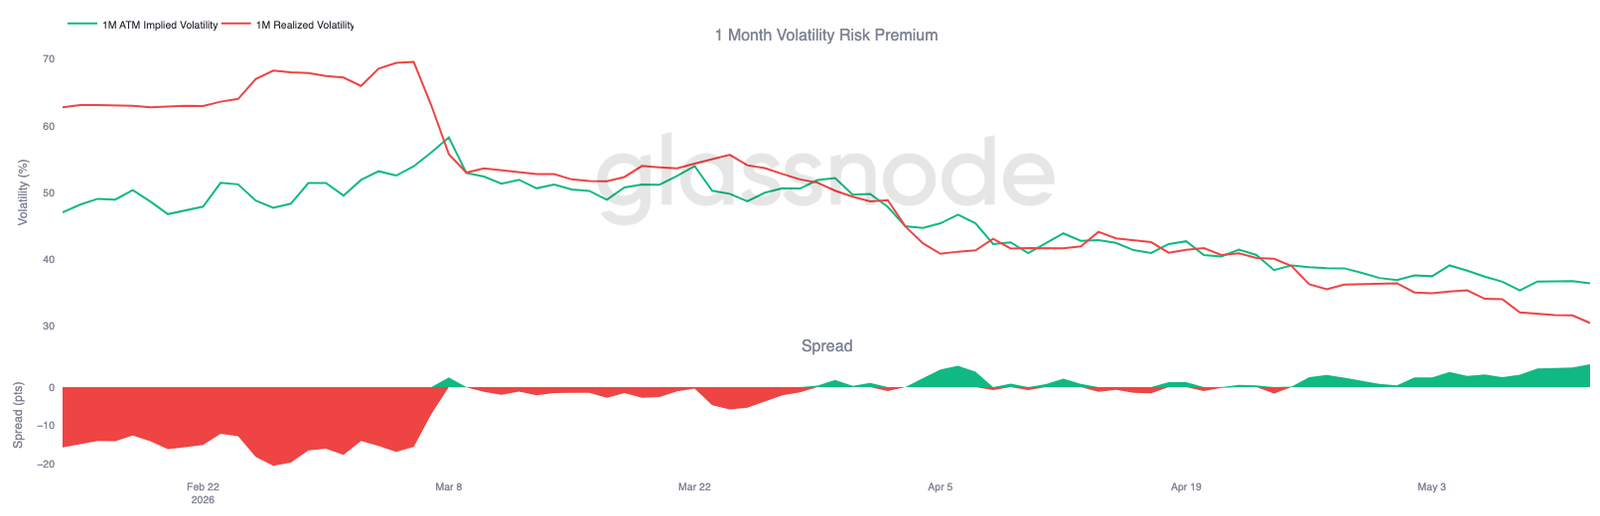
Volatility Risk Premium Remains Positive
While implied volatility continues to compress across the term structure, realized volatility is declining even faster. Bitcoin's 30-day realized volatility currently stands at 30.48%, steadily declining over the past few weeks as spot action remains relatively contained.
Meanwhile, front-month implied volatility still sits around 36.4%, meaning implied remains above realized, maintaining a positive volatility risk premium. In other words, options continue to price in more volatility ahead than Bitcoin's recent spot action has delivered.
The spread between implied and realized volatility has also been rebuilding over the past two to three weeks, recovering from a brief compression to zero in April to around 6 volatility points. This suggests that despite the overall downward reset in volatility, options demand relative to realized volatility remains elevated.
Therefore, while overall volatility continues to soften on both the implied and realized dimensions, the hedging environment still favors volatility sellers.
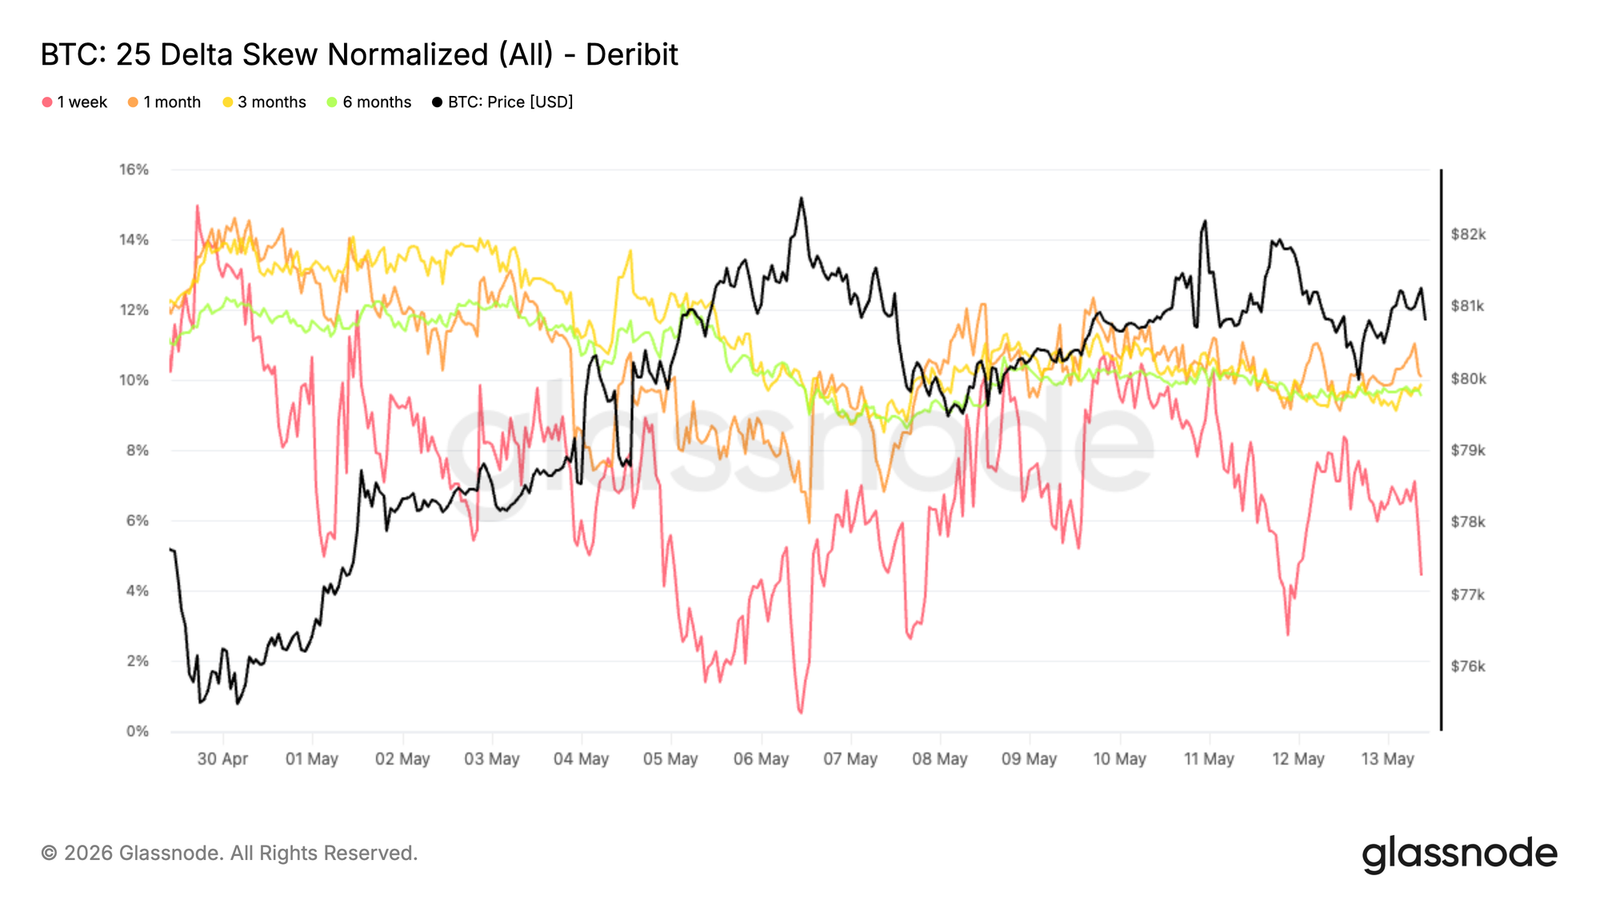
Skew Compression Indicates Weakening Demand for Downside Hedging
As volatility expectations continue to reset lower, skew is also normalizing across the term structure. This move is most pronounced at the front end, with the 1-week 25-delta skew compressing from around -10% to -4% over the past week. Longer tenors have softened in tandem, with 1-month, 3-month, and 6-month tenors all losing about 1 to 2 points of put premium.
Notably, this compression is occurring against a backdrop where Bitcoin is consolidating around the $80,000 range and macro support is relatively weak. The options surface is not showing increased demand for downside protection, but rather continuing to reprice towards a more balanced structure.
This upward move reflects a steady reduction in the premium for put options relative to calls, indicating that demand for downside protection across the curve is gradually waning rather than strengthening.
While skew remains in negative territory across tenors, the persistent compression suggests that demand for downside hedging is gradually easing rather than intensifying.
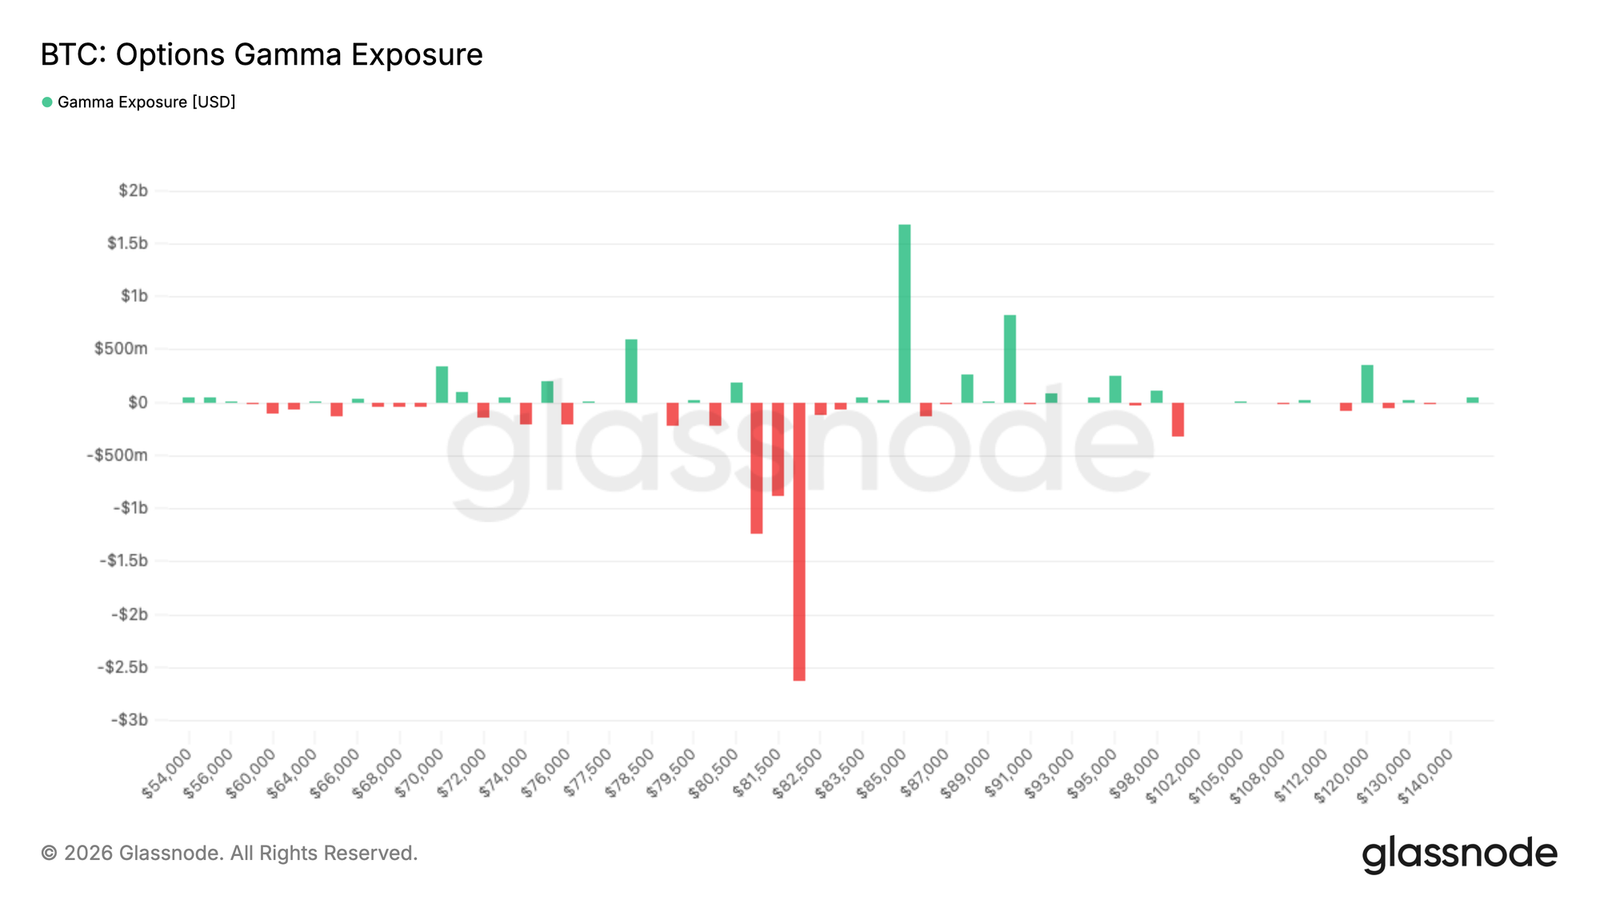
Market Maker Gamma Keeps Spot Sensitive Near $82,000
Market maker positioning continues to create reactive structures around the current price level. The largest concentration of negative gamma is at the $82,000 strike, with exposure of approximately $2.6 billion, while positive gamma builds near $85,000, approaching $1.8 billion.
With spot trading below the $82,000 negative gamma cluster, a re-entry into this zone could trigger reactive market maker hedging flows, amplifying momentum and magnifying price action. Higher up, the positive gamma concentration near $85,000 could dampen volatility.
Flows also reflect a shift in positioning. Over the past 7 days, put buying accounted for 71% of premium flow, reflecting high demand for downside protection during the recent consolidation. Notably, 58% of flow in the last 24 hours came from put selling, suggesting some of that hedging is being unwound.
This structure makes the market increasingly sensitive to amplified hedging flows if spot re-enters the large negative gamma cluster near $82,000.
Conclusion
In summary, Bitcoin's recovery continues to strengthen beneath the surface. Spot-led demand, reignited ETF inflows, and improving speculative positioning are contributing to a more constructive market structure. The sharp compression in relative unrealized loss, coupled with stabilization in key on-chain profitability and liquidity metrics, increasingly suggests that the February decline was a cyclical reset rather than the start of a deeper bear market.
At the same time, this rally is distinctly different from the aggressive expansions seen during the 2023-2025 period. Capital inflows are recovering, but remain far below previous breakout thresholds, while volatility compression and calmer derivatives positioning point to a market gradually rebuilding confidence rather than entering a euphoric phase. This makes the current uptrend appear more like a structurally supported recovery than a fully confirmed momentum breakout.
With Bitcoin now re-entering the dense overhead supply territory between $82,000 and $87,000, the market is moving into a zone where price discovery becomes increasingly important. Sustained consolidation above this range will likely require stronger spot participation and deeper capital rotation to absorb the remaining overhead supply. Until then, the broader structure continues to improve, but conviction appears to be rebuilding rather than fully restored.


