
UAE's Exit from OPEC: What Are the Implications?
- Core Viewpoint: The market's real reaction to the UAE exiting OPEC was not a price jump in oil, but rather a deep backwardation in the futures curve indicating: near-term panic stems from geopolitical noise combined with headline risk, while far-month futures prices barely moved, suggesting the market sees this move as neutral for medium-term oil prices, albeit weakening OPEC's ability to act as a price stability anchor.
- Key Factors:
- The UAE's exit is mainly due to its production capacity (4.85 mb/d) being persistently constrained by its OPEC+ quota (3.22 mb/d) by roughly 30%, resulting in massive daily revenue losses, and ADNOC plans to increase capacity to 5.0 mb/d by 2027.
- On April 28, Brent crude's June futures jumped to $109.34, but July futures only rose to $102.77, resulting in a spread of $6.57; far-month futures remained nearly unchanged throughout April.
- During the Hormuz crisis earlier in April, Brent spot prices were once $35 more expensive than far-month futures (a panic premium). Following the UAE's exit, the spread was only around $6.57, indicating a much smaller market panic reaction compared to that geopolitical crisis.
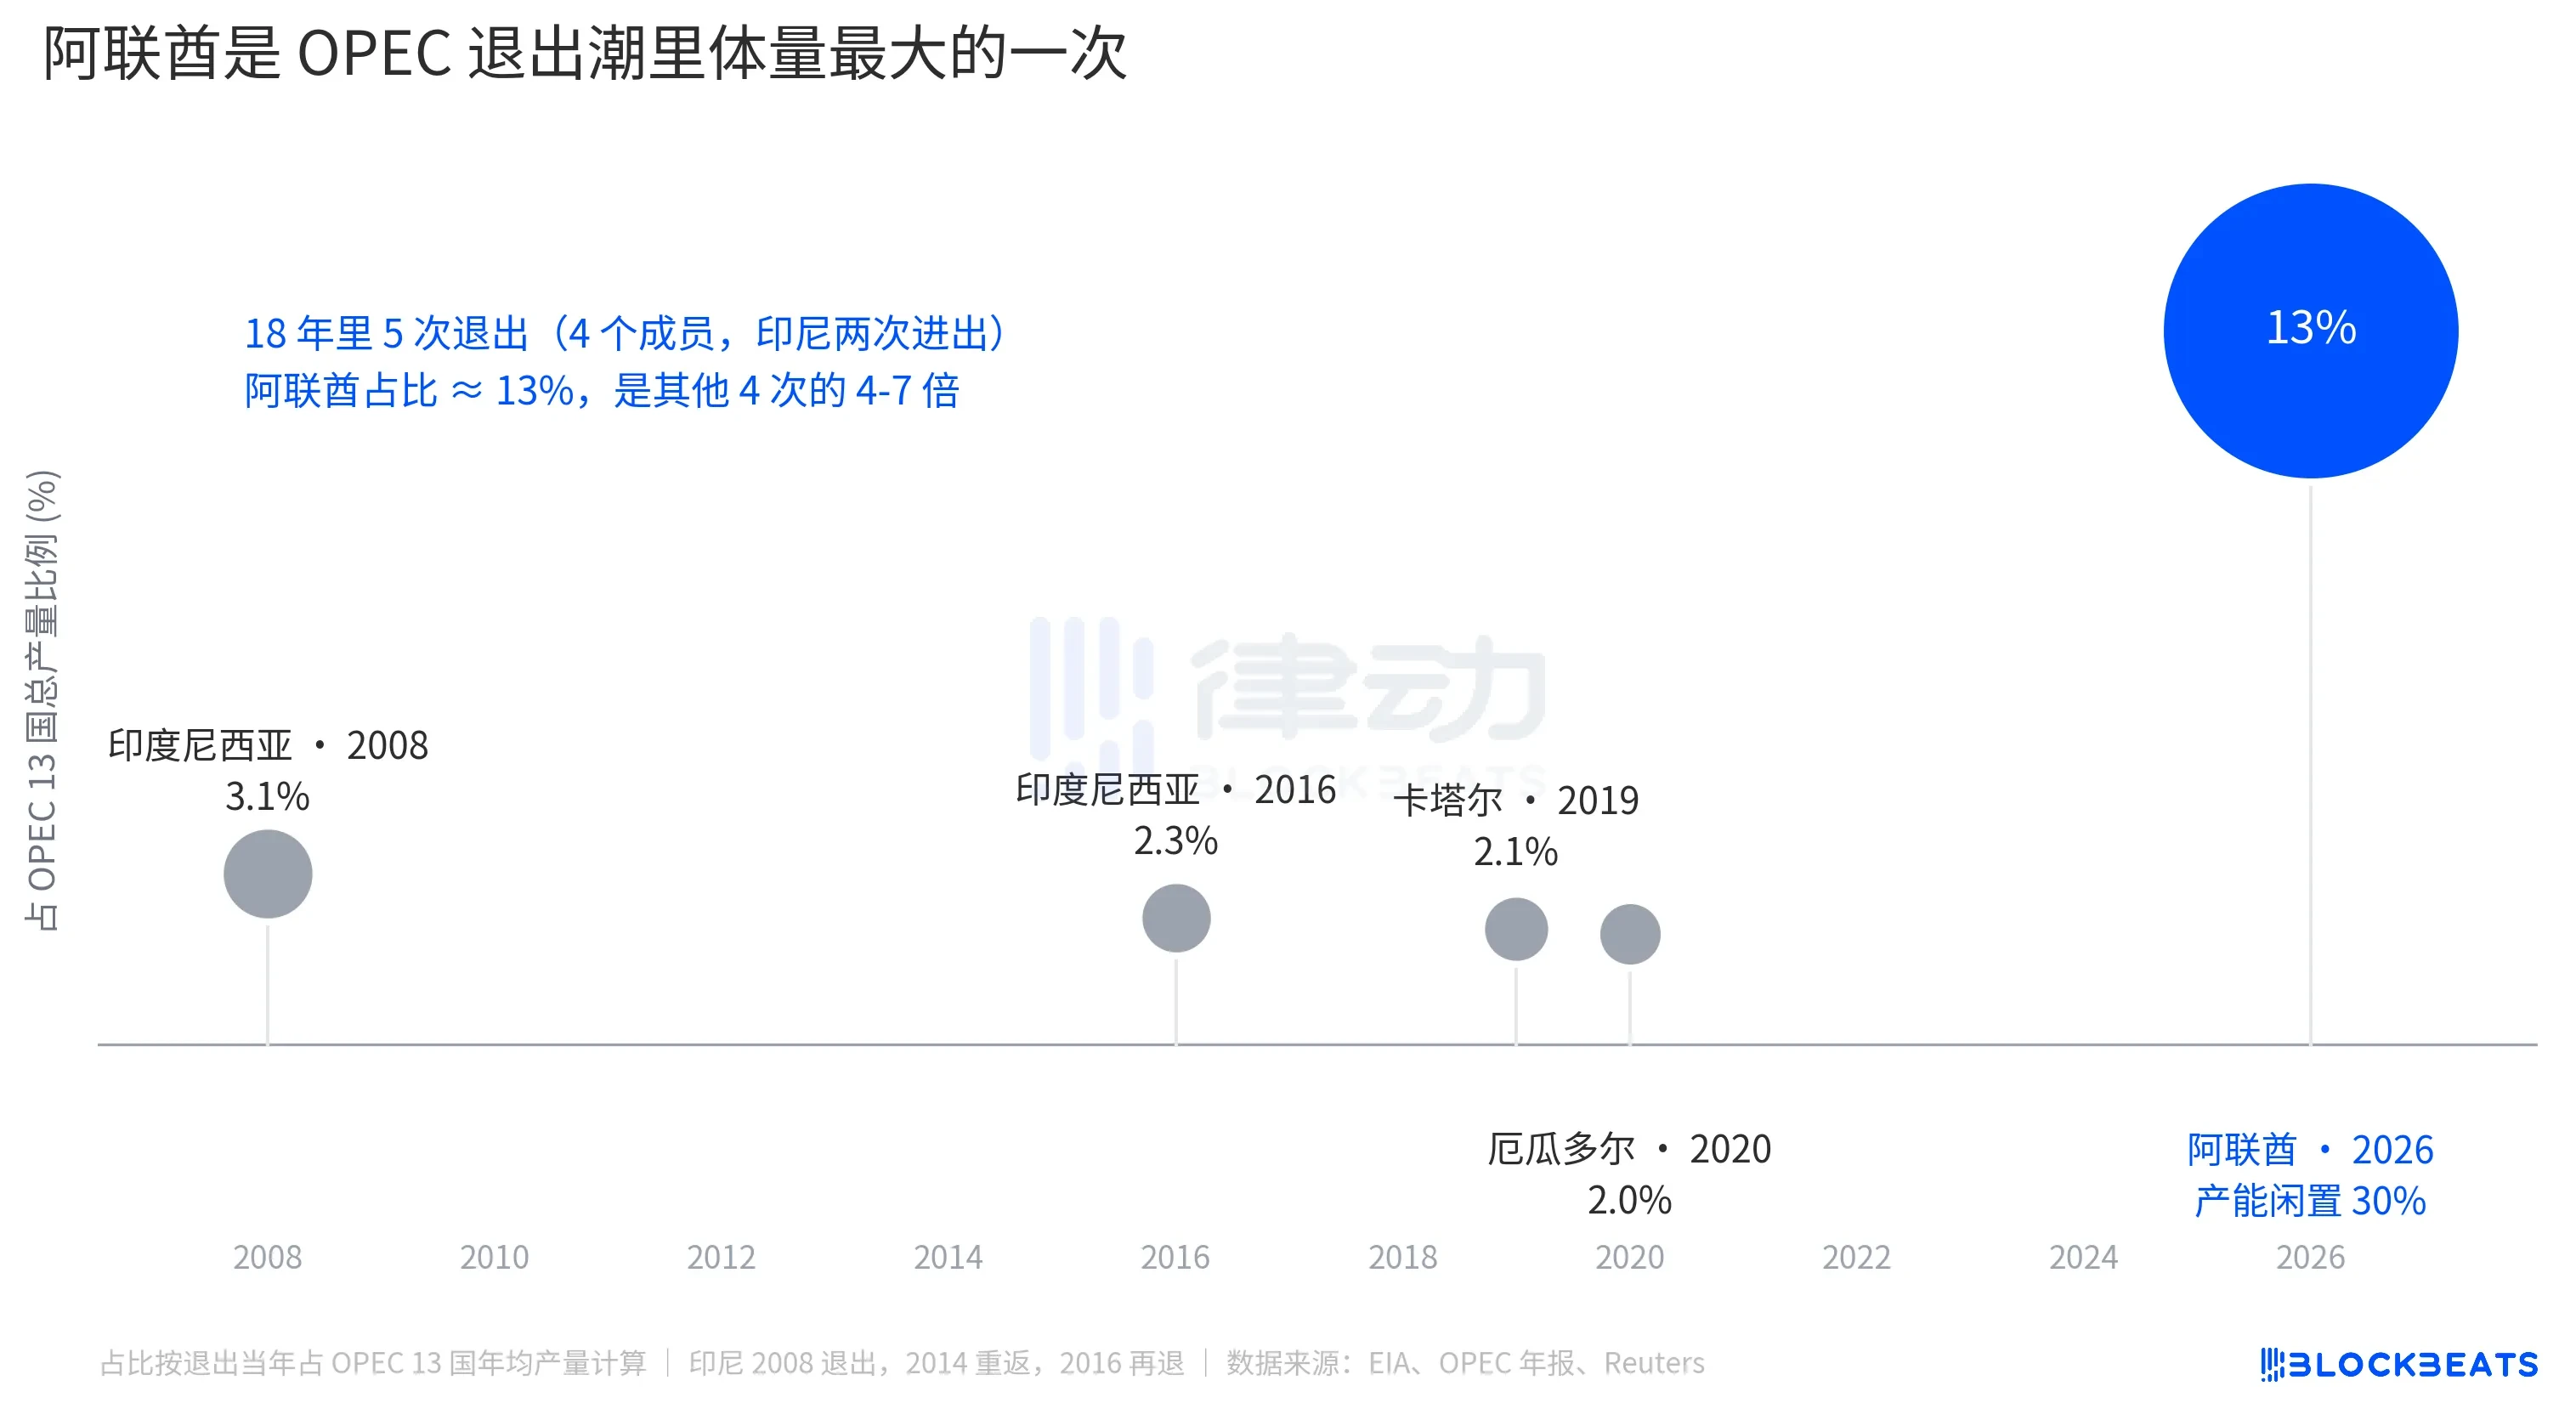
- The UAE accounts for about 13% of total OPEC production, which is over 1.5 times the cumulative output of all countries that left OPEC in the past 18 years. However, Saudi Arabia still has about 25% spare capacity to act as a hedge.
- After the UAE's exit, the spare capacity among the remaining 13 OPEC members will shrink to approximately 1 mb/d, covering only about 1% of global demand. This raises concerns that OPEC's ability to influence prices has been further weakened.
On April 28, the UAE announced its withdrawal from OPEC and OPEC+, effective May 1, ending nearly 60 years of membership. On the same day, the June Brent futures contract jumped $1.11 to $109.34 per barrel. This is the story being told in financial media. However, the July Brent futures contract rose only $1.08 to $102.77, $6.57 cheaper than the June contract. Placed side by side, these two numbers tell a different story.
As OPEC's third-largest oil producer, behind Saudi Arabia and Iraq, the UAE has always held an awkward position within the organization. Its capacity expansion has consistently outpaced quota adjustments. In 2023, frustrated with quotas it deemed too low, the UAE delayed the entire OPEC+ production agreement for months. This time, its outright departure is being interpreted by media as the greatest challenge yet to Saudi leadership.
Following the UAE's announcement, market pricing for oil diverged into two tracks: spot prices surged, while far-month futures remained largely unchanged. The gap between these two pricing mechanisms represents the market's true verdict on the UAE's withdrawal.
Actual Capacity is 1.5 Times the OPEC Quota
According to EIA data, the UAE's current actual production capacity is 4.85 mb/d (million barrels per day), but its OPEC+ quota for 2025 has been constrained to around 3.22 mb/d. The difference of 1.63 mb/d means roughly 30% of its capacity is artificially idled.
The same disparity stands at about 25% for Saudi Arabia (12 mb/d actual capacity vs. 9 mb/d quota), and only 10-15% for Iraq and Kuwait. Among the 13 OPEC members, the UAE is the most severely restrained.
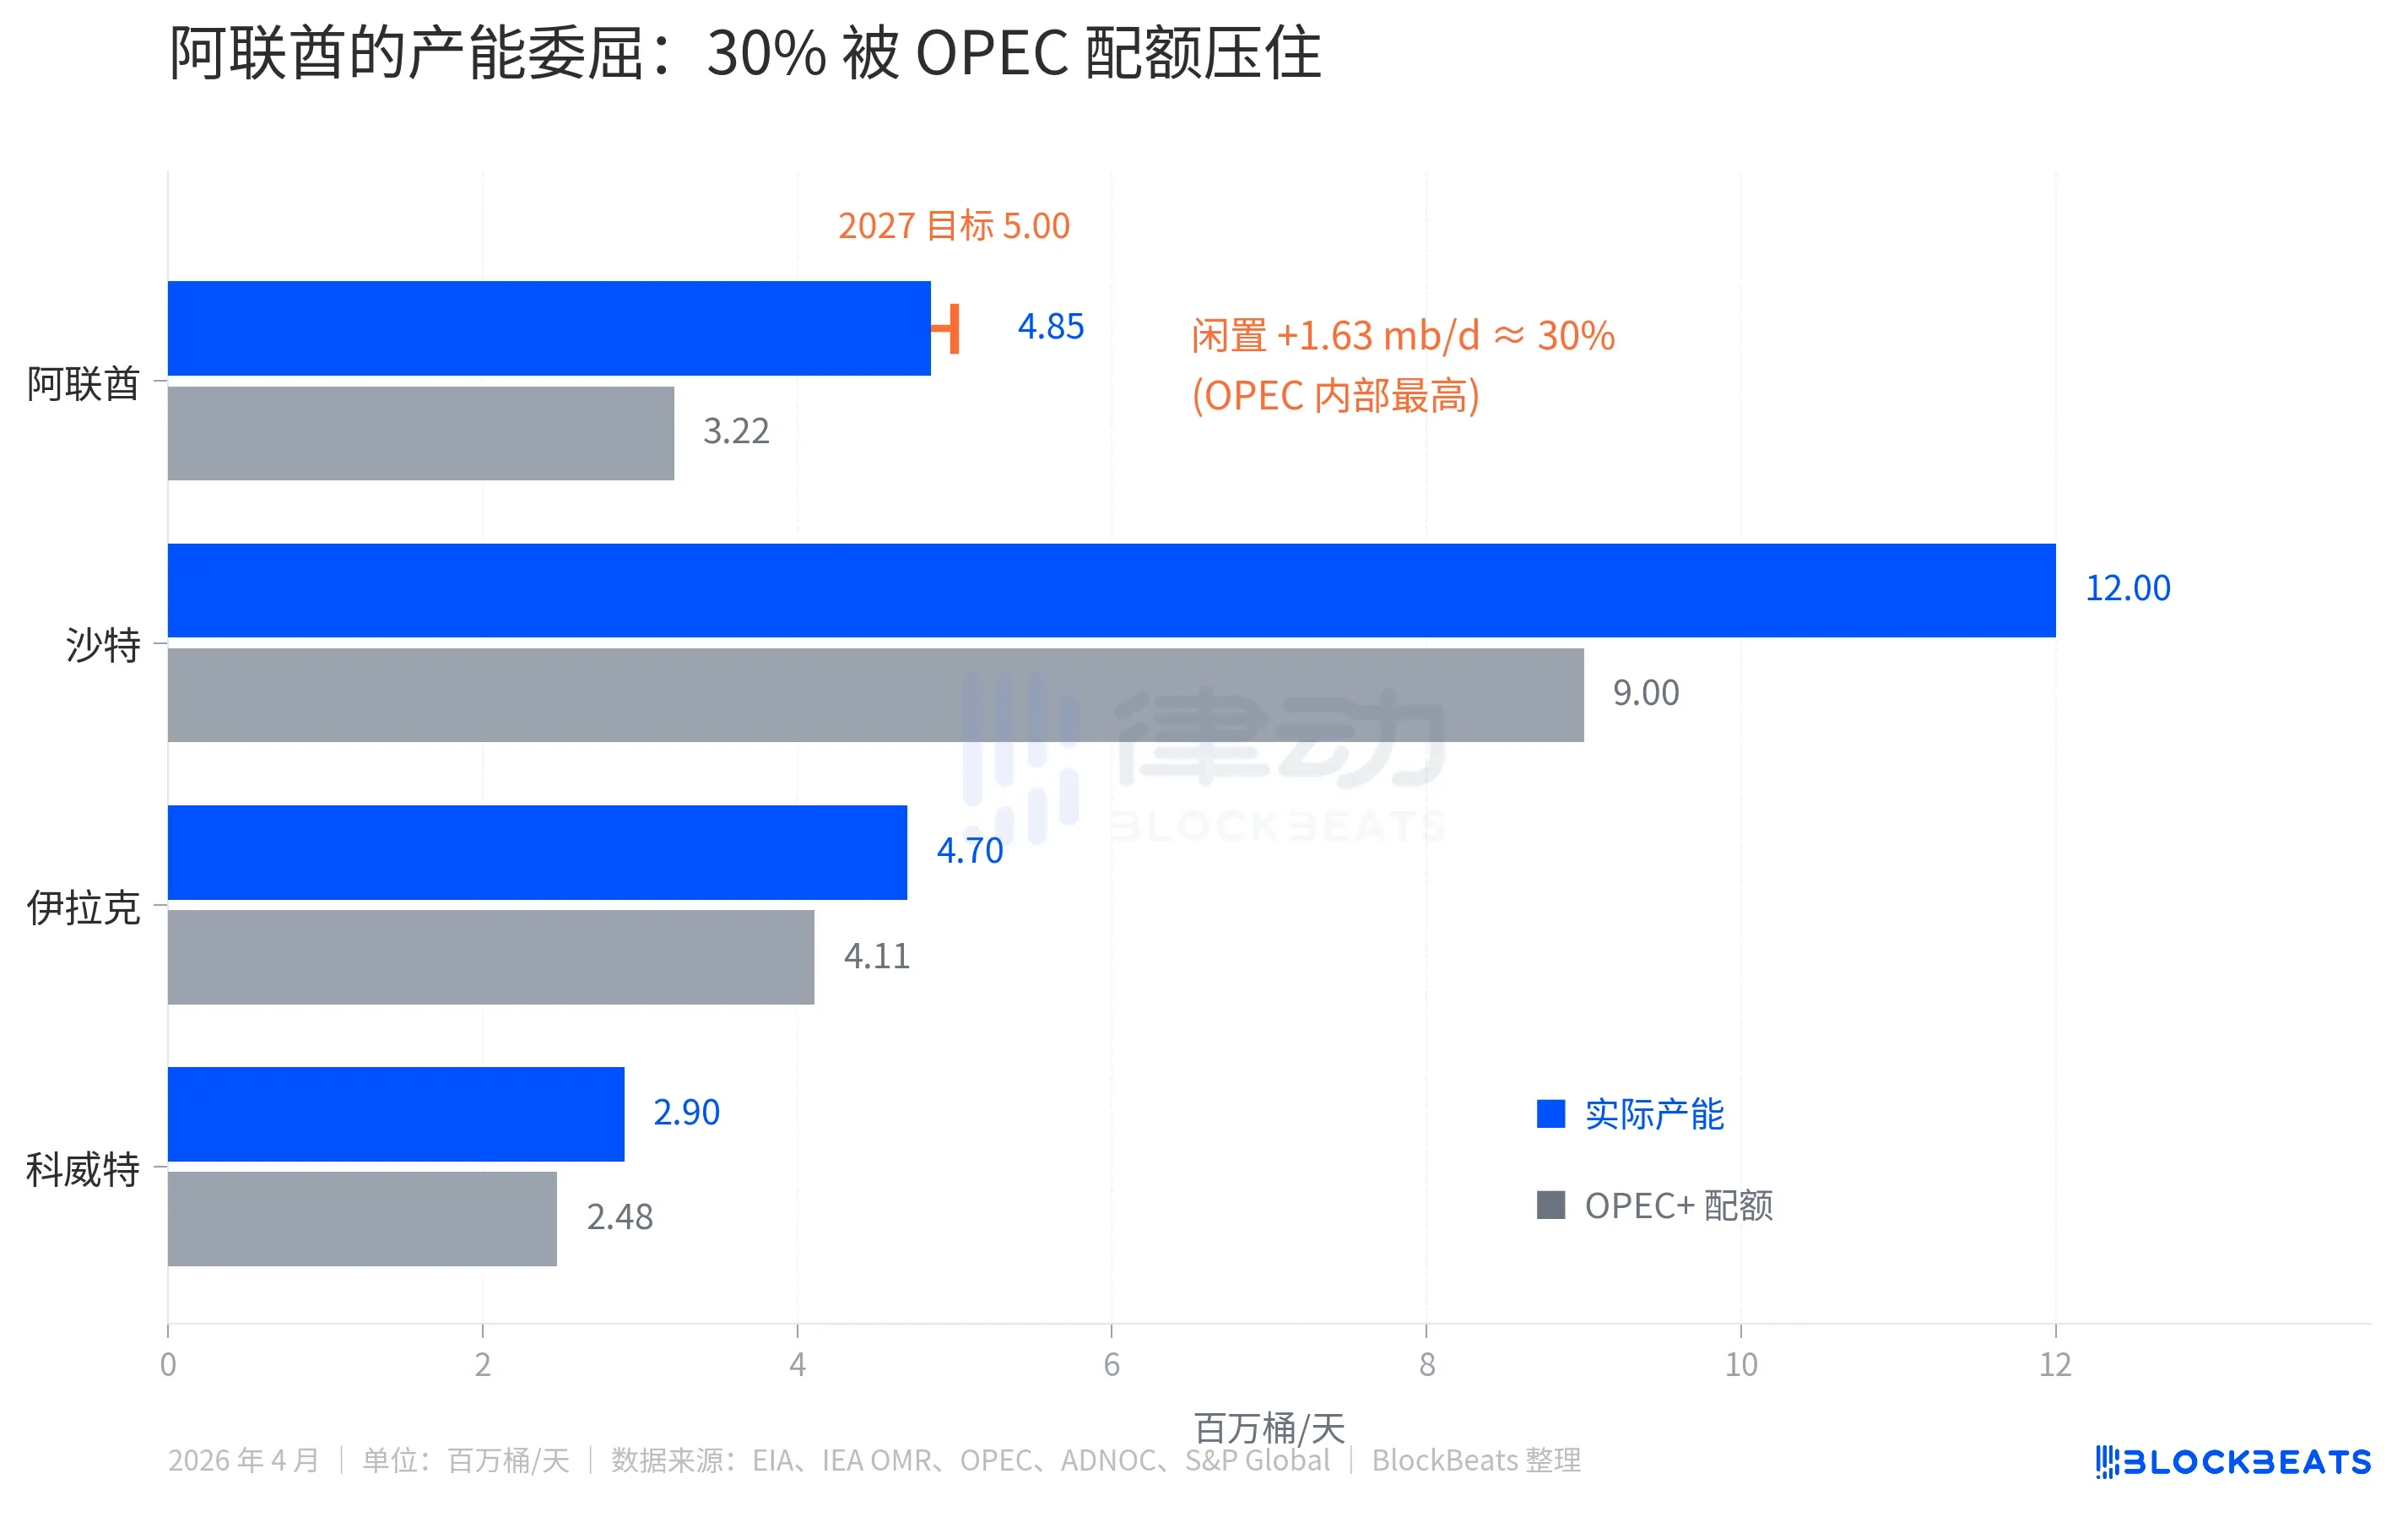
There is another layer of discontent. The UAE's national oil company, ADNOC, is accelerating its investments. According to ADNOC announcements, its 2023-2027 capital expenditure budget is $150 billion, and the 5.0 mb/d capacity target has been moved forward from 2030 to 2027. While investing heavily to expand capacity, it is simultaneously prevented from selling more by OPEC quotas, resulting in millions of barrels of daily revenue being left on the table.
This is the financial rationale behind the UAE's necessary departure. But looking at this reason alone, conventional economic logic suggests that a member state with 30% idle capacity, freed from quota constraints, would increase production. More oil means increased supply. Increased supply is bearish for oil prices.
Backwardation in Crude Oil Futures
On April 28, mainstream headlines read "Brent Surges." But the surge was confined to near-month futures. The orange dashed line representing far-month expectations barely moved throughout April.
At the close on April 28, Brent futures for the June contract (the front-month, essentially the price for 'immediate delivery') stood at $109.34, while the July contract was at $102.77, a spread of $6.57. This futures curve shows deep backwardation, with near-term prices pushed higher and far-term prices relatively cheaper.
The futures curve is not speculation; it represents real contract prices. It tells you that the market is willing to pay more for oil now but expects to pay less for oil in a few months. The underlying logic is simple: the market anticipates the Strait of Hormuz crisis will be resolved, OPEC's supply coordination will loosen, and the UAE's 30% idle capacity will enter the market.
Reconstructing this story across the entire month of April provides greater clarity. According to EIA Brent Dated Spot data, the spot price surged to $138.21 per barrel on April 7, the month's peak, a full $35 higher than the April 28 far-month expectation of $102.77. This $35 represents the panic premium the market was willing to pay for 'immediate access to oil'. At that time, the US-Iran conflict entered its ninth week, traffic through the Strait of Hormuz was nearly completely severed, and the daily transport of roughly 20 million barrels of Middle Eastern crude oil was reduced to near zero.
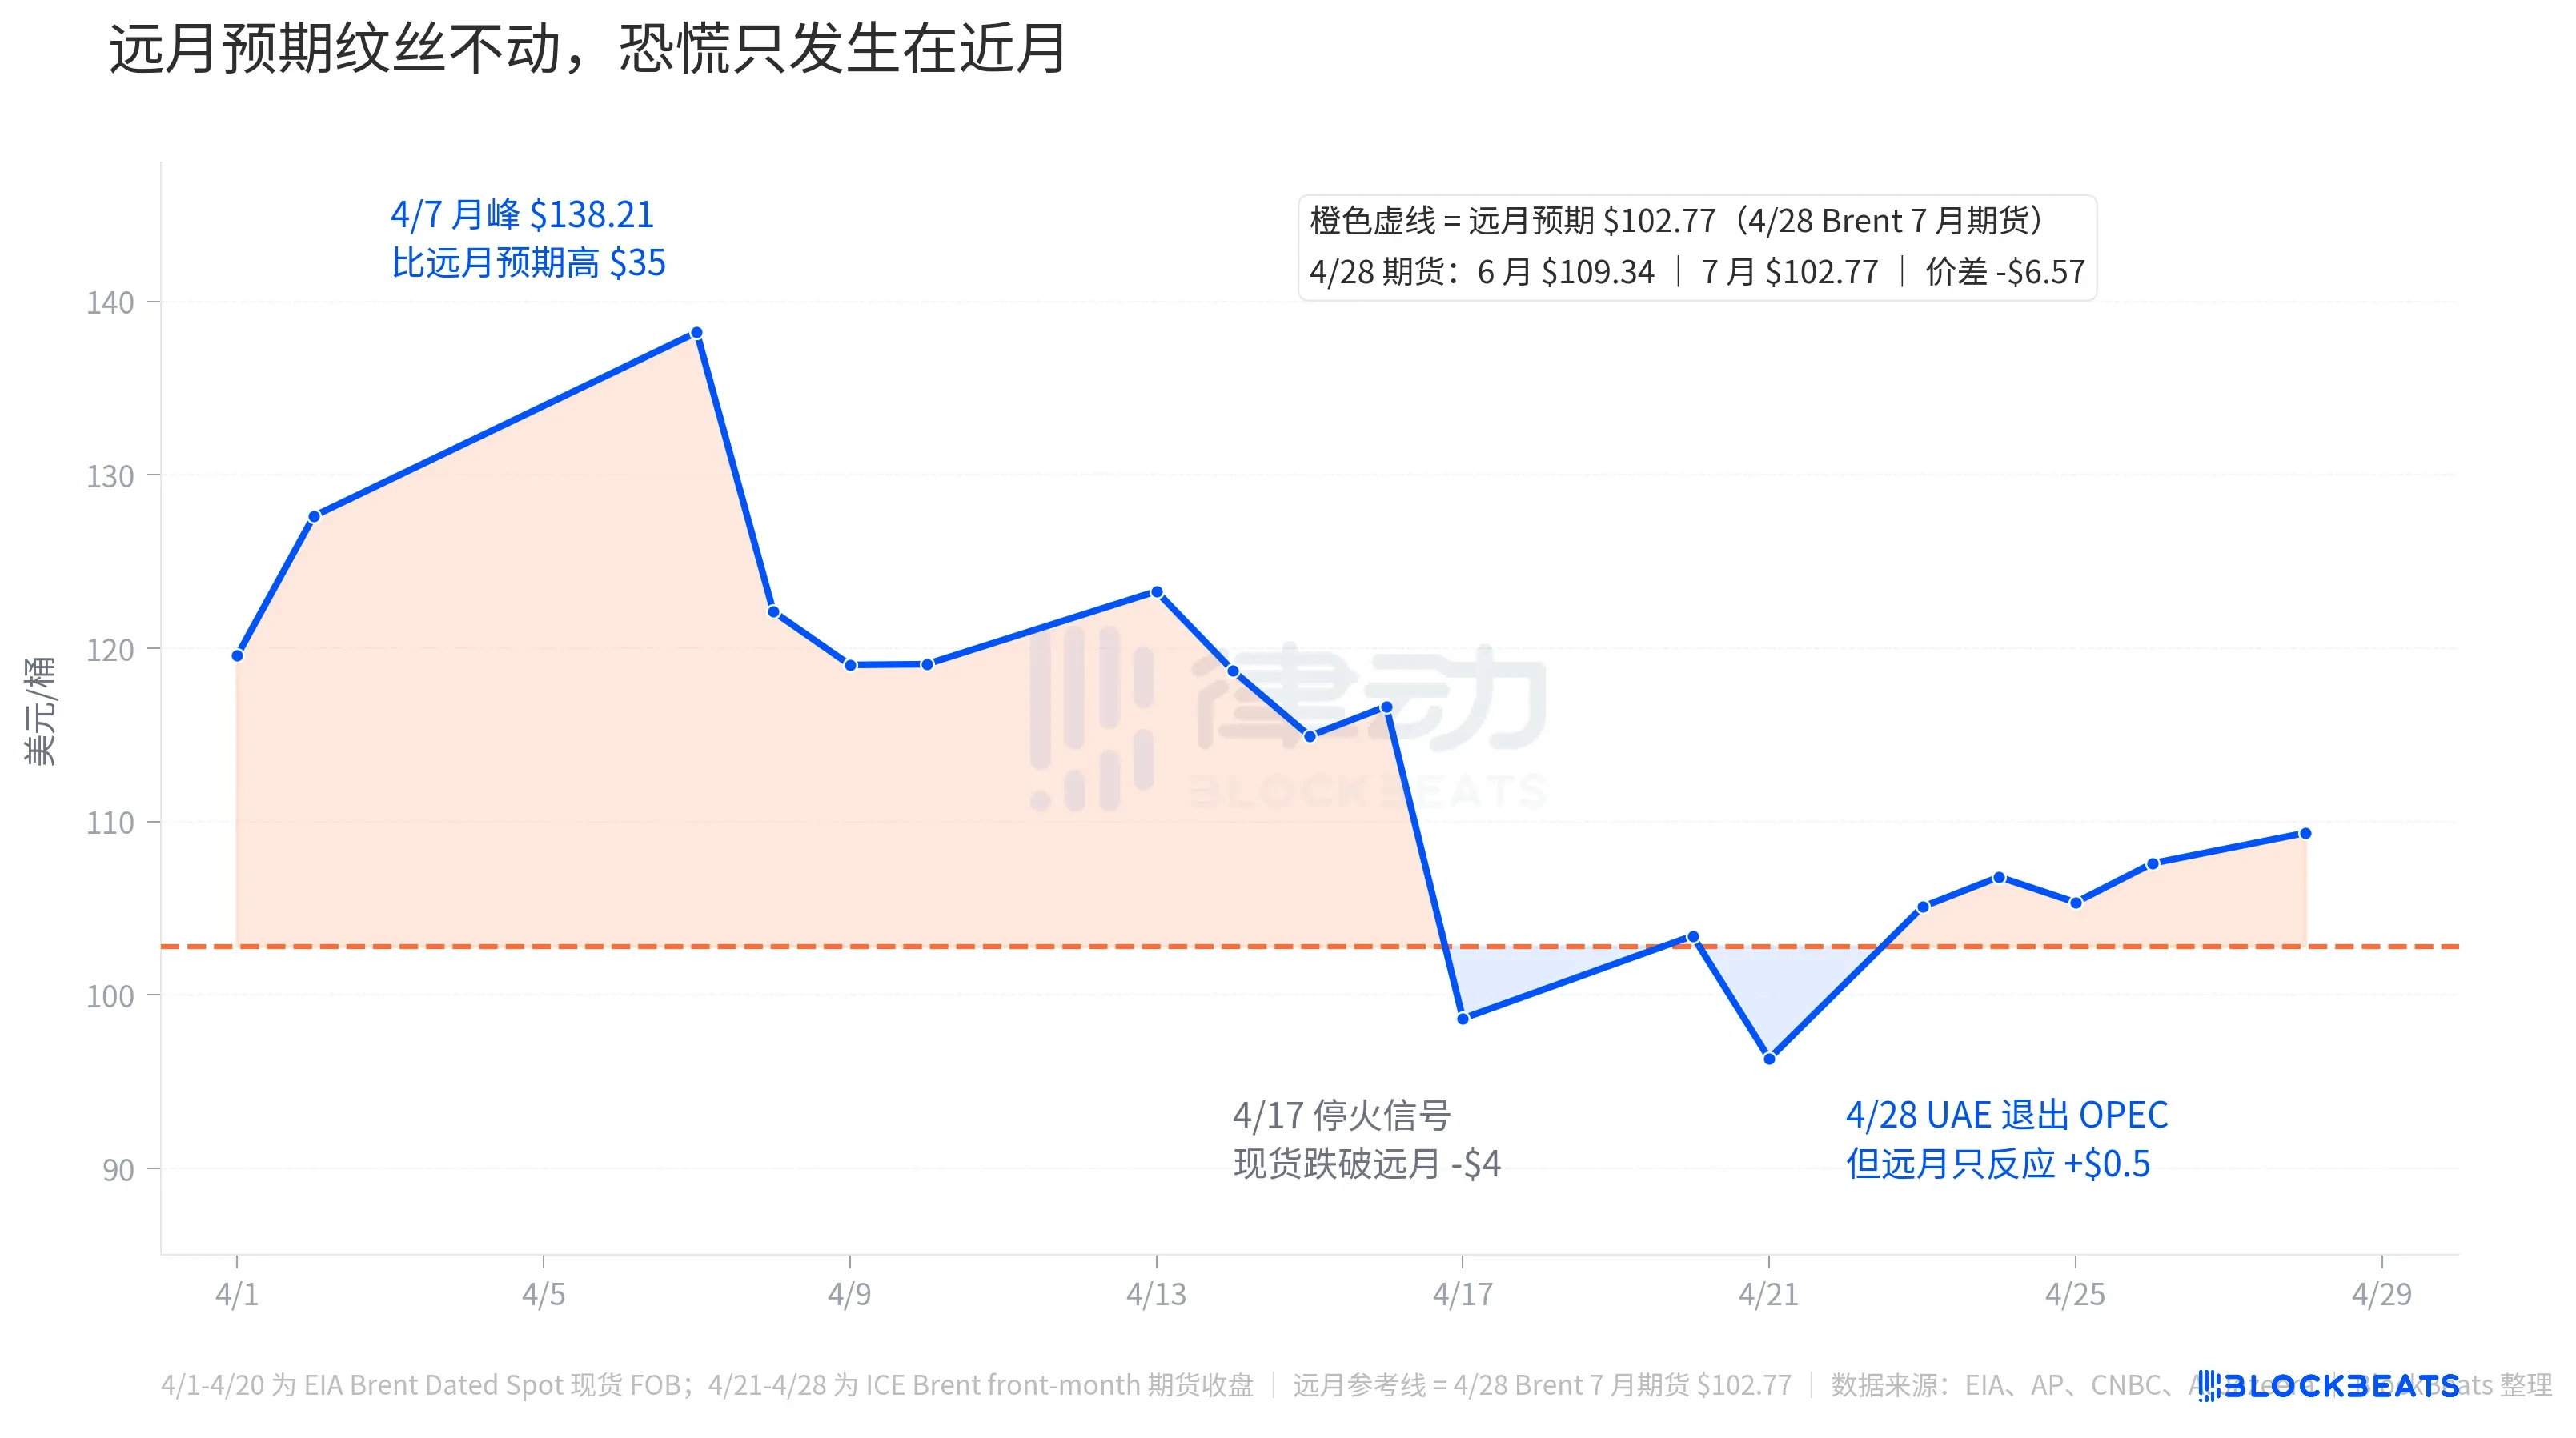
Then, on April 17, ceasefire signals emerged. Brent spot prices fell to $98.63 that day, dropping below the far-month expectation by about $4. The market briefly believed the conflict might end, making 'future oil' temporarily more expensive than 'current oil'. This anomalous condition lasted only a few days. Brent hit a monthly low of $96.32 on April 21, and rebounded on April 23.
On April 28, the UAE announced its withdrawal. The June Brent contract rose another $1.11 to $109.34, returning to a $6.57 premium above the far-month expectation. However, this is just a fraction of the panic premium seen in early April. In other words, the market's panicked reaction to the UAE's withdrawal is far smaller than its reaction to the Strait of Hormuz crisis.
The far-month line tells an even more direct story. On the day of the UAE's announcement, the July futures contract rose only $1.08 to $102.77, nearly identical to the increase in the June contract. This implies the market views the UAE's withdrawal as having a near-zero impact on medium-term oil prices—neither bullish nor bearish. The short-term surge is merely headline noise compounded by Strait of Hormuz psychology.
The Largest Exit in the History of OPEC Withdrawals
Indonesia left for the first time in 2008 (rejoined in 2014, left again in 2016), Qatar exited in 2019 to focus on LNG, and Ecuador left in 2020 due to fiscal pressure. During these four exits, the departing members each accounted for 2-3.1% of OPEC's total production. Each time was interpreted as an isolated event, and each time OPEC's market share was not significantly affected.
The UAE's share is 13%. Its exit is equivalent to more than 1.5 times the combined impact of all exits over the past 18 years.
But for oil pricing, large scale does not necessarily mean large impact. The 13% figure must be absorbed within the framework of OPEC discipline led by Saudi Arabia, which still has roughly 25% idle capacity to offset the shortfall. The production quotas of other OPEC+ members can also be adjusted. The market has not translated "OPEC losing 13% of its output" into a prediction of "sharply higher future oil prices."
The real structural impact lies on another level: the further weakening of OPEC's function as a 'price regulator.' According to IEA estimates, OPEC+'s total spare capacity in early 2026 was roughly 4-5 mb/d, with the UAE contributing about 0.85 mb/d. After the UAE's departure, the spare capacity of the 13 OPEC members will shrink to approximately 1 mb/d. This is the 'ammunition' available to the market in the event of future supply shocks—a mere 1% of global demand.
This is why far-month futures only rose by $1. It wasn't because the UAE's additional oil production would necessarily lower prices, but because OPEC's capacity to act as an anchor for price stability has been eroded yet again.
Mainstream reports frame the UAE's exit within the rising trend of the Strait of Hormuz crisis, making it appear as if OPEC's disintegration is pushing oil prices higher. The futures curve disentangles these two events. In early April, the Brent spot price was briefly $35 more expensive than the far-month futures—that was the panic premium of the Strait of Hormuz crisis. On April 28, the near-far month spread was only $6.57, the combined effect of the UAE's exit and headline noise. The market's true pricing of the UAE event is hidden within that nearly unchanged far-month futures curve.


