
穿透减半的「统计学意义」:比特币看涨是可交易事件么?
原文编译:Frank,Foresight News
总结:
从表面上看,比特币减半这一备受期待的事件在历史上通常是看涨的;
然而,考虑到可以借鉴研究的减半历史发生次数较少,并且更加仔细地观察比特币在整体市场环境下的表现,很难仅凭减半事件本身做出任何高确定性的判断;
总体而言,从供应角度来看,比特币减半可能不是一个可交易的事件,但它具有结构性看涨因素,如果有适当的宏观风向支持,比特币在减半后可能会再次出现反弹行情;
关于比特币减半的共识是看涨,并且普遍认为这是一个可交易的事件,但事实真如此么?在本报告中,我们深入研究了过去的减半事件,并对 2024 年减半进行了供应和宏观数据分析,以获取更多关于这个被广泛预测事件对投资者意味着什么的综合信息。
什么是比特币减半?
减半,是比特币网络中预先编程的事件,指将比特币矿工的奖励减半。这是比特币货币政策中的一个重要机制,它确保只有 2100 万枚 BTC 最终会进入流通,以防止通货膨胀,并降低后续新 BTC 的发行速度。
其中这个程序更新每 210, 000 个区块进行一次,大致相当于每四年一次,且当比特币在 2009 年推出时,挖矿奖励设定为 50 枚 BTC,由于今天的减半是第四次,加上之前的三次减半(2012 年、 2016 年和 2020 年),奖励已经降至每个区块 3.125 枚 BTC。
众所周知,比特币使用工作量证明(PoW)共识机制来验证和保护区块链上的交易,而在 PoW 中,矿工需要互相竞争解决复杂的数学问题,且第一个正确解决的矿工可以将下一个交易区块添加到区块链中。
而作为验证交易和向区块链添加区块的补偿,获胜的矿工将获得新创建的比特币作为奖励——正是这份奖励,在今天的减半事件中被「减半」。
历史上关于「减半」的冷酷现实
从表面上看,减半在历史上已被证明对 BTC 非常有利。
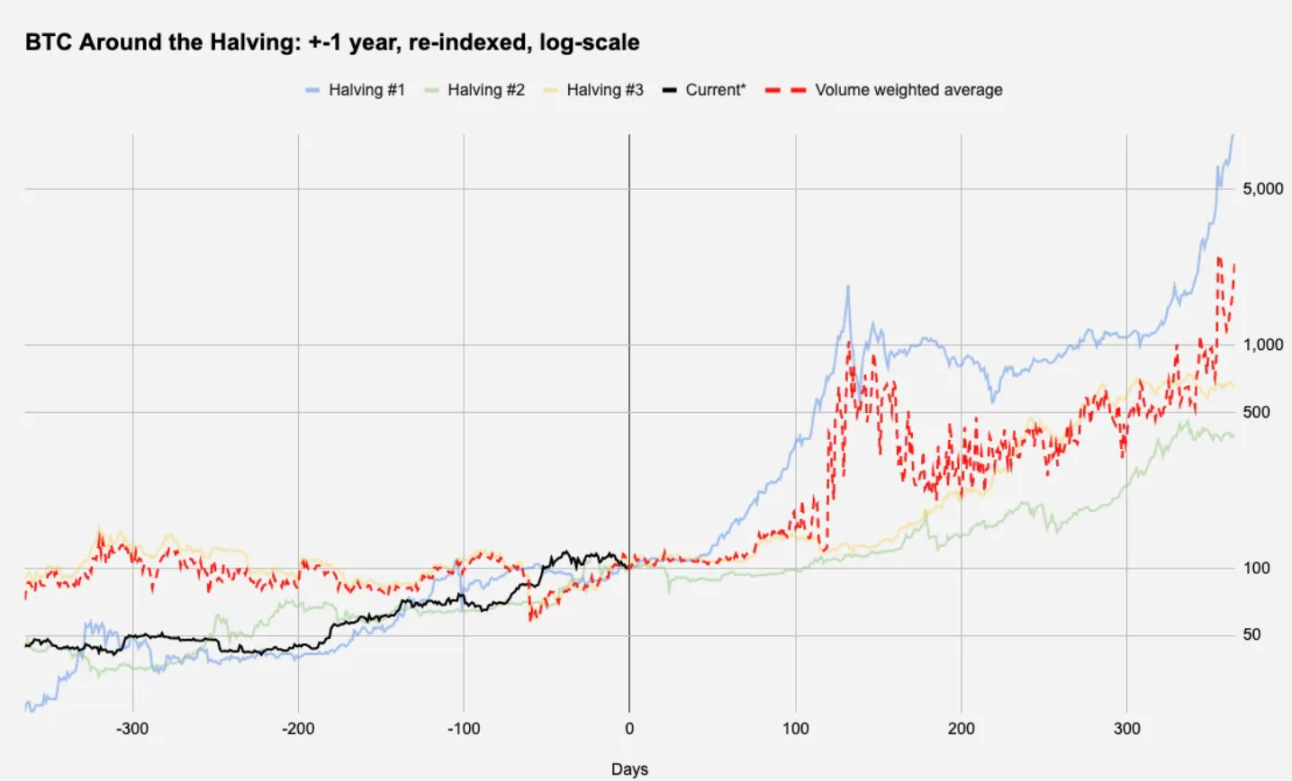
上图就显示了 BTC 在每一个减半日之前和之后的历史价格走势(范围是从减半前 1 年到后 1 年),红色虚线显示过去每次减半的成交量加权平均值,而黑线显示当前的 BTC 数据情况。
下图则以表格形式概述了相关数据,注意:横轴的 Day 0 = 减半日期,纵轴的 Day 0 = 100 ,此外本文是使用 4 月 17 日的价格数据来进行推断。
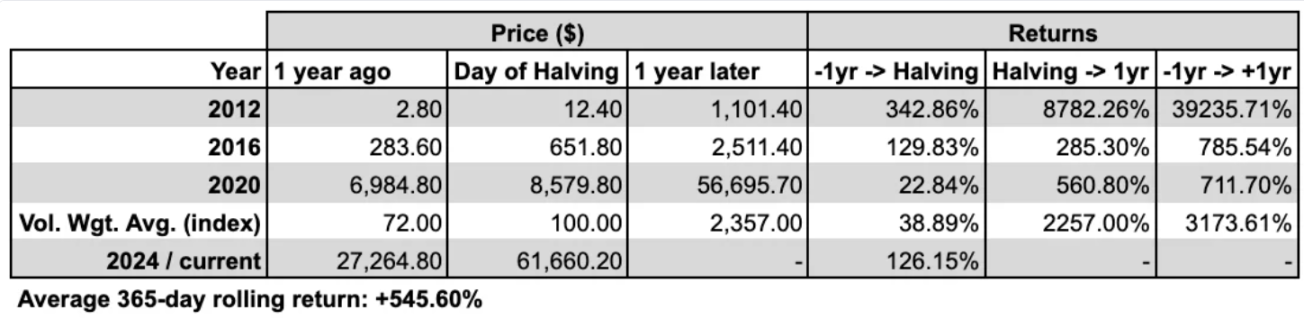
第一张图的对数刻度的 Y 轴表明减半是看涨催化剂,但鉴于我们只有三个观察结果,且第一个是 BTC 仅为 12.80 美元;第三个发生在 2020 年 5 月——当时所有风险资产都在 Covid 反弹中大幅上涨,所以似乎任何对数据的解释都需要保持怀疑态度。
此外,当我们查看一下 BTC 自 2011 年年中以来的平均 1 年回报率时,会发现除了 2012 年的第一次减半外,其它的减半发生后的 1 年回报率看起来都并不令人十分满意。
同时, 2020 年的减半引出了一个有趣的问题,即彼时的全球市场总体表现如何。在下图中,我们使用股票(特别是标准普尔 500 指数)作为风险资产的基准进行了比较。
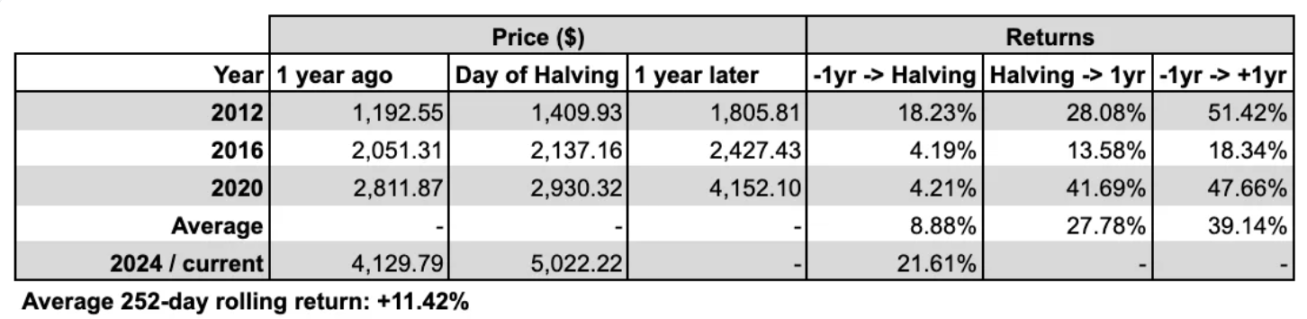
虽然 SPX 自 2011 年 7 月中旬以来的 1 年平均滚动回报率为 + 11.42% (与 BTC 历史价格数据相匹配),但其在比特币减半后开始算起的 1 年平均表现则超过 + 27% ——即平均值的两倍多!
这凸显了一个重要的现实,而常见的叙事往往忽略了这一点。出于同样的原因,我们不能得出「因此,比特币网络中的程序更新将矿工获得的奖励减半,这对标准普尔 500 指数非常有利」的结论,我们也可能无法从 BTC 过去的表现中得出真正的结论性陈述。
否则,通过某些指标,例如优于平均表现的命中率,你甚至可以得出结论——比特币减半对标普 500 指数的利好程度要高于对比特币本身的利好程度!
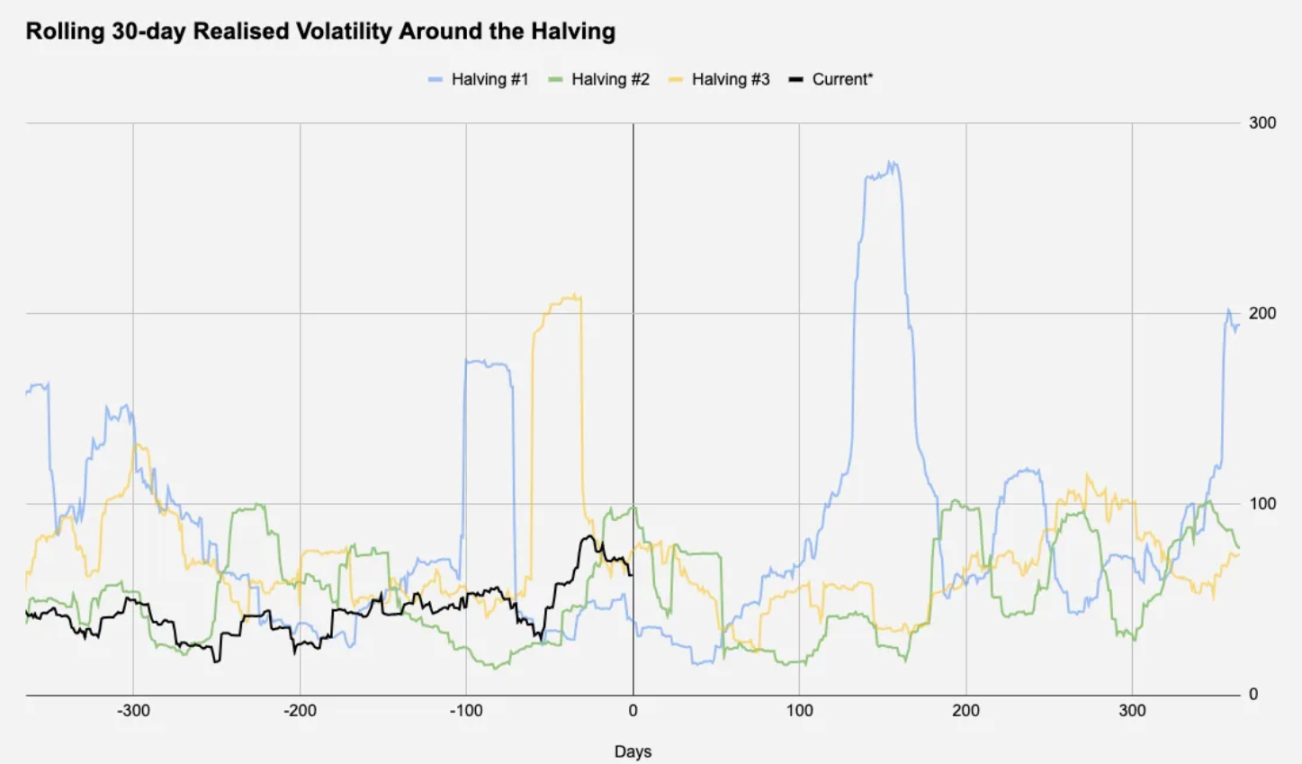
同时,对于那些对波动性感兴趣的人来说,数据显示波动性似乎与减半日期或周期没有明显的关系,下图就显示了减半日期(+-365 天)前后的 30 天实际波动率:
2024 减半主题 #1 :长期持有者
在这里,我们看一下长期持有者持有的 BTC 总量,并根据 BTC 的供应量进行调整。
考虑到比特币的流通供应会一直增加,直到达到 2100 万比特币的硬顶限制,所以我们将长期持有者的数量除以当时的流通供应,以百分比形式查看持有量:
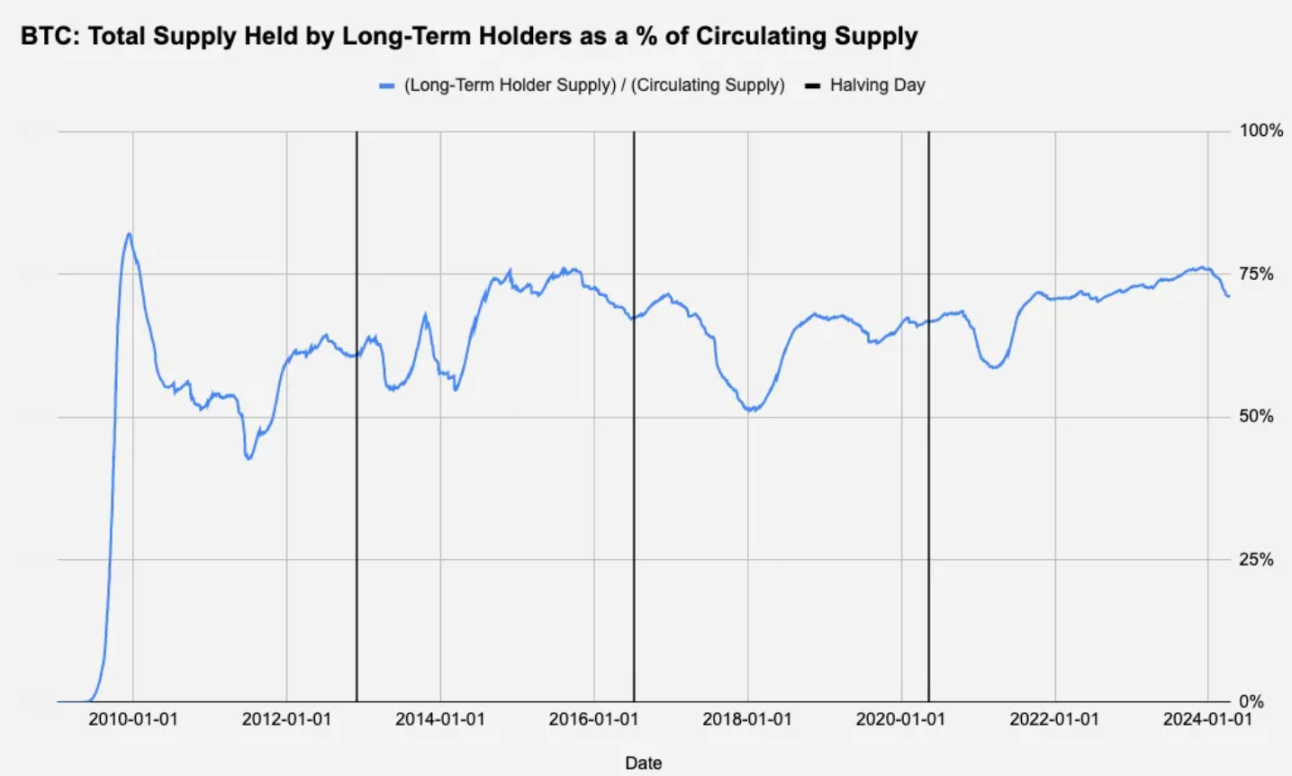
尽管 2020 年的情况微妙,但图 5 表明,长期持有者可能会在减半之前获利了结, 2024 年也会出现下跌。这种销售动态通常归因于矿工;由于减半基本上使每个区块的收入减少了 50% ,矿工通常会在奖励减少时出售部分国库来升级他们的硬件,以实现更有效的挖矿。这种结构性抛售压力现在可能正在发生,因为我们距离 2024 年减半还有几天。
尽管在 2020 年的情况很微妙,但上图表明,长期持有者可能会在减半前套现,且 2024 年也出现了这种情况。
这种卖出选择通常归因于矿工——由于减半实质上会将每个区块的收入减少 50% ,因此在奖励减少时,矿工通常会出售部分储藏 BTC 以升级他们的硬件,以便进行更高效的挖矿,这种结构性的卖压可能目前也正在发生。
2024 年减半主题 #2 :交易所 BTC 余额
尽管交易所不进行方向性的押注,但我们仍然会查看交易所的 BTC 储备持有量(推而广之,也可能是其内部做市商),以查看在减半日附近是否存在某种可遵循的模式:
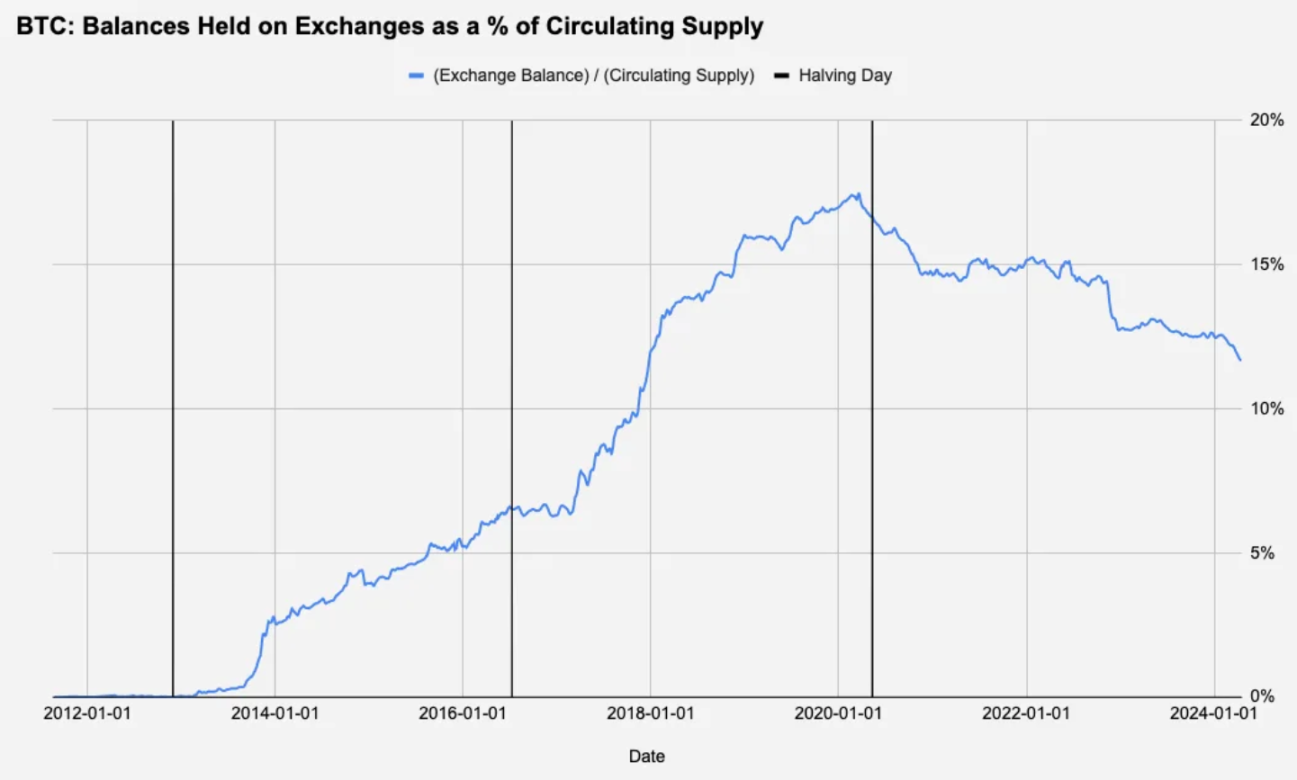
上图是将加密货币交易所持有的比特币总供应量除以当时的流通供应量,似乎没有什么有趣的东西。唯一可观察到的趋势是长期趋势——交易所经历了约 6 年的积累阶段后,随着上一轮牛市的开始,BTC 持有量开始稳步下降。
2024 年减半主题 #3 :宏观背景
宏观条件与比特币的相关性经常被争论,但宏观周期,特别是美元流动性(作为货币政策 / 利率、风险偏好等的函数)仍然是中长期资产价格的主要驱动力。有鉴于此,我们仔细研究了下图中减半日后未来 12 个月联邦基金利率对应的市场定价。
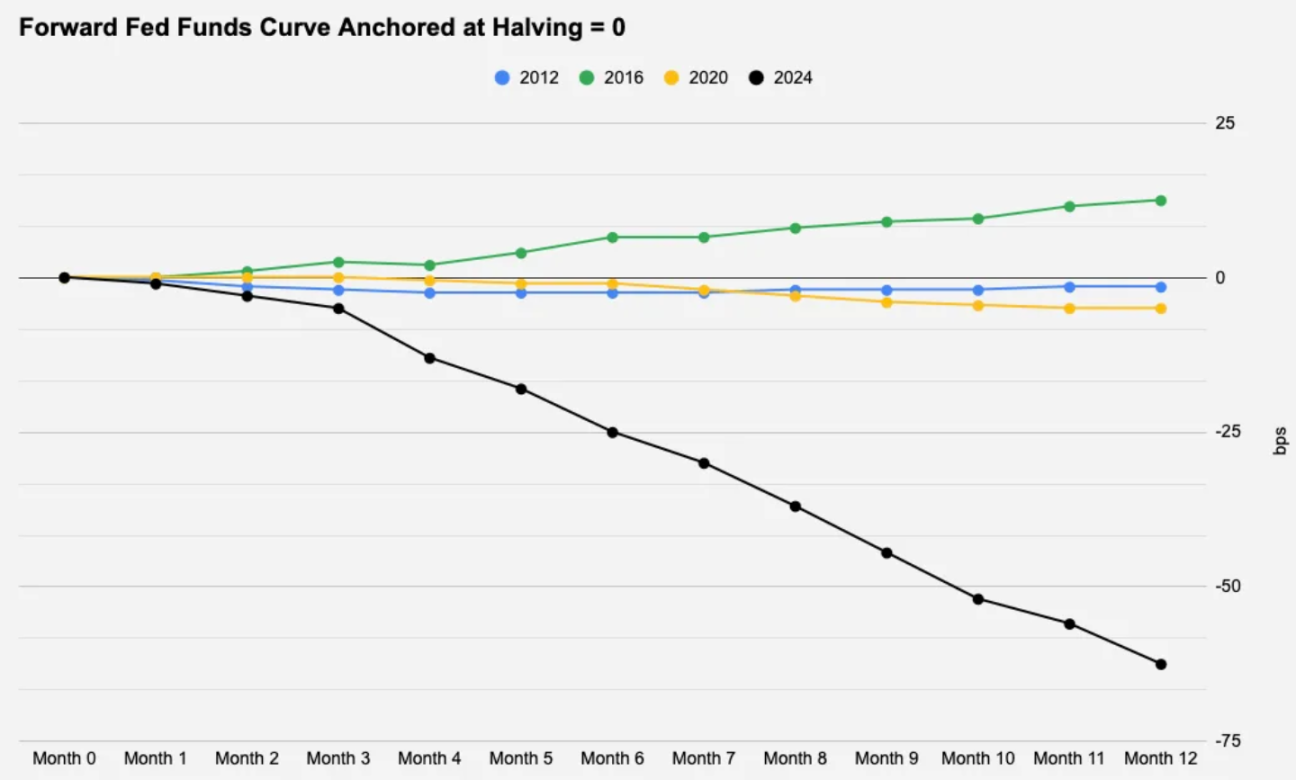
很明显, 2024 年的减半是一个异常值,几乎有 3 次降息被定价进去,或者更简单地说,就是市场已对任何形式的利率变动有所预期。
降息通常对风险资产有利,但对价格走势来说,重要的往往不是已经定价进去的因素,而是与市场预期的偏差程度——无论是通胀数据还是美联储主席的声明。在下图,我们比较了每个减半日实际结算隐含利率与市场预期之间的差异,以查看上图中的前瞻性定价的准确性。
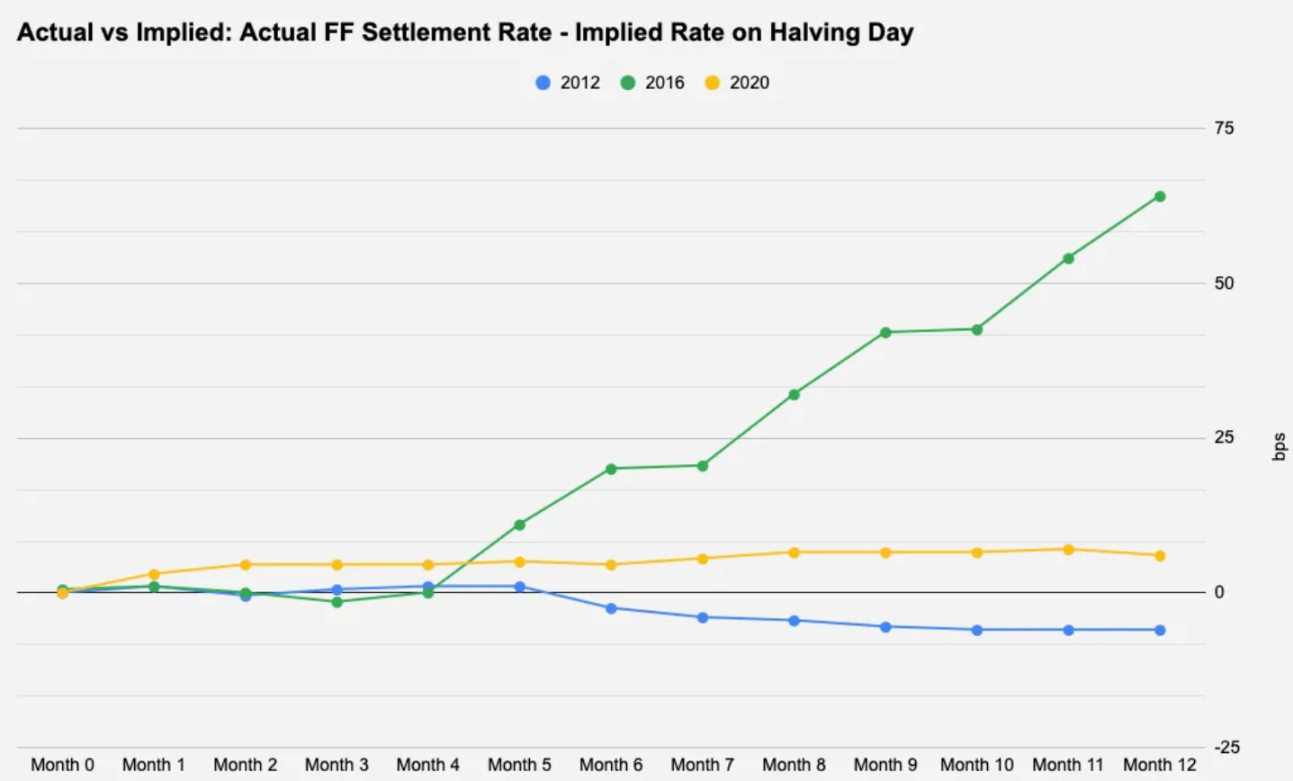
其中 2012 年和 2020 年的数据相当平淡无奇,与最初预期相差 +-10 个基点,但 2016 年值得研究,因为美联储在彼时两次加息,而当时市场并没有对此进行定价。
有趣的是,上文的图 1 和图 2 显示, 2016 年减半后的 12 个月是 BTC 在前三次减半中表现最差的一个月,也是唯一一次表现低于其 1 年平均回报率的月份。因此,由于今天已经消化了未来 12 个月的两次以上降息,此次 BTC 减半后更重要的驱动因素,可能是持续的美国通胀或其他任何可能鼓励美联储继续按兵不动而不进行降息的事情。
结论
我们简要探讨了此次减半的独特宏观背景,但本报告中未提及其他考虑因素——最近推出的现货 BTC ETF 等。随着 BTC 最近引起的所有关注,这绝对是迄今为止最受期待的减半,BTC 的普遍机构化引入了新的参与者,可能会改变供需和价格走势动态,值得注意的是,新推出的 ETF 持有 BTC 流通供应量的 4.1% 以上,而 MicroStrategy 持有超过 1% 的供应量。
鉴于之前只有三次减半,所以很难从过去的表现中得出具有统计学意义的结论,以确定这是否是一个可交易的事件。然而,从结构上看,从供应的角度来看,这无疑是一个利好事件。


