
比值修复下半场:黄金让位,比特币何时登场?
Original text by: that1618guy, Analyst at Delphi Digital
Compiled by: Chopper, Foresight News
Three months ago, I published an article titled "Bitcoin vs. Gold: Positioning for the Next Relative Cycle". The core thesis was clear: under the weekly 9/21 EMA (Exponential Moving Average) framework, the Bitcoin/Gold ratio had fallen to the second-largest retracement zone in history, indicating it was nearing a bottom from a data perspective. (Note: The weekly 9/21 EMA is a commonly used combination of trend determination and turning point signals for trend traders.)
This judgment has now proven correct. The ratio has rebounded approximately 46% from its February low, Gold has corrected 18% from its all-time high of $5,589, while Bitcoin has steadily climbed from the $65,000 range back towards $80,000. As the key confirmation signal, the weekly 9/21 EMA golden cross is currently projected to form in the first week of June. Historically, following a deep death cross and subsequent golden cross, the ratio saw gains of 148%, 641%, and 148% in subsequent cycles.
However, the macroeconomic environment has changed dramatically. With the current inflation rate at 3.8%, expectations for a Fed rate cut completely dashed, the ongoing US-Iran conflict, and Kevin Warsh officially taking office as Fed Chair on May 13th, the market landscape for the second half of 2026 is far more complex than it was in February. Nevertheless, the overarching trend of Bitcoin outperforming Gold remains unchanged.
This article will review the previous prediction of the Bitcoin/Gold ratio movement, revisit the realization of views on Gold and the macro market from "2026 Annual Market Outlook", and provide an updated analytical framework for the second half of the year.
The Bitcoin/Gold Ratio Recovery is Underway
When the article was published at the end of February, the Bitcoin/Gold ratio was hovering between 12.5 and 13, an extreme historical low. At that time, Bitcoin was around $65,000, and after a surge, Gold was quoted at $5,100.
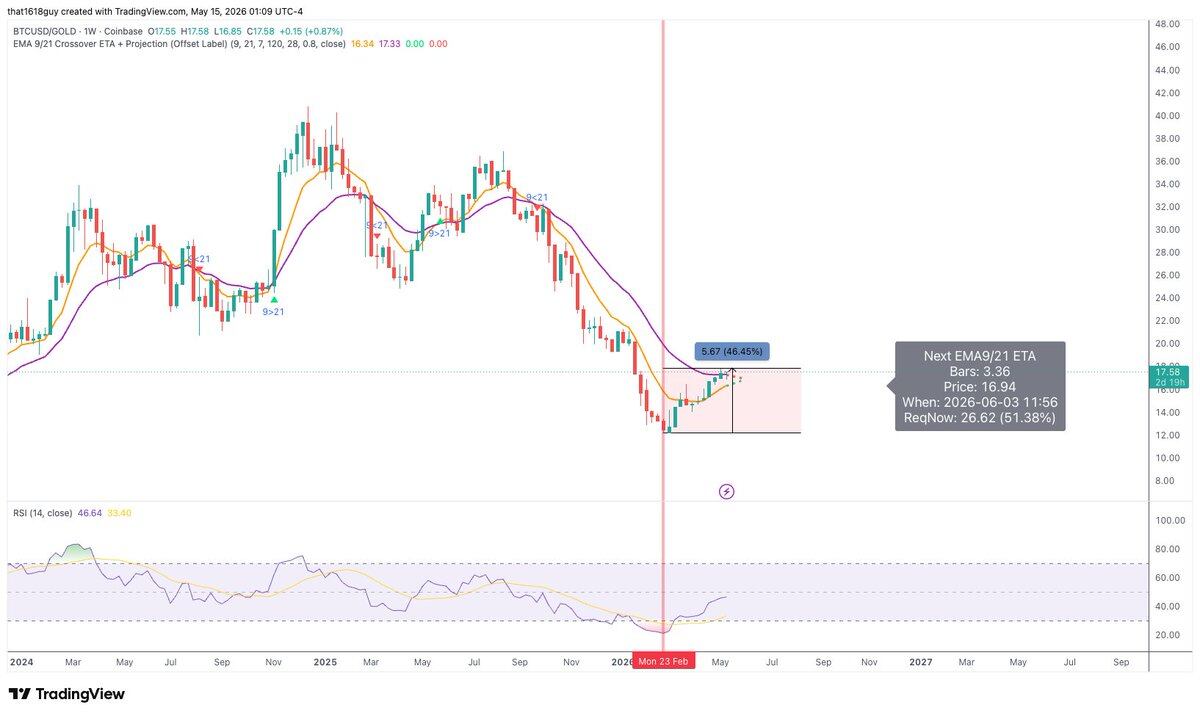
Now, the ratio has risen to 17.6, a significant increase from the low point. This recovery is entirely driven by one primary scenario: Bitcoin hasn't seen a violent breakout, but has achieved relative strength through a pullback in Gold prices. This was the most overlooked market scenario mentioned in my previous article. Few in the market realize that the core driver of Bitcoin's recent outperformance over Gold has been Gold's weakness, which is the actual market condition since mid-February.
The drawdown of this ratio from its October 2025 high has narrowed from about 60% to 46%. Historically, this is still within a deep retracement zone, but it has moved away from the extreme lows, dropping from the second-largest historical drawdown to a moderate retracement level.
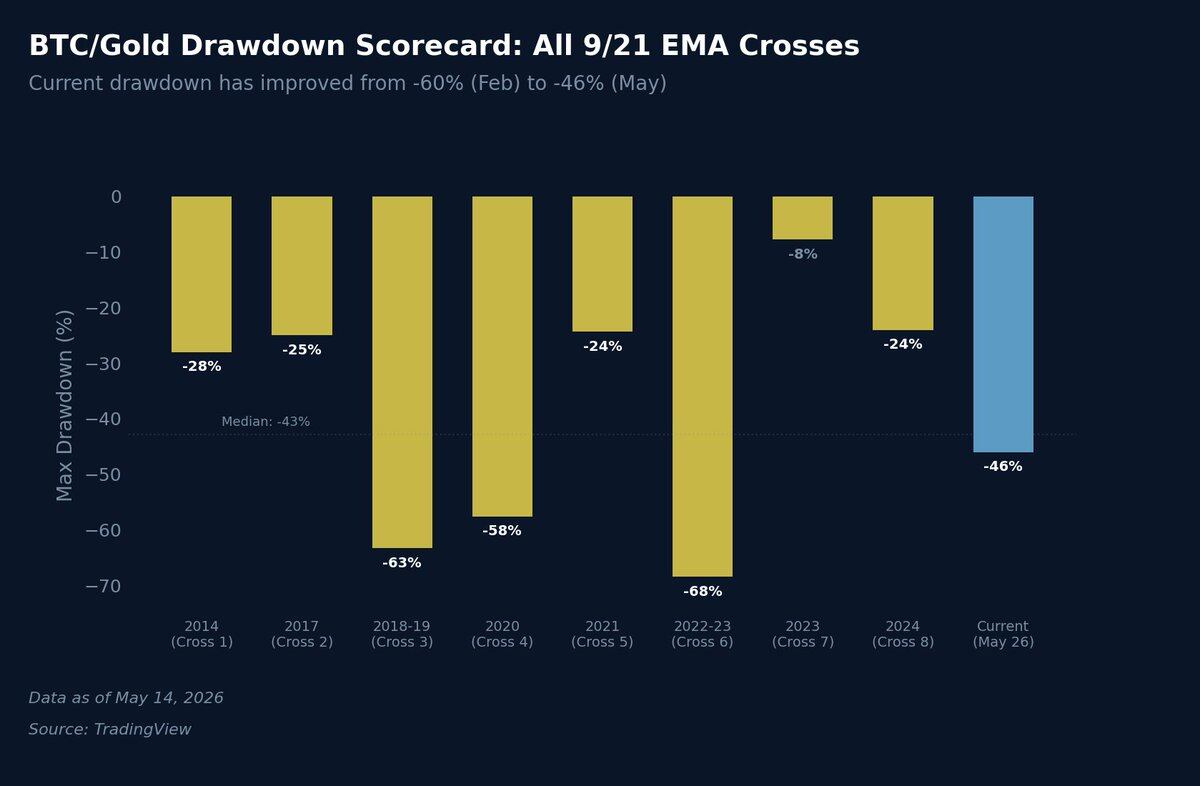
Looking back at eight historical downturns, only the 2018 bear market (63% drawdown) and the 2022 bear market (69% drawdown) saw deeper declines than the February low. The current 46% drawdown is now close to the historical median drawdown of 43%, showing significant market repair from the extreme lows three months ago.
The critical convergence of the 9/21 weekly moving averages that I highlighted earlier hasn't fully materialized yet. Both lines are still in a bearish trend, but the gap between them is rapidly narrowing. Based on trading desk model projections, it will take approximately 3.5 more weekly candlesticks to form a bullish golden cross, which points to around the first week of June 2026.
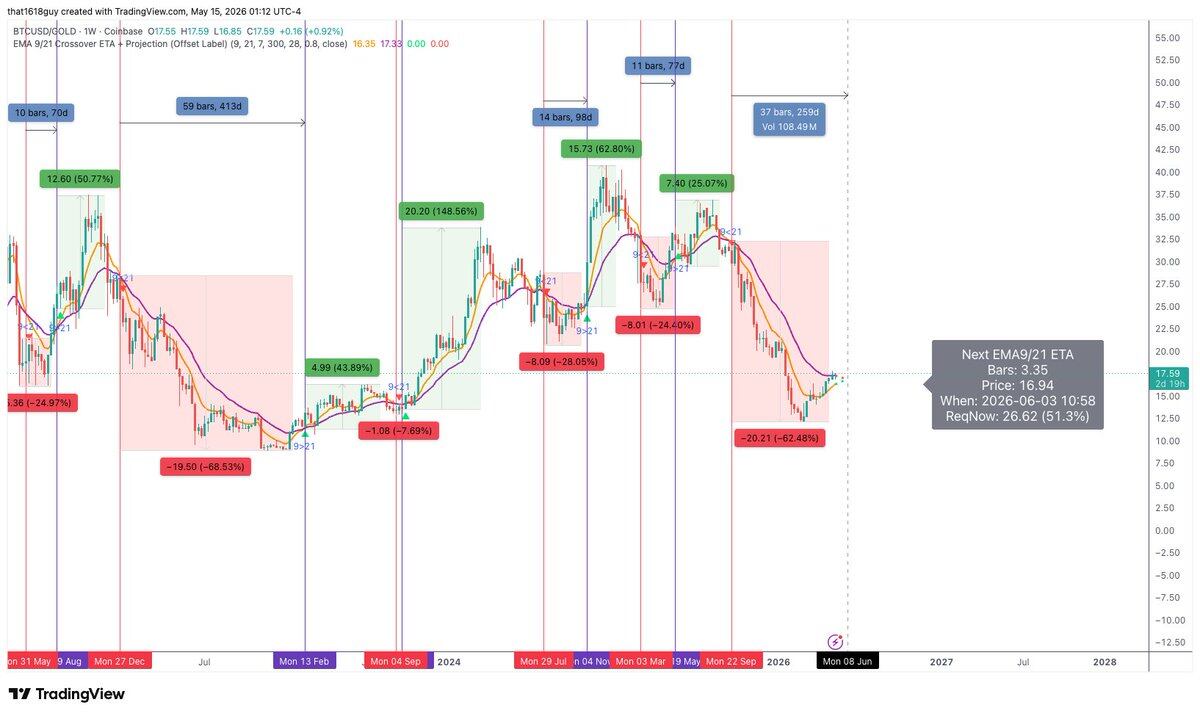
Following the previous weekly death cross, the Bitcoin/Gold ratio fell sharply by 62%. This movement closely aligns with the three historical deep death crosses (63% in 2018, 57% in 2020, 68% in 2022), confirming the validity of this technical analysis framework in downturns.
Similarly, the uptrend cycles also offer strong reference points. Once a bullish golden cross is confirmed and holds, history often shows violent rallies. After the three deepest death crosses, the subsequent golden crosses led to ratio gains of 148%, 641%, and 148%; even in shallower retracements, golden crosses produced gains of 25% to 62%.
A crucial caveat: Not all golden crosses lead to sustained moves. A false breakout occurred in 2023 where the moving averages briefly crossed but quickly reversed, leading to a 7.69% decline in the ratio – the smallest and shortest-lived death cross in the dataset. Investors can use momentum indicators like MACD and Stochastic Oscillator to gauge the strength of a golden cross and distinguish genuine signals from false ones.
I firmly believe that Bitcoin will continue to outperform Gold for the remainder of 2026, and this trend could even extend into the first half of 2027. The core focus for the market now is the magnitude of this potential rally once the golden cross is confirmed and holds.
Review of the Annual Gold Outlook
In the "2026 Annual Market Outlook" report, when Gold was still trading in the $4,600 range, we identified it as one of the most noteworthy asset classes. We clearly pointed to solid structural tailwinds: continued central bank gold accumulation (especially by the People's Bank of China), fiscal deficits exacerbating currency debasement, and the secular trend of de-dollarization in global foreign reserves.
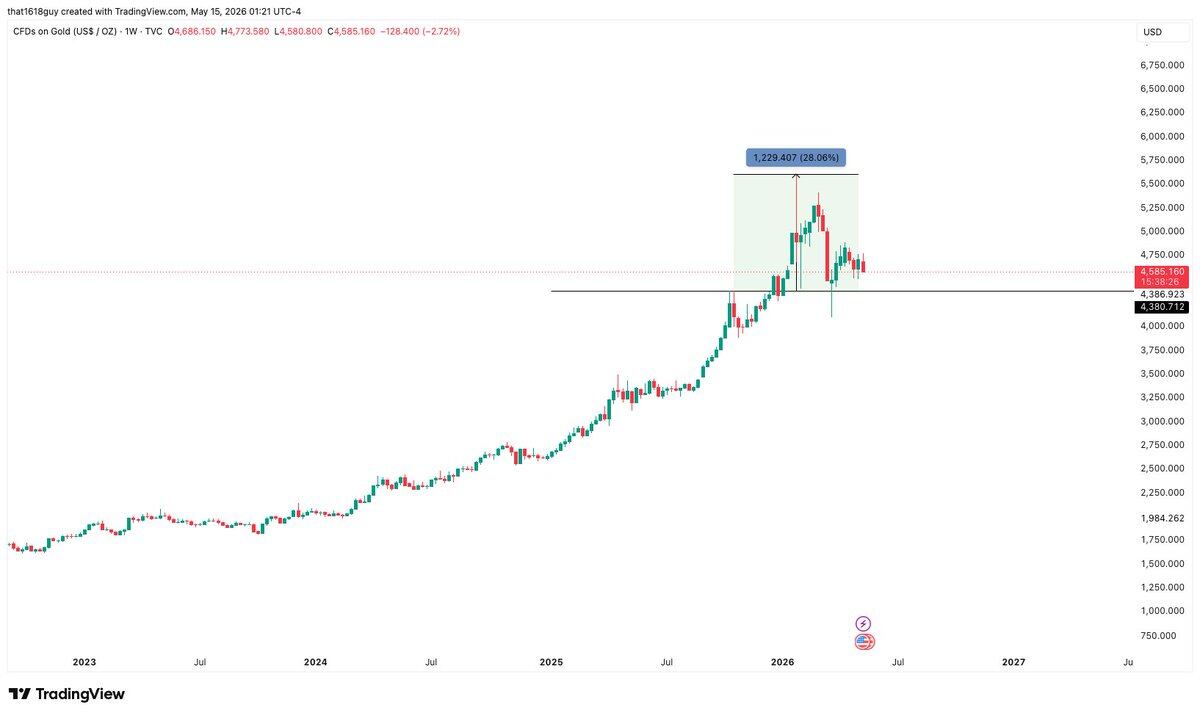
Gold subsequently rallied sharply, reaching an all-time high of $5,589 on January 28, 2026, a gain of over 26% from our forecast point. Gold has now corrected back to around $4,700, a 16% pullback from the high. This reversal was driven by a confluence of three factors:
- In January, Kevin Warsh was nominated for Fed Chair, causing the market to quickly price in a hawkish stance, leading to significant profit-taking after the Gold rally;
- The US-Iran military conflict erupted on February 28th, pushing oil prices above $100/barrel and adding to inflationary pressures. The April US CPI inflation rate rose to 3.8%, a new high since May 2023, dashing hopes for Fed rate cuts. While Gold can hedge multiple risks, a prolonged high-interest-rate environment acts as a significant headwind for this non-yielding asset;
- Rising hawkish expectations in the market led to a rebound in the US Dollar Index, further pressuring Gold prices.
In the annual outlook, we noted that Gold's weekly RSI briefly breached 85, entering an extreme overbought zone rarely seen in modern history. This suggested that short-term upward momentum would inevitably slow, likely leading to a period of consolidation, which closely matches the subsequent price action.
Gold's historic rally is now entering a digestion and adjustment phase, but the underlying structural buying has not collapsed. The short-term weakness is merely temporarily suppressed by adjustments in interest rate expectations and a stronger US Dollar.
Continued Gold Purchases by the People's Bank of China
The views expressed in the annual outlook regarding the People's Bank of China (PBoC) hoarding gold have also fully materialized. The report mentioned that the PBoC is one of the world's largest and most consistent buyers of gold; China's continued accumulation of gold is a key part of its national strategic layout, potentially enabling it to optimize its debt structure through ample gold reserves and build a cross-border RMB settlement system.
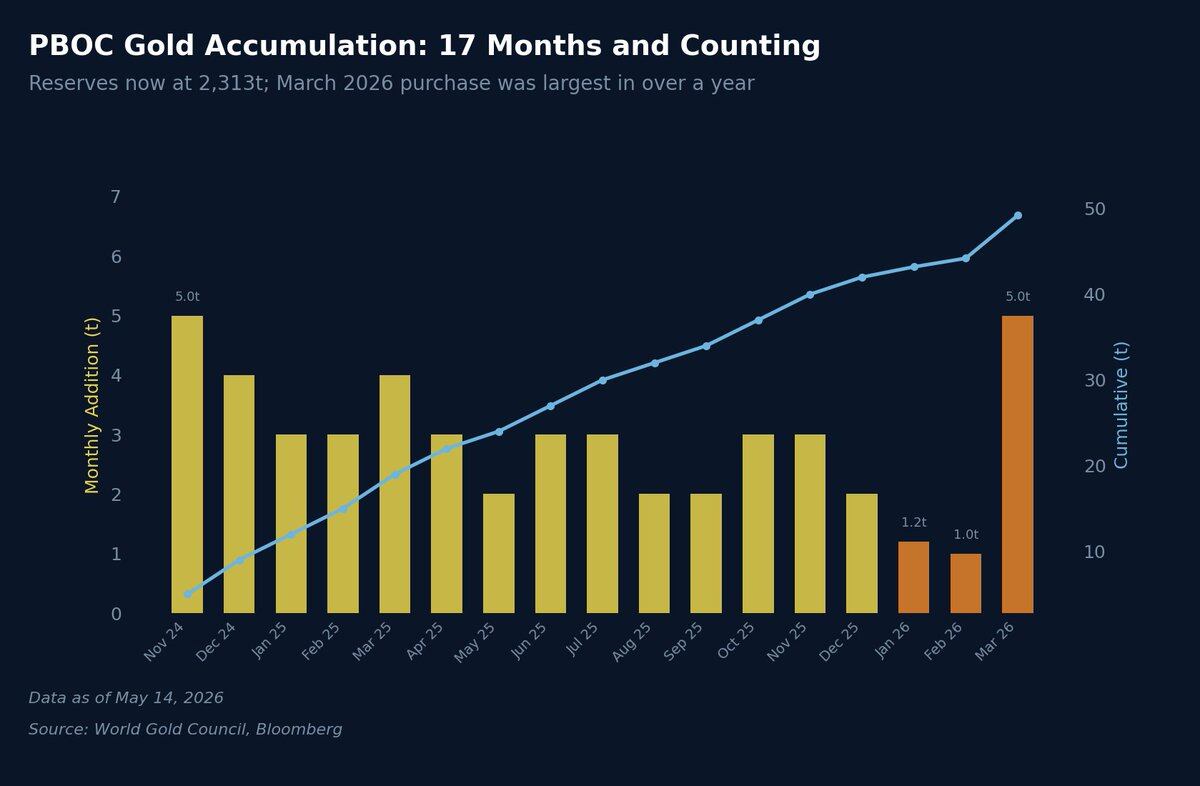
Since the annual report was published, the PBoC has increased its gold reserves for 17 consecutive months, reaching a total official reserve of 2,313 tonnes, accounting for 9.6% of its total foreign exchange reserves (WGC data). Notably, in March 2026 alone, the PBoC added about 5 tonnes of gold, its largest monthly purchase in nearly a year.
Overall global central bank gold buying remains robust. Net central bank purchases in Q1 2026 totaled 244 tonnes, exceeding the previous quarter's volume and the five-year average. While Goldman Sachs had predicted average monthly purchases of 70 tonnes for 2026 (actual pace was slightly slower initially, with the PBoC purchasing only 1 and 1.2 tonnes in Jan-Feb), the increased buying pace in March confirms that central bank purchasing rhythm is dictated by actual market demand, not a gradual phase-out.
The most telling market signal is that the PBoC did not stop buying even as Gold prices stayed above $5,000. Historically, after hitting new highs, central banks often pause purchases or even sell into strength. However, as we predicted, the continued aggressive buying during this sharp rally in Gold prices demonstrates this is a long-term structural allocation, not short-term speculation.
This trend also deeply correlates with the relative strength logic between Bitcoin and Gold. The PBoC's massive, sustained gold purchases are fundamentally a statement about the creditworthiness of the US Dollar. Each tonne of gold purchased represents a tonne of reserve assets moving out of the US Dollar system. The de-dollarization wave continues to accelerate.
Data from the World Gold Council's March 2026 central bank survey shows that the proportion of central banks planning to increase their gold reserves within the year rose from 62% in 2025 to 68%. With short-term headwinds like the Fed's hawkish stance, a stronger Dollar, and market fears of rate hikes pressuring Gold prices, this structural buying from central banks provides a solid floor for Gold prices. This significantly limits Gold's downside potential, meaning further recovery in the Bitcoin/Gold ratio will increasingly depend on Bitcoin attracting capital inflows in its own right – the second scenario.
Review of Year-to-Date Performance for Bitcoin and Gold
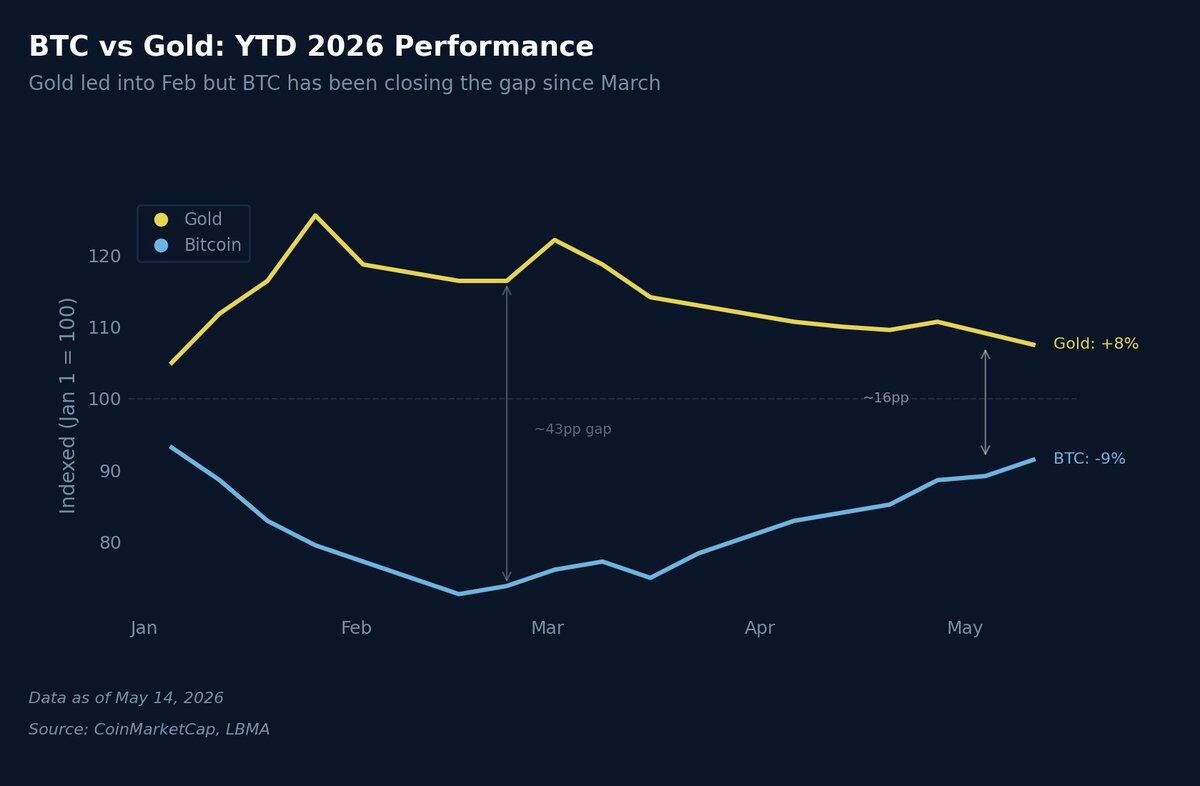
Using January 1, 2026 as the starting point for year-to-date (YTD) performance, the market trend is clear. Gold began the year with a powerful rally, reaching a YTD gain of about 25% by the end of January. During the same period, Bitcoin's YTD loss was approximately 25%, creating extreme divergence between the two assets. This divergence marked the exact point in February where I predicted the ratio would bottom.
Since then, the performance of the two assets has gradually converged: Gold has given back most of its YTD gains, now holding only an 8% increase. Bitcoin, meanwhile, has narrowed its maximum YTD loss from 27% to 9%. The performance gap between the two has narrowed from 50 percentage points to 17 percentage points, directly reflecting the real-time repair of the Bitcoin/Gold ratio.
This convergence has occurred almost entirely due to Gold's weakness, not a strong Bitcoin rally, which has significant implications for asset allocation strategies. The current market narrative is still primarily driven by the first scenario (Gold correction, Bitcoin range-bound). Whether the market can shift to the second scenario (Bitcoin rallying on its own merits) in the second half of the year, or remain stuck in an extended range, is the central market question.
Let me add a relevant historical correlation. Past data suggests that moves in Gold and global broad money supply (M2) typically lead Bitcoin by 3 to 4 months. In mid-2025, Gold started its breakout rally, coinciding with a new peak in global M2 money supply. Following the historical time lag, Bitcoin should have followed higher sometime between late 2025 and early 2026. However, this did not happen; the lag period extended to 5 to 6 months. Such extended lags are not unprecedented. The 2020 pandemic shock also prolonged the correlation cycle, but when the correlation reasserted itself, it was followed by violent market moves. The current US-Iran geopolitical conflict is playing a similar role to the pandemic, creating a new wave of inflationary pressure and directly delaying the Bitcoin rally that the liquidity signals should have triggered.
What Has Changed in the Market Since February?
It's been three months since the previous report, and the market environment has changed substantially. Let's review the initial predictions against reality:
Confirmed Views
- The Bitcoin/Gold ratio bottomed within the predicted range as expected, initiating a recovery driven by a Gold correction;
- The deep corrective action in Gold after its surge has materialized;
- The trend of global central banks increasing their gold holdings has not changed;
- The convergence pace of the weekly 9/21 moving averages aligns well with earlier forecasts.
Unrealized Predictions
Expectations for Fed rate cuts have completely evaporated. In February, my base case was 1 to 2 rate cuts in the second half of 2026, an expectation widely shared by the market. This logic has completely failed. With US CPI inflation at 3.8%, rising Producer Price Index (PPI), oil prices firmly above $100, and the US-Iran conflict persistently fueling supply-side inflation, the market has not only abandoned rate cut hopes entirely but is now pricing in the possibility of a rate hike by year-end. This is the single biggest discrepancy between my previous analysis and the current market reality.
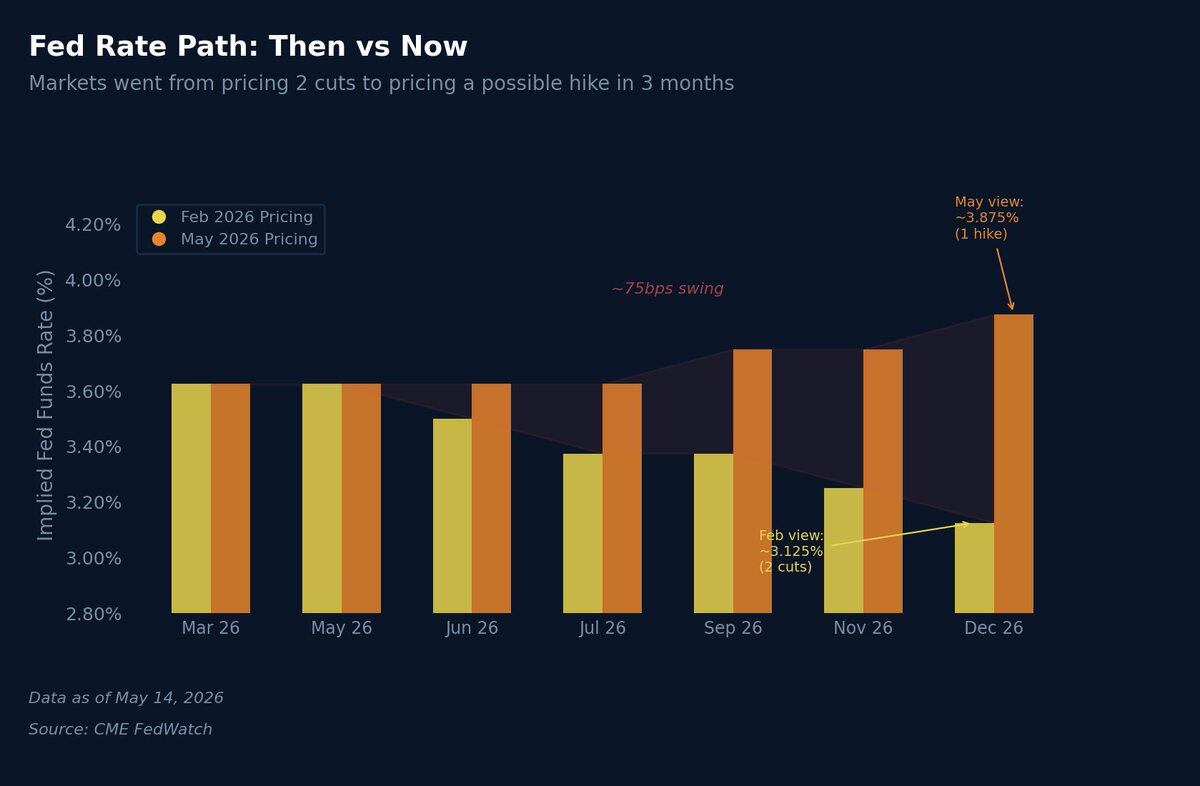
Interest rate market expectations have swung dramatically. In February, the market expected the Fed funds rate to fall to 3.125% by December 2026, implying two rate cuts. Current market pricing now shows rates unchanged or even higher, with the implied rate near 3.875%. In just three months, the change in interest rate expectations amounts to a massive 75 basis points, primarily driven by the energy inflation shock from the geopolitical conflict.
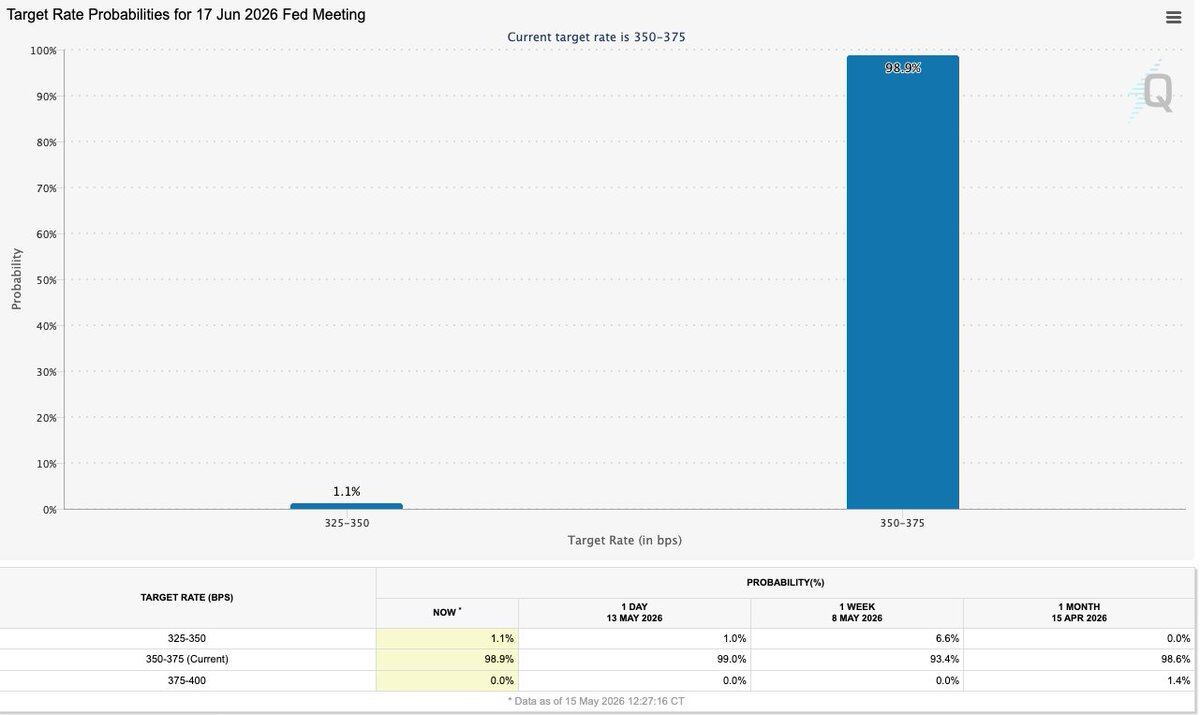
The change in Fed Chairmanship has also shattered the previous dovish expectations. The market originally believed that a post-Powell Chair would lean dovish. Now, Kevin Warsh has officially taken office, and his policy stance appears significantly more hawkish than Powell's. His first FOMC meeting is scheduled for June 16-17, and under his leadership, even with slowing economic growth, a large-scale rate cut cycle is unlikely. This directly alters my previously anticipated narrative for risk asset style rotation in H2 2026. Current market projections estimate the probability of a rate cut at this meeting is practically zero.
However, the previously proposed fiscal dominance market logic remains intact. The US is continuing to push forward with debt monetization through the banking system, with the annual fiscal deficit remaining in the $1.5 trillion to $2 trillion range. Regardless of the Fed's monetary policy stance, the sheer pressure of massive fiscal needs will eventually force the release of more liquidity into the market.
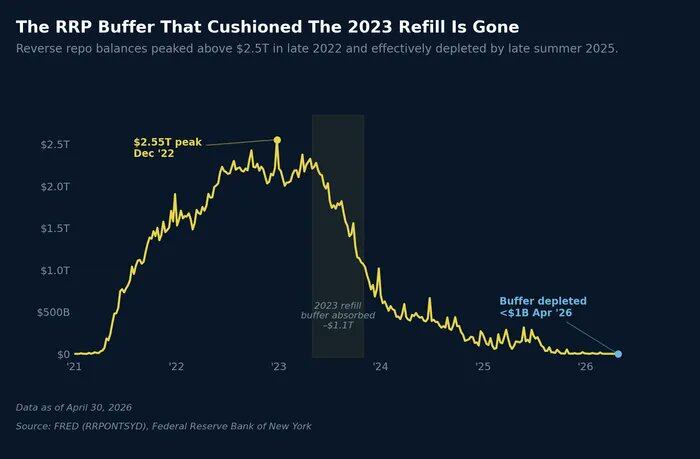
The total US national debt has now exceeded $39 trillion. The Treasury still needs the market to absorb a massive amount of newly issued bonds. Hedge fund basis trades continue to support long-end interest rate markets, and the balance of the overnight reverse repo facility is already at low levels.
Even if Warsh makes tough hawkish statements, the underlying operational framework of the financial system requires liquidity support. The core contradiction to watch in the second half of the year will be the tug-of-war between the Fed's hawkish monetary policy stance and the fiscal side's necessity for loose financial conditions.
Overall Market Outlook for the Second Half of 2026
My core thesis remains unchanged: the Bitcoin/Gold ratio is recovering from historically extreme lows, and the overall trend is positive. The key drivers for the second half of the year are as follows:
Gold Side
Gold's 18% correction from its all-time high has already provided ample room for the ratio to recover. Even if Gold doesn't decline further, merely consolidating sideways to digest its earlier gains would allow the ratio to rise, as Bitcoin's higher price elasticity kicks in upon any positive market signal. Coupled with continued global central bank buying providing a solid floor, Gold's price bottom range is locked in around $4,200 to $4,500. This relative strength narrative does not require a massive crash in Gold prices; it simply needs Gold's uptrend to pause.
Bitcoin Side
Compared to February, the current positioning structure in the Bitcoin market is healthier. Since its rally from the $64,000 low, Bitcoin has steadily climbed to $80,000 over more than


