Earnings “aced the test,” so why did prices still move the other way? Starting with OKX’s two questions


- Core view: Whether earnings meet expectations and whether stock prices rise or fall are two separate issues. What the market trades is not the report card itself, but how earnings change investors’ judgments about future growth, guidance, and valuation; the two can move in the same direction or diverge.
- Key points:
- Netflix’s earnings per share rose about 49% year over year and met expectations, but its full-year advertising revenue forecast was cut from about $3 billion to $2.7 billion, and its perpetual contract fell about 5.30% after earnings.
- Tesla’s revenue was about $28 billion, nearly flat, while operating profit fell about 56% year over year, so passing the earnings test and declining profit occurred at the same time.
- Meta reported GAAP earnings per share of $3.83, or $7.40 excluding litigation expenses; capital expenditure for the quarter was about $34.9 billion, and free cash flow was negative $2.12 billion.
- SpaceX’s revenue was $14.6 billion, up 161% year over year, and net profit was $4.4 billion, turning profitable, with performance and contract prices rising together by 7.65%.
- Among the first 150 two-time winners in OKX’s “Earnings Big Winner,” only 3 reached six consecutive wins, showing that making both earnings and price judgments is extremely difficult.
- Before Google’s earnings, about 62% of users chose “beat expectations,” but GAAP earnings per share of $2.12 missed the $3.10 threshold; the proportion of user choices is not a trading forecast price.
 In the early hours of October 21, Beijing time, Netflix released its third-quarter earnings report, with earnings per share of $0.87. OKX's earnings prediction question settled as Yes, but from the pre-earnings U.S. stock close to the close of the first full trading day after the earnings release, the corresponding perpetual contract fell by about 5.30%. The results cleared the bar—so why did the price still fall?
OKX's "Oracle Season 3" set up two types of predictions during earnings season: one asking whether a company's earnings met a preset threshold, and another asking whether the price rose on the first full trading day after the earnings release. These two seemingly closely related questions do not necessarily yield the same answer. How much a company earned this quarter and how much investors are willing to pay for it need to be examined separately.
Four Companies, Three Combinations
The first-round results for Netflix, SpaceX, Tesla, and Meta are as follows:
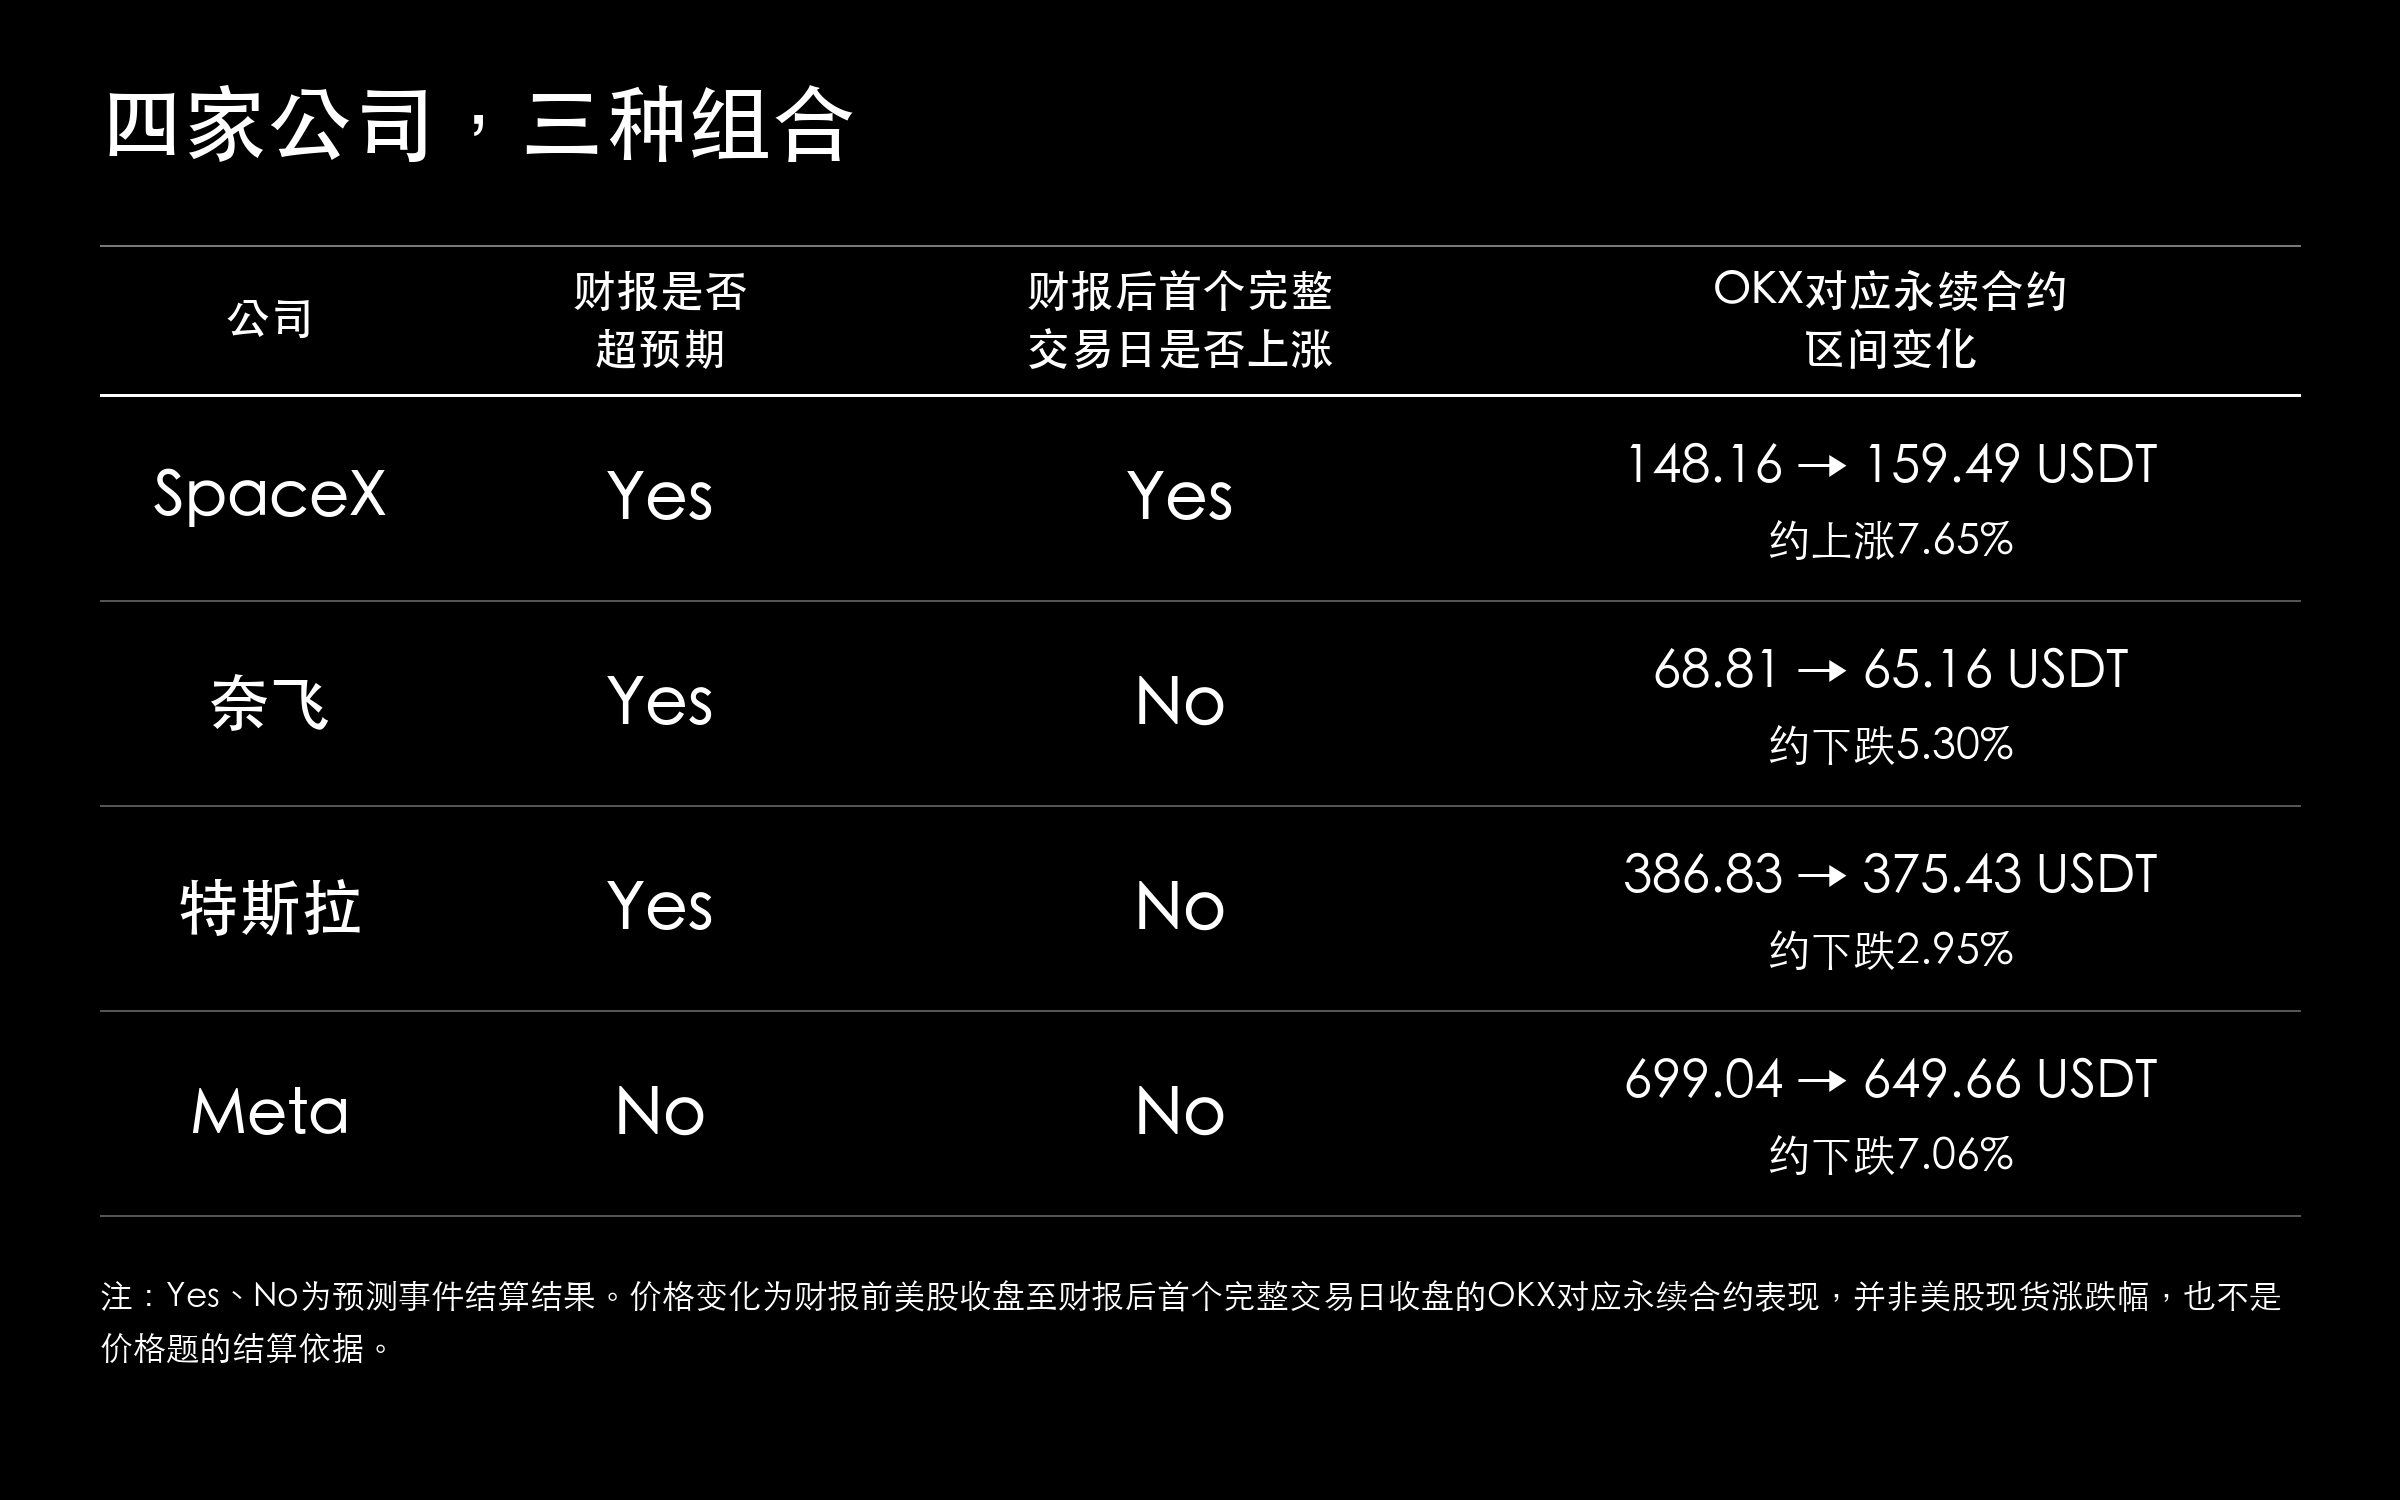
SpaceX saw both its results and contract price rise in the same direction. Quarterly revenue was $14.6 billion, up 161% year-over-year; net profit was $4.4 billion, compared with a loss of about $1.1 billion in the same period last year. However, how much revenue grew and how much the price rose are two different things—the 161% revenue increase cannot be directly used to explain the 7.65% contract gain.
The other three companies' earnings are not so easily summarized as "good" or "bad." Netflix's earnings per share grew about 49% year-over-year, yet it lowered its full-year advertising revenue forecast from about $3 billion to about $2.7 billion; Tesla's quarterly revenue was about $28 billion, nearly flat year-over-year, while operating profit fell about 56% year-over-year; Meta's revenue grew 26%, while also carrying litigation costs and large-scale capital expenditure.
Earnings Cleared the Bar—Why Did the Market Still Fall?
"Beating expectations" in the campaign is settled according to the threshold set in advance by the question. The market's reaction to earnings also depends on what investors had expected beforehand: whether new businesses can continue to grow, whether margins can improve, and whether the company will raise its forward guidance. These expectations cannot necessarily be captured by a single earnings-per-share question.
Two data points from Netflix point to different time horizons: earnings per share growth of about 49% refers to money already earned this quarter; the lowered advertising revenue forecast refers to the possibility that future business may be weaker than previously expected. If investors who bought in earlier were also bullish on advertising growth, then meeting the quarterly profit bar is not enough to dispel that concern. The earnings question can settle as Yes, yet investors still have reason to reassess the price.
Tesla's case is that the question cleared the bar while operating profit declined at the same time. Investors also need to judge whether profit declines will persist when revenue is barely growing, and what kind of earnings performance is needed to support the current valuation. For companies like this, meeting the question's threshold is only part of earnings analysis.
This does not mean that post-earnings declines can all be attributed to "good news already priced in." We also need to look back at how much the stock rose before earnings, whether profit forecasts were raised, and whether valuations became more expensive. Sometimes price increases simply follow the broader sector. Management's explanations on the earnings call and concurrent market changes also affect trading. The advertising outlook and profit pullback provide analytical clues, but determining their impact on the decline requires more information.
Beyond Profit, Look at Investment and Returns
Meta's earnings have another aspect worth examining closely. Under U.S. Generally Accepted Accounting Principles (GAAP), its earnings per share were $3.83; excluding litigation-related expenses, it was $7.40. The campaign settles according to the agreed GAAP basis, but when researching a company, one cannot stop at this answer—one must also see how much of the profit change comes from core operations, how much comes from this expense, and how long the impact will last.
This expense created a significant gap between the two earnings-per-share figures. The campaign can give one answer according to the rules, but investors need to look at both sides simultaneously: earnings excluding the expense help observe operating conditions; the expense recognized under GAAP did indeed affect shareholder returns. It cannot be ignored just because it is a special item, nor can one conclude solely from this expense that core operations will continue to deteriorate.
Meta's capital expenditure for the quarter was about $34.9 billion, with free cash flow of negative $2.12 billion, raising another question: with revenue still growing, how much cash can the company retain? Free cash flow is typically calculated as operating cash flow minus capital expenditure, subject to the company's disclosed methodology. Compared with earnings per share, it more directly reflects the cash situation after completing related investments.
When buying equipment and building data centers, cash must be paid out first, while related costs are typically depreciated gradually over the usage period. This explains why a company, even while still profitable, may face cash flow pressure due to expansion. In Meta's earnings, profit metrics and capital expenditure need to be viewed together—looking only at earnings per share can easily miss the costs required for future growth.
For this investment, what the market will wait for next is the return. If new capacity is used by customers and generates sufficient profit, today's spending could support future growth; if revenue fails to keep up while more capital continues to be added, investors will need to reconsider the valuation. The question left by Meta's earnings will also carry over to companies further down the AI supply chain.
How Do Predictions Help Read the Market?
Putting the two types of predictions together can help observe whether participants' views on earnings and price are consistent. Prediction readings are formed by trading and reflect tendencies at the time—they do not equal the actual probability of an event occurring; user selection ratios and long-term accuracy rates also have their own statistical methodologies. They can suggest research directions but cannot directly prove whether a stock price is expensive or cheap.
If the earnings question clearly leans Yes while the price question is less optimistic, the divergence is worth noting: do participants think the profit threshold is easy to meet but are more worried about forward guidance or investment? Has the prior rally already reflected good news? When both questions lean Yes, one should examine how much room the actual earnings have to exceed existing expectations. When both lean No, one should also consider whether the prior decline has already absorbed some concerns.
When looking at changes in readings, one must also remember when they occurred. The day before earnings, an hour before the release, and during the earnings call—participants have different information at each point. If the earnings question consistently leans Yes while the price question gradually weakens, one can investigate what new information emerged during that period. Views formed only after the earnings release cannot be counted as pre-release predictions.
Recording these changes along with pre-release reasoning gives concrete content to verify after the release. If the earnings question was wrong, one can check operating estimates and accounting methodologies; if the earnings question was right but the price question was wrong, one can check whether the market's reaction to good news was overestimated or whether guidance changes were missed. Even if the direction was correct, one must distinguish whether the company's performance met expectations or the price merely followed the sector upward. Only through such review can one avoid finding only bright spots after rallies and only problems after declines.
If the analysis is used for real trading, one must also separately consider entry price, potential gains and losses, as well as costs and leverage. A higher probability of rising may still mean only a small gain; once it falls, losses could be larger. Therefore, even after getting the direction right, position sizing and exit conditions still need to be arranged.
The Winning Streak Test of "Earnings Big Winner"
OKX's "Earnings Big Winner" campaign strings earnings questions and price questions into consecutive challenges. The first round had over 700 participants; among the first round's 150 two-win streak players, only 3 ultimately reached a six-win streak. All three stopped at the same round and split the 10,000 USDT reward. The list shortened round by round, giving the campaign spectator suspense, but this set of streak results is not enough to demonstrate how accurate prediction markets are over the long term.
The second round gave participants one revival opportunity: by posting within the specified time with a position card and views according to the rules, they could apply for revival. However, getting two or more questions wrong on the same day, or getting another one wrong after revival, meant elimination from further advancement. Both earnings questions and price questions must be completed—participants cannot pick only the category they are more confident about.
In the second round, both Robinhood and SK Hynix had earnings questions settle as No, but their price questions differed. Robinhood's GAAP earnings per share were $0.51, falling short of the requirement of "strictly above $0.56"; although adjusted earnings per share were $0.60, the campaign still settled according to the specified methodology. Robinhood's price question also settled as No, while SK Hynix's price question settled as Yes. Both failed the earnings question, yet prices moved in different directions.
Google's results also differed from many participants' choices. Before earnings, OKX Chinese disclosed that about 62% of users chose "beat expectations"; Alphabet ultimately reported GAAP earnings per share of $2.12, falling short of the question's requirement of "strictly above $3.10." Google Cloud growth and whether the group's earnings per share cleared the bar are two different things. Additionally, the 62% here is a statistic of user selection ratios, not prediction prices formed by trading, and cannot be used to judge why each participant chose Yes.
Questions from different companies appearing in succession also make winning streaks increasingly difficult. Streaming media requires watching advertising growth, trading platforms require watching customer activity, and memory chips require watching demand and prices; these operational details must ultimately map onto each question's specific methodology. Participants need to switch research focus in a short time and then make choices about post-earnings market reactions.
According to the October 30 battle report, 3 advancing participants in the second round completed a "seven-in-a-row," but all revival opportunities have been used up. There are still 5 more first-day post-earnings price direction predictions remaining, and the three are not yet final winners. Even if they correctly read earnings before, they still need to judge how the market will react next—and there is no longer any margin for error.
What to Watch in Upcoming Earnings?
In upcoming earnings, the AI supply chain is still worth examining as a whole. Microsoft, Alphabet, and Amazon's cloud businesses and capital expenditure can help understand upstream demand. For cloud platforms, buying equipment is an investment; for chip, memory, and optical communications suppliers, it can become orders. The investment-return question left by Meta can be traced further down this chain.
Cloud platforms need to watch whether customer usage and revenue can keep up with investment; suppliers need to watch whether orders can be delivered on schedule and how much profit and cash remain in the end. For chip and memory companies, revenue growth also needs to be broken down into whether they sold more, raised prices, or increased the share of high-value products. Optical communications, computing infrastructure, and energy companies need even more comparison between delivery progress and capital investment.
Spending money, receiving orders, delivering goods, recognizing revenue, and collecting payment often do not occur in the same quarter. Only by connecting upstream and downstream data can one more easily see whether growth can be sustained, and also explain why companies benefiting equally from AI still show differences in earnings and price performance.
Another group worth comparing is Coinbase, Circle, and Strategy. They respectively involve trading, stablecoin business, and digital asset prices, and the impact of market activity differs for each. When reading earnings, one must distinguish which growth comes from business expansion and which is merely driven by market prices at the time. Interest rates and risk appetite are shared background conditions, but for each individual company, one still needs to look at its own revenue and balance sheet.
Therefore, what is worth comparing in subsequent earnings is not just which companies exceeded profit thresholds, but also whether revenue growth brought profit and cash. If several data points move in different directions, continue to investigate where growth comes from, where costs increased, and then see whether they have changed previous valuations of the company.
Summary
From Netflix's "earnings cleared the bar, price fell" to the two different combinations produced by Robinhood and SK Hynix, these cases repeatedly point to the same question: what the market trades is not a report card, but how the report card changes judgments about the future. Prediction events give one of those judgments a clear threshold; stock prices continue to absorb changes in growth guidance, valuation, cost of capital, and risk appetite. The two can move in the same direction, or they can move in opposite directions.
Therefore, the trading reference value of predictions does not lie in providing a direction that is certain to profit, but in forcing participants to separately judge "how earnings will turn out" and "how the market will react," and to verify each item after results come out. As more companies report and industries become more dispersed, this distinction becomes more important: first understand the question and the data, then identify the expectations already embedded in the price, and finally observe how new information changes the market. What can persist is not just a string of Yes or No answers, but a judgment method that can withstand scrutiny and allow for correction.