


Deep Dive into Anthropic's S-1 Filing: Soaring Revenue, Massive Losses, and the Truth Behind AI Compute Costs


Overview
Anthropic publicly filed its S-1 registration statement with the U.S. Securities and Exchange Commission on October 26, 2026, intending to list on the Nasdaq Global Select Market under the ticker ANT. Neither the number of shares to be offered nor the price range has been determined.
The filing discloses a net loss of $80.748 billion for the first half of 2026, against revenue of $16.286 billion over the same period—a loss nearly five times revenue. That ratio looks anomalous, but the breakdown makes the reason clear: operating loss was only $693 million, while $72.388 billion of the net loss came from fair value changes on convertible notes, derivative liabilities, and SAFEs—non-cash items. Cash flow from operating activities was positive $3.929 billion for the period, compared with negative $1.513 billion a year earlier.
In other words, the company was near breakeven at the operating level and generated net cash inflow in the first half, while the enormous net loss mainly records something unrelated to operations: rising company valuation pushed up the carrying value of liabilities tied to early convertible instruments.
The risk truly worth watching is not the net loss figure, but the comparison between compute procurement commitments and cash reserves—and an easily overlooked detail: the total procurement commitment line in the public version of the S-1 is blank, and the widely cited total did not come from that table. This article breaks down the filing line by line according to the original text.

Key Points
Of the $80.748 billion net loss, $72.388 billion came from non-cash fair value changes. The filing attributes this to an increase in the fair value of outstanding convertible promissory notes.
Operating loss was only $693 million, narrowing from $2.135 billion a year earlier. Operating income turned positive in Q2 2026 at $974 million, the first positive quarter among the six quarters listed in the filing.
Cash flow from operating activities was positive $3.929 billion. It was negative $1.513 billion a year earlier and negative $2.637 billion for full-year 2025.
First-half revenue was $16.286 billion, fourteen times the $1.163 billion of a year earlier. Q2 alone, at $11.555 billion, exceeded the roughly $5.01 billion combined across 2023 through 2025.
Compute and infrastructure spending as a share of revenue fell from 201% to 55%. The absolute amount rose from $2.334 billion to $8.945 billion, but grew more slowly than revenue.
The total procurement commitment in the public S-1 is blank. The roughly $637 billion circulating in the market is a third-party sum of individual contracts, not a total given in the filing.
Customer concentration is disclosed, but no single customer exceeds 10%. For the nine months ended September 30, 2026, the top five customers accounted for about 25% of revenue.
What the Public Filing Confirms
Compared with the earlier confidential submission, the biggest change in the public filing is that the financial statements have gone from media paraphrase to an original document that can be checked line by line.
Confirmed items include the Nasdaq Global Select Market as the listing venue, ANT as the ticker, Anthropic, PBC as the issuer, and Goldman Sachs and Morgan Stanley as the contact underwriters for the prospectus. The registration statement has not yet become effective, and the securities may not be sold before it does.
Items still undetermined include the number of shares to be offered, the price range, total proceeds, the split between primary shares sold by the company and secondary shares sold by shareholders, and the effective date.
Before this, a piece on this site summarized compute buildout commitments and the supplier landscape based on Reuters reporting on the confidential version, citing full-year 2025 data at the time—revenue of about $4.585 billion, operating loss of about $8.060 billion, and net loss of about $41.965 billion. The public filing confirms those magnitudes and adds first-half 2026 data, and the first-half trajectory is quite different from full-year 2025.
Five-Year Revenue and Loss Trajectory
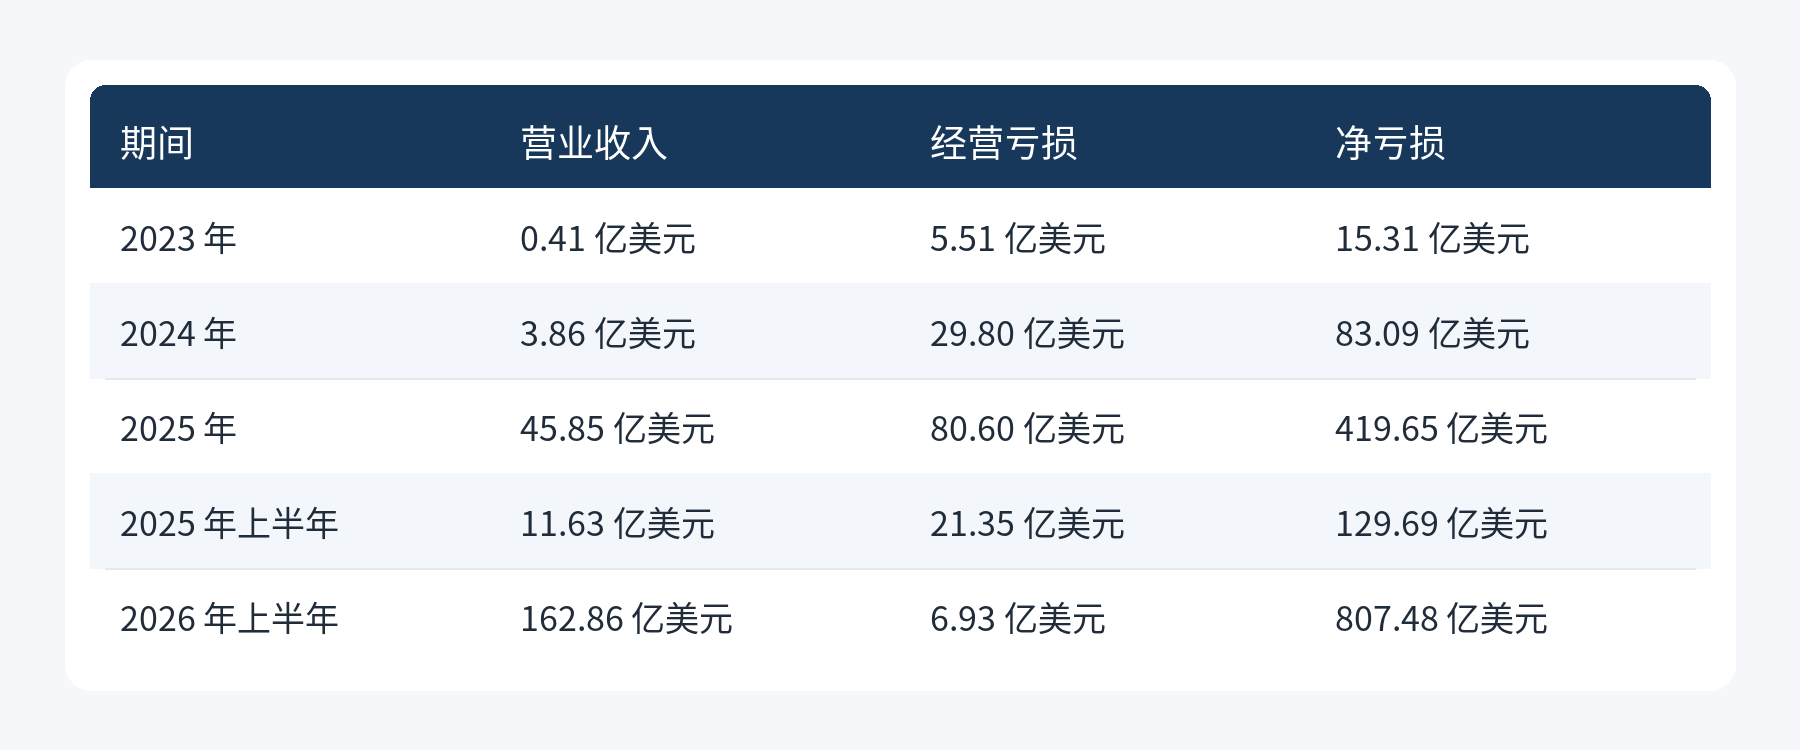
This table contains all the contradictions this article sets out to explain: revenue grew from $41 million in 2023 to $16.286 billion in the first half of 2026; operating loss peaked at $8.060 billion in 2025 before narrowing to $693 million in the first half of 2026; yet net loss expanded in tandem to $80.748 billion. Operating metrics are improving while net loss is worsening, and the two are driven by different factors.
Revenue and Customer Structure
Of the $16.286 billion in first-half revenue, usage-based billing accounted for about $13.1 billion, or 80%, and subscriptions for about $3.2 billion, or 20%. The split was 75% to 25% in 2024 and 83% to 17% in 2025.
The quarterly growth is even steeper. Revenue across the four quarters of 2025 was $376 million, $787 million, $1.382 billion, and $2.040 billion, respectively; Q1 2026 was $4.731 billion and Q2 was $11.555 billion. Q2 grew about 1,368% year over year, while compute and infrastructure spending over the same period grew about 300%.
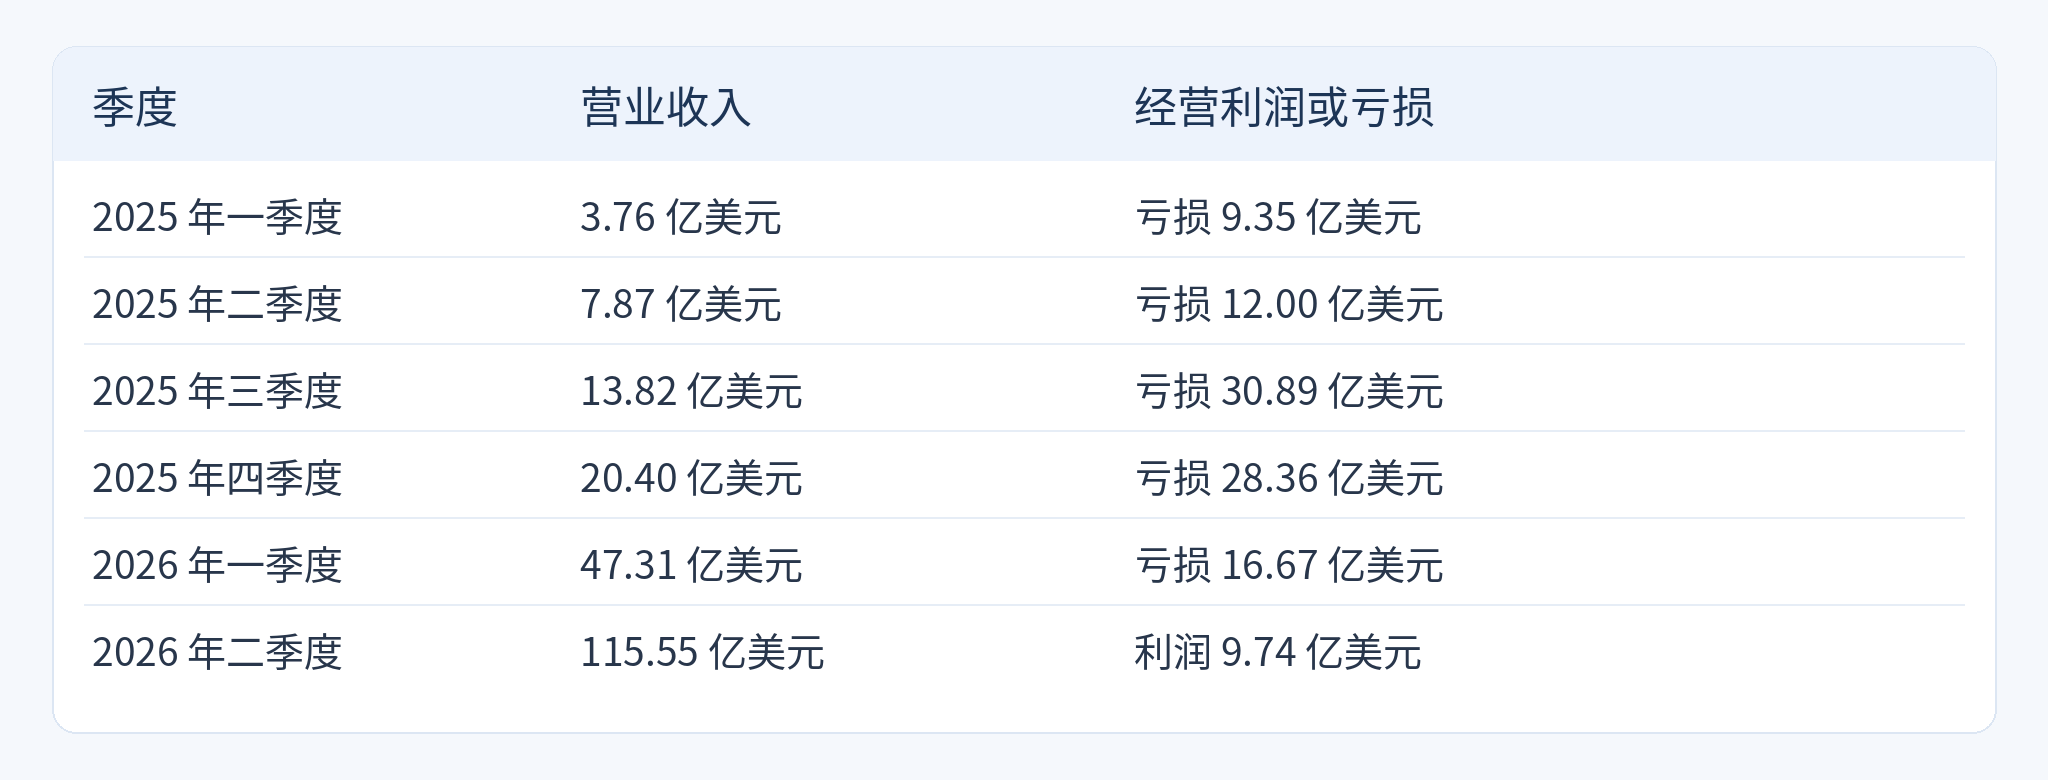
The turn to positive operating income in Q2 is the information in this filing most easily overshadowed by the $80.7 billion figure.
Customer Structure
For the trailing twelve months ended September 30, 2026, more than 11,900 customers contributed more than $100,000 in revenue, up from more than 950 a year earlier; more than 1,900 contributed more than $1 million; and about 250 contributed more than $10 million. Net revenue retention over the same period was about 900%.
On concentration, for the nine months ended September 30, 2026, the top five customers accounted for about 25% of revenue, and no single customer exceeded 10%. The filing's risk factor summary also cautions that "a substantial portion of our revenue and accounts receivable is driven by a limited number of customers and distribution channels," but it does not give more granular percentages.
The distribution channel itself is also a structural dependency. The filing states that Claude is made available through Amazon Web Services, Google Cloud, and Microsoft Azure under a co-marketing model, with fees paid to each cloud provider. These three are also the main counterparties to the compute commitments discussed below.
Based on billing address, international revenue in the first half was about $4.523 billion, or about 28%.
What the Three Different "Losses" Each Say
The same company in the same period can have three "loss" figures pointing in different directions. This is not a contradiction; the three metrics answer three different questions.

The bridge from operating loss to net loss can be checked item by item. Operating loss of $693 million, plus interest income of $1.111 billion, minus $72.388 billion of fair value changes on convertible notes, derivative liabilities, and SAFEs, minus $8.757 billion of other expense, net, and minus $21 million of income tax, yields a net loss of $80.748 billion.
The key here is the $72.388 billion line. Convertible notes, derivative liabilities, and SAFEs are measured at fair value; when the company's valuation rises, the equity value these instruments could convert into in the future rises, and the corresponding carrying value of the liability rises as well, with the difference recorded as a current-period loss. The filing explicitly attributes this change to an increase in the fair value of outstanding convertible promissory notes.
The economic meaning of this loss is therefore the opposite of a loss in the usual sense: it is an accounting result of rising company value, and the value created belongs to early investors. Such losses do not consume cash and typically do not recur after the instruments convert to common stock at IPO. Historical data confirm that it scales with valuation: the item grew from $1.045 billion in 2023 to $5.434 billion in 2024, $34.308 billion in 2025, and then $72.388 billion in the first half of 2026.
On cash flow, first-half net cash provided by operating activities was $3.929 billion, and purchases of property and equipment were $482 million, implying free cash flow of about $3.447 billion. It should be noted that reports have indicated the company attributes part of the improvement in operating cash flow to payment timing factors, so a single half-year of cash flow should not be annualized directly.
As of June 30, 2026, cash and cash equivalents were $112.4 billion and short-term investments were $19.3 billion, for a combined $131.651 billion. Net cash provided by financing activities in the first half was about $110.8 billion, mainly from redeemable convertible preferred stock.
There is also a data point not among the three metrics above but relevant to future statements: first-half personnel costs were $3.152 billion, including about $2.2 billion of stock-based compensation expense, while unrecognized restricted stock unit expense as of June 30 was $26.6 billion. This expense will flow into the income statement over future periods; while it likewise does not consume cash, it will affect future GAAP profit.
The company also discloses non-GAAP adjusted operating income, which was positive $1.618 billion in the first half, with adjustments including stock-based compensation, non-cash charitable donations, and the Bartz case settlement. Non-GAAP metrics are defined by the company itself and are not directly comparable with peers.
Compute Procurement Commitments: Why the Reported Totals Differ
This is the section that requires the most caution, because the most widely circulated figure is precisely the one not given in the filing.
One passage in the public S-1's risk factors describes procurement commitments and lease agreements, and the amount positions in the original text are blank. The total commitment amount, the amount expected to be incurred before December 31, 2030, and the amount due within the next twelve months are all blank; the text states only that the vast majority relates to compute and infrastructure, and that the vast majority of the remainder is expected to be incurred between 2031 and 2045. The passage directs readers to the "Contractual Obligations" section of Management's Discussion and Analysis.
The several totals circulating in the market therefore need to be sourced separately.

Third-party itemized contract amounts include about $161.2 billion for Broadcom TPU equipment leases (five-year rent, excluding interest), up to $120.5 billion for SpaceXAI's Nvidia GPUs (through 2029), at least about $114.5 billion for Google Cloud (April 2026 to July 2033), at least $110 billion for AWS (May 2026 to April 2036), at least about $44.9 billion for Microsoft Azure (November 2026 to May 2033), up to about $44.6 billion for Nscale (through 2033), and about $41.3 billion for Lambda (through 2034). There are also items without fixed amounts, including an estimated $125 billion to $150 billion of additional TPU capacity and more than $20 billion expected for AMD systems.
These amounts are not of the same nature. The Broadcom, Google, Amazon, and Microsoft portions are minimum spend or rent obligations totaling about $431 billion; the SpaceXAI, Nscale, and Lambda portions are labeled "up to" or billed on delivery, totaling about $206 billion. The former must be paid; the latter depend on actual procurement, and adding the two categories together overstates the certain obligations.
Against $131.651 billion in cash and short-term investments, the certain obligations are significantly larger in magnitude, and their time horizon extends to 2045. This is the substantive content of the filing's risk factors and the item in this company's financial structure most worth tracking. Judging sustainability requires watching whether revenue growth in subsequent quarters continues to outpace compute spending growth; in the first half, that comparison was favorable: compute and infrastructure spending fell from 201% of revenue a year earlier to 55%.
Items Still to Be Confirmed
As of the verification date of this article, October 27, 2026, the following items remain undetermined, and any valuation-based calculation should be treated as an assumption rather than a conclusion.
The number of shares to be offered, the price range, and total proceeds are not given in the filing, nor is the split between primary and secondary shares disclosed. The registration statement has not yet become effective. Reports suggest the investor roadshow could begin as early as the week of November 9, but the timetable has not been confirmed by the company.
On valuation, the filing itself does not provide one. Circulating figures come from media reports, including a private financing round in May 2026 at a valuation of about $965 billion (CNBC) and an IPO valuation expectation of more than $2 trillion (NBC News). These are third-party reports rather than filing disclosures and should not be conflated with filing data.
The filing also lists several pending matters, including a Federal Trade Commission investigation, a pending petition for en banc rehearing, and uncertainties over whether contractual liability caps will hold and whether insurance covers agent-related liabilities.
Readers interested in pre-market trading should be clear about the nature of the product: pre-market perpetual contracts are not stock, holders do not receive shares, voting rights, or dividends, and pricing uses a custom index rather than actual market trades. For several routes to pre-IPO participation and their respective limitations, see this site's comparison of three routes.
On MEXC, view the index composition, leverage tiers, and contract rules for the ANTHROPIC pre-market perpetual contract; before placing an order, please confirm the conversion terms and risk limits applicable to the contract in a listing scenario.
James Mitchell's Exclusive View
In James Mitchell's view, the numbers from this filing most worth putting into an analysis are not the $80.7 billion but the $693 million and the positive $3.929 billion, both of which are completely overshadowed by the former.
Of the $80.748 billion net loss, $72.388 billion came from fair value remeasurement of convertible notes, derivative liabilities, and SAFEs, which the filing explicitly attributes to an increase in the fair value of outstanding convertible promissory notes. The mechanism generating such losses is worth thinking through: the more valuable the company, the more equity the early convertible instruments can convert into, the higher the carrying value of the corresponding liability, and the larger the current-period loss. In other words, this loss is the accounting result of a rising valuation, not money spent. It does not consume cash, and it typically ceases to appear once the instruments convert after the IPO. Treating it as evidence of operational failure is the most common misreading of this statement.
What really matters is the simultaneous improvement in three figures. Operating loss narrowed from $2.135 billion a year earlier to $693 million; Q2 operating income turned positive at $974 million, the first time among the six quarters listed in the filing; and operating cash flow swung from negative $1.513 billion to positive $3.929 billion. The best indicator of unit economics is compute and infrastructure spending as a share of revenue, which fell from 201% a year earlier to 55%, meaning revenue growth is significantly outpacing compute spending growth. Together, these paint a picture far more complex than "huge loss."
But I do not think this filing can be read as an optimistic conclusion; there are three risks whose magnitude is enough to change the judgment.
The first is the comparison between procurement commitments and cash. Even counting only certain obligations such as minimum spend and rent, the third-party total is on the order of $431 billion, against $131.651 billion in cash and short-term investments, with a time horizon extending to 2045. Such obligations do not shrink when revenue declines—that is precisely the fundamental difference from variable costs.
The second is the $26.6 billion of unrecognized stock-based compensation expense. It does not consume cash, but it will continue to depress GAAP profit in future periods, and the company's adjusted operating income excludes it. Readers comparing "adjusted" figures need to know what is being excluded.
The third is distribution dependency. Claude is distributed through Amazon





