How Hard Can a Bitcoin Bull Market Drop? A Review of BTC's Major Bull Market Corrections and Maximum Drawdowns


- Core View: Bitcoin is approximately 31.5% below its all-time high and about 48% above its yearly low. A 30%-level drawdown is normal during an uptrend, but the same price structure can appear both in the middle of a cycle and in a rebound from the top, so a single drawdown figure cannot distinguish between the two. Cross-validation using capital flows, on-chain data, and macroeconomic conditions is needed.
- Key Elements:
- BTC is trading at about $86,121, roughly 31.5% below its all-time high of $126,198 set on October 6, 2025, and about 48% above its low of $58,035 on June 25.
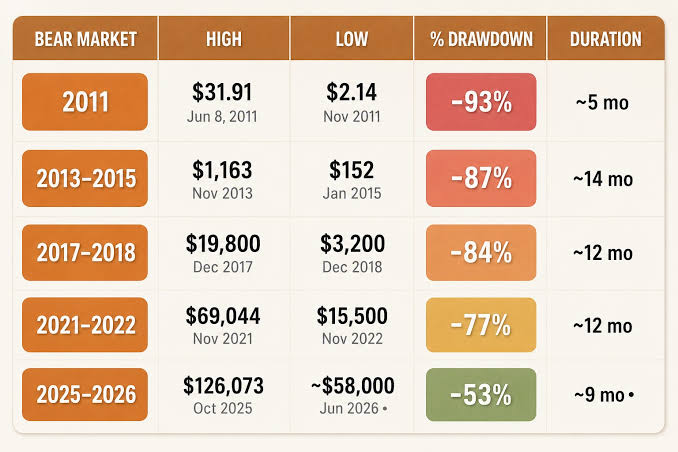
- The peak-to-trough decline in this cycle is about 54%, significantly lower than the 87%, 84%, and 77% seen in the previous three cycles, showing a trend of narrowing drawdowns.
- After the ETF launch in 2024, a drawdown of more than 30% lasted 147 days, while the tariff shock drawdown in 2025 lasted 77 days. The time cost has not shortened in tandem.
- U.S. spot Bitcoin ETFs have seen cumulative net inflows of about $4.6 billion since August 19, turning full-year 2026 net inflows positive at about $320 million.
- The Federal Reserve's next FOMC meeting is scheduled for October 27-28. The interest rate path and the direction of ETF fund flows are key variables to watch going forward.
- The time required to recover all-time highs varies widely: the 2013 high took about 1,200 days, while the 2021 high was surpassed in less than 850 days.
Bitcoin's price returned above $86,000 on October 5. According to Yahoo Finance's market report that day, BTC traded at about $86,121, up 2.4% over the past week and 8.6% over the past month, but still down 29.3% year-over-year. The same report confirmed that Bitcoin's all-time high was $126,198.07 on October 6, 2025. In other words, the price has rebounded significantly from its yearly low, yet remains roughly 30% below its all-time high.
This is precisely the point at which questions like "how much more can it fall after rising" start to matter more than price targets. According to newhedge's all-time-high drawdown data, BTC is about 31.5% below its October 6, 2025 high. And according to investinglive's intraday record on June 30, the 2026 low occurred on June 25 at $58,035, the lowest level since September 2024. From that low to the current price, the gain is already close to 50%. The value of historical records lies not in predicting the next high, but in telling holders: within a cycle where an uptrend holds, drawdowns on the order of 30% are normal, drawdowns on the order of 50% have also occurred, and the differences in duration and recovery time are far greater than the differences in magnitude.
Key Takeaways
The current position sits between two extremes. The price is about 30% below its all-time high and nearly 50% above its June low. Historically, this structure has appeared both midway through uptrends and during rebound phases after cycle tops, and drawdown magnitude alone cannot distinguish between the two.
A 30% drawdown is a routine cost of an uptrend. CoinDesk's analysis on January 10 noted that during this rally there were at least two mid-cycle drawdowns exceeding 30%, one occurring after the spot ETF launch in January 2024 and lasting 147 days, and another triggered by tariff shocks that lasted 77 days.
A 50% drawdown also has precedent. After prices fell more than 50% in April 2013, a new high was still set in November of that year; when BTC fell below $30,000 in June 2021, the price was less than half of the new high reached in November of the same year.
The maximum decline in this cycle has clearly converged. According to the four-year cycle data compiled by Bitcoin.com, the peak-to-trough declines in the first three cycles were approximately 87%, 84%, and 77%, while this cycle's decline from the $126,200 high to the June low was about 54%.
Recovery time is harder to predict than the decline itself. Blockworks' statistics show that the 2013 high took 1,200 days to be reclaimed, while the $69,000 high of November 2021 was broken in less than 850 days.
Two time windows are worth marking. The Federal Reserve's next policy meeting is scheduled for October 27-28, and ETF flows only turned from net outflows to net inflows in late August. Whether that direction continues will determine the funding base of this rebound.
After a Nearly 50% Rebound, What Holders Are Really Asking
Price structure: 30% below the high, 50% above the low
The 2026 price action has demonstrated extremes in both directions. SoFi's compilation of Bitcoin's price history records that the January high was $97,860, the February low was $60,074, and then the June 25 low of $58,035 marked a new low for the year. From $58,035 to $86,121 on October 5, the gain was about 48%, but the price remains below the $126,198 all-time high.
This position itself carries dual interpretations. If viewed as a deep correction in the middle of a cycle, the current rebound is a trend repair; if viewed as a rebound after a top, the same price structure leads to a completely different conclusion. Drawdown data alone cannot answer this question, but it can define a reasonable range of volatility, which is where risk management becomes genuinely useful. For a framework on judging cycle position, see our systematic overview of Bitcoin market cycles, and the approach of using MVRV and realized price to assess valuation levels.
Repricing of macro conditions and funding flows
The trigger for this rebound can be traced back to rate expectations. In its September 16 policy implementation note, the Federal Reserve confirmed that the target range for the federal funds rate was raised to 3.75% to 4%, and the interest rate on reserve balances was raised to 3.90%. According to CNBC, this was the Fed's first rate hike since July 2023, passed unanimously with 12 votes. The subsequently released September nonfarm payrolls data showed only 29,000 new jobs, and market bets on further rate hikes quickly faded. The aforementioned Yahoo Finance market report noted that the probability of rates remaining unchanged rose from 29.1% to 80.6% within a week.
The shift in funding flows occurred during the same period. According to Bitcoin.com's statistics on ETF flows, U.S. spot Bitcoin ETFs have seen cumulative net inflows of about $4.6 billion since August 19, offsetting redemptions from the first half of the year and turning 2026 full-year net flows positive at about $320 million. Since ETFs have become the main channel for incremental capital, directional changes in their flows often precede changes in price structure. This type of data can be continuously monitored through the Bitcoin ETF Flow Tracker.
How Deep Are Drawdowns Within a Bull Market?
2013: A halving in a year that ended higher
2013 is the earliest fully documented case. SoFi's price history shows that Bitcoin started that year at about $13, approached $250 in April, then fell more than 50%, but still surged to about $1,193 in November-December of the same year. Measured on an annual basis, it was a year of dozens of times gains; measured by holding experience, the interim drawdown was enough to liquidate any leveraged position.
2017: A 20x rally repeatedly interrupted
SoFi's records also show that in 2017, Bitcoin started at about $960, rose about 20x in less than 12 months, and approached $20,000 by year-end. This rally was not one-directional. When Chinese regulators pushed trading platforms to cease services in September of that year, Bloomberg's report at the time described the price reaction as "crashing again." Regulatory shocks, exchange disruptions, and fork disputes repeatedly occurred in the same year, each sufficient to turn market sentiment pessimistic at the time, but none ended the annual trend.
2021: A new high after falling below $30,000
2021 provides the closest example of "a new high after a halving." According to Al Jazeera's report on June 22, amid China's continued tightening of mining and trading regulation, BTC fell below $30,000. Per SoFi's records, the price then climbed above $68,500 in November of the same year, meaning the June low was less than half of the year-end high. For holders who exited in June, that drawdown was the end of the cycle; for those who stayed in the trend, it was merely a costly mid-journey bump.
2024 to 2025: Converging magnitude, lengthening duration
After entering a phase dominated by institutional capital, the shape of drawdowns changed. Data compiled in the aforementioned CoinDesk analysis shows that the drawdown after the spot ETF launch in January 2024 exceeded 30% and lasted 147 days; the drawdown triggered by tariff policy in 2025 also exceeded 30% and lasted 77 days. The same analysis noted that the drawdown in early 2026 reached 36% in about 95 days, while the declines in the first 90 days after cycle tops in 2021, 2017, and 2014 were approximately 51%, 70%, and 71%, respectively. Magnitudes are converging, but durations have not shortened accordingly, meaning the source of suffering has shifted from price depth to length of time.
Duration and Recovery Time Are Often Harder to Bear Than the Decline
The time cost of drawdowns
Putting the aforementioned data together, mid-cycle drawdowns exceeding 30% lasting 77 to 147 days are not uncommon. This period is long enough to break position management, because most investors' psychological tolerance is shorter than three months. The problem with leveraged positions is more direct: during the market turmoil of October 10-11, 2025, CoinJar's post-event review recorded that over $19 billion in leveraged positions were liquidated within 24 hours, involving more than 1.6 million traders, while the Bitcoin price itself only fell from about $125,000 to about $115,000 by October 13. The price moved less than 10%, yet liquidations hit a record, showing that risk often comes from position structure rather than price itself. Practical indicators for monitoring this type of risk include funding rates and open interest, as well as the options expiry calendar.
How long does it take to reclaim the high?
Blockworks' statistics provide another dimension of reference. The high of about $1,240 in November 2013 was not reclaimed until April 2017, taking about 1,200 days; while the $69,000 high of November 2021 was broken in less than 850 days, the fastest in recent cycles. The acceleration in recovery speed is usually attributed to changes in capital structure, but the range itself suggests a fact: even if the trend eventually recovers, the waiting period may be measured in years.
When drawdowns occur, the market doesn't give people time to hesitate. Track every move in the BTC/USDT spot market
Why This Round Is Shallower, and the Boundaries of That Judgment
The compression of declines is an observable fact
Cycle data compiled by Bitcoin.com shows peak-to-trough declines converging from about 87% to 84%, 77%, and about 54% this cycle. Within the uptrend phase, Glassnode's on-chain weekly report noted in October 2024 that the maximum drawdown within the then-current cycle was 26% on a closing-price basis, shallower than in previous bull phases. Sustained buying through the ETF channel, more mature market-making structures, and improved pricing efficiency between spot and derivatives are typically cited as the sources of this compression.
Whether the four-year cycle still holds is disputed
This is precisely where the market's biggest disagreement lies. Fidelity Digital Assets, in its research on the four-year cycle, argues that the explanatory power of the traditional four-year cycle has declined, that 80% drawdowns may become a thing of the past, and that Bitcoin's price behavior is shifting toward the gradual rises and falls of a more mature asset. On the other hand, according to Cointelegraph's report in August 2025, Glassnode at the time believed price behavior was still echoing previous cycle rhythms, and if extrapolated according to historical patterns, the cycle high could appear as early as October of that year—and the actual high did indeed fall on October 6, 2025.
As for the nature of this downturn, according to a recent Glassnode report cited by ChainCatcher, as of September 23, Bitcoin was about 30% below its all-time high, and the comparable declines in the first three cycles were all more than twice that level. The report therefore argues that the probability of another equally deep decline is decreasing. This is a probability judgment based on historical distribution, not a guarantee of future price action—especially since with only four complete cycles as samples, statistical conclusions themselves carry considerable uncertainty.
Risks, Scenarios, and What to Watch Next
Risks that must be confronted
The most easily misused way to apply drawdown data is to treat "it eventually recovered every time in history" as a reason positions can withstand unlimited stress. Historical samples are limited, and four cycles are insufficient to support strong statistical inference. Institutionalization has reduced volatility while also introducing new transmission channels; redemption pressure on ETF flows and correlation with traditional risk assets could make drawdowns more synchronized with macro events rather than crypto-market internal rhythms. Leverage is an amplifier—the October 2025 liquidation scale already showed that prices don't need to fall much for structural positions to be wiped out. Moreover, if this cycle is indeed in a post-top phase, the current rebound does