






Gate Institutional Weekly Report: Crypto Market Surges, ETF Inflows Reach $1.918 Billion (August 17 — August 23, 2026)


- Core View: The U.S. Treasury's expanded long-term bond buybacks improved liquidity expectations, and combined with a regulatory thaw, crypto assets significantly outperformed U.S. equities. BTC and ETH breaking key levels triggered a short squeeze; institutional capital flowed strongly back into ETFs, and on-chain risk appetite recovered broadly, though elevated leverage crowding and short-term defensive demand rose simultaneously.
- Key Elements:
- BTC and ETH spot ETFs recorded single-week net inflows of approximately $1.918 billion and $693 million, respectively, a strong reversal from net outflows the prior week, with both product categories seeing 5 consecutive days of net inflows.
- BTC rose about 23.6% for the week, briefly touching $79,600; cross-exchange OI rose to $12.6 billion, with funding rates rising notably in the latter half of the week, accumulating risk of longs chasing the rally.
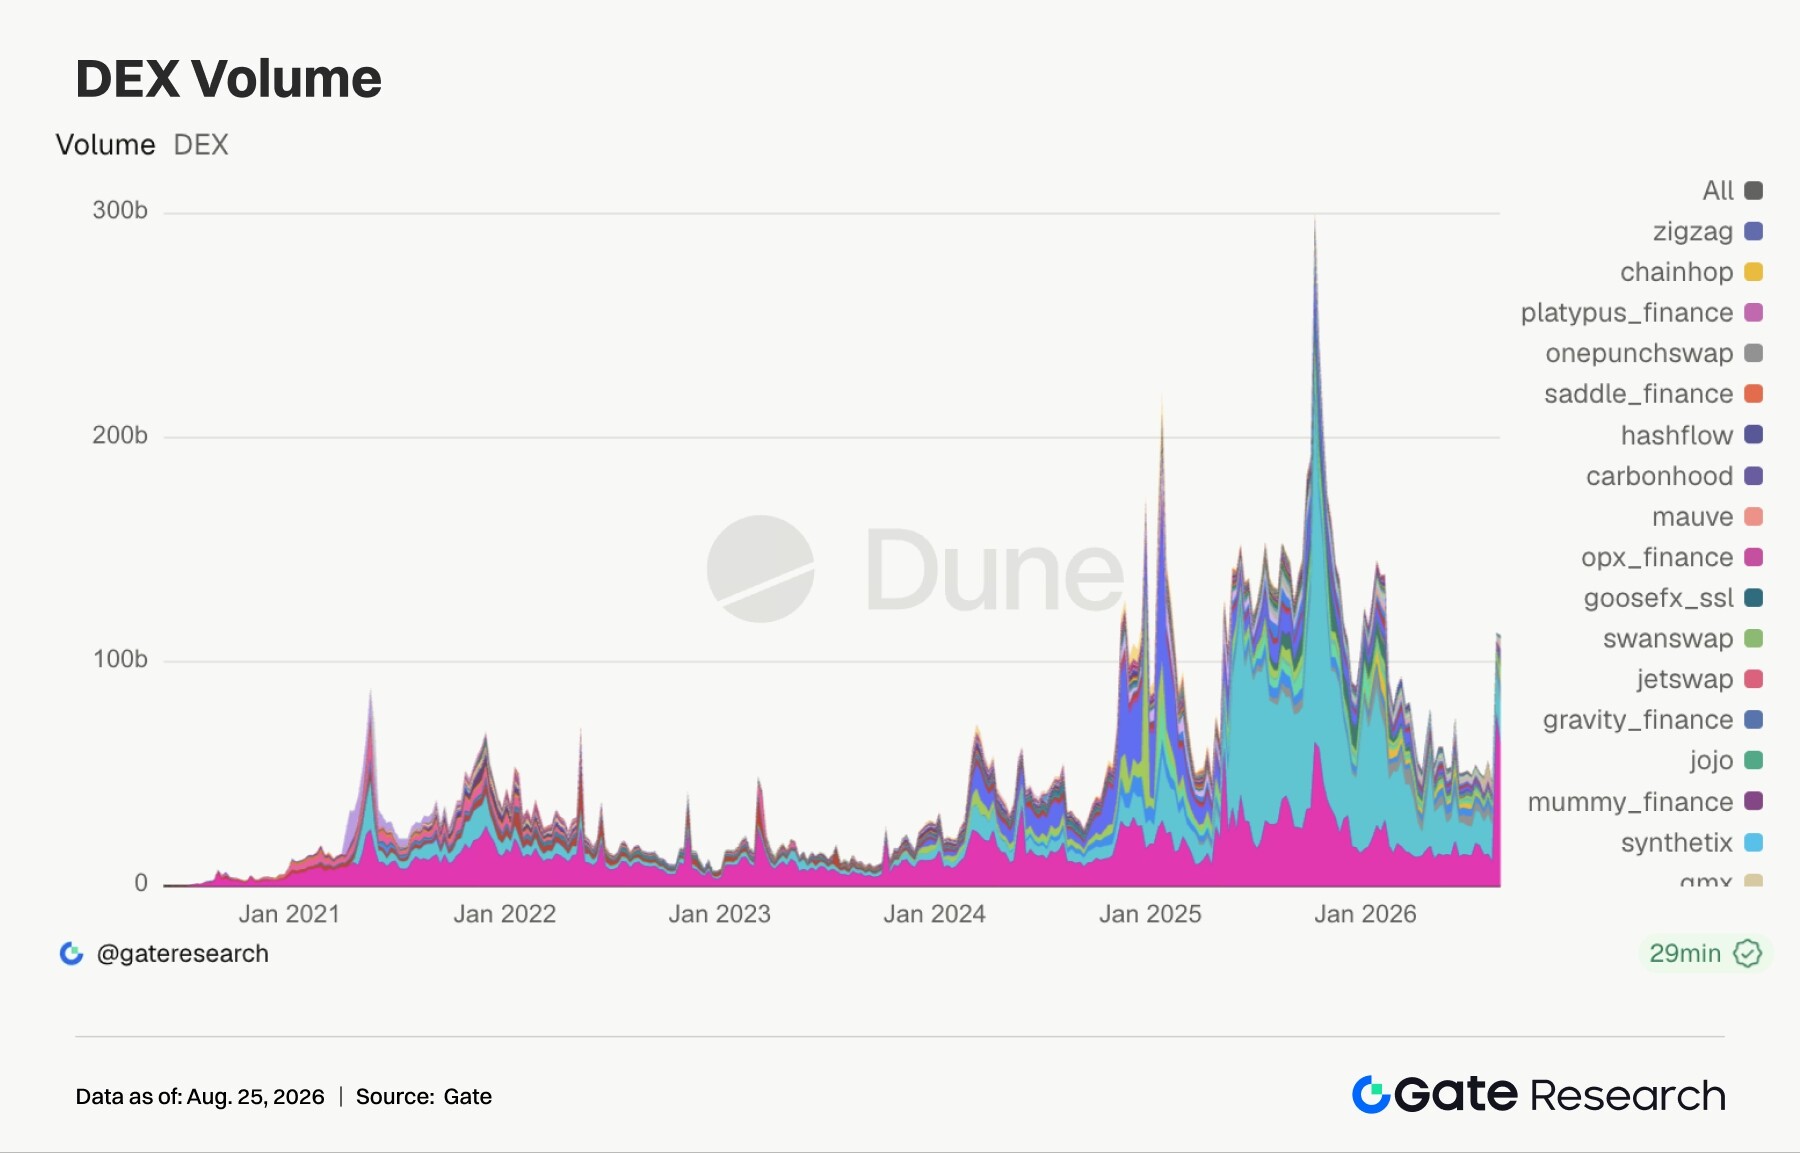
- On-chain trading breadth expanded, with Aerodrome, Meteora, Raydium, Whirlpool, and Curve volumes growing 70.9%, 135.8%, 119.1%, 231.4%, and 136.1%, respectively.
- Total stablecoin supply grew by over $2.3 billion for the week, with USDC adding approximately $1.67 billion as the main driver; RLUSD grew about 21% to $2.08 billion.
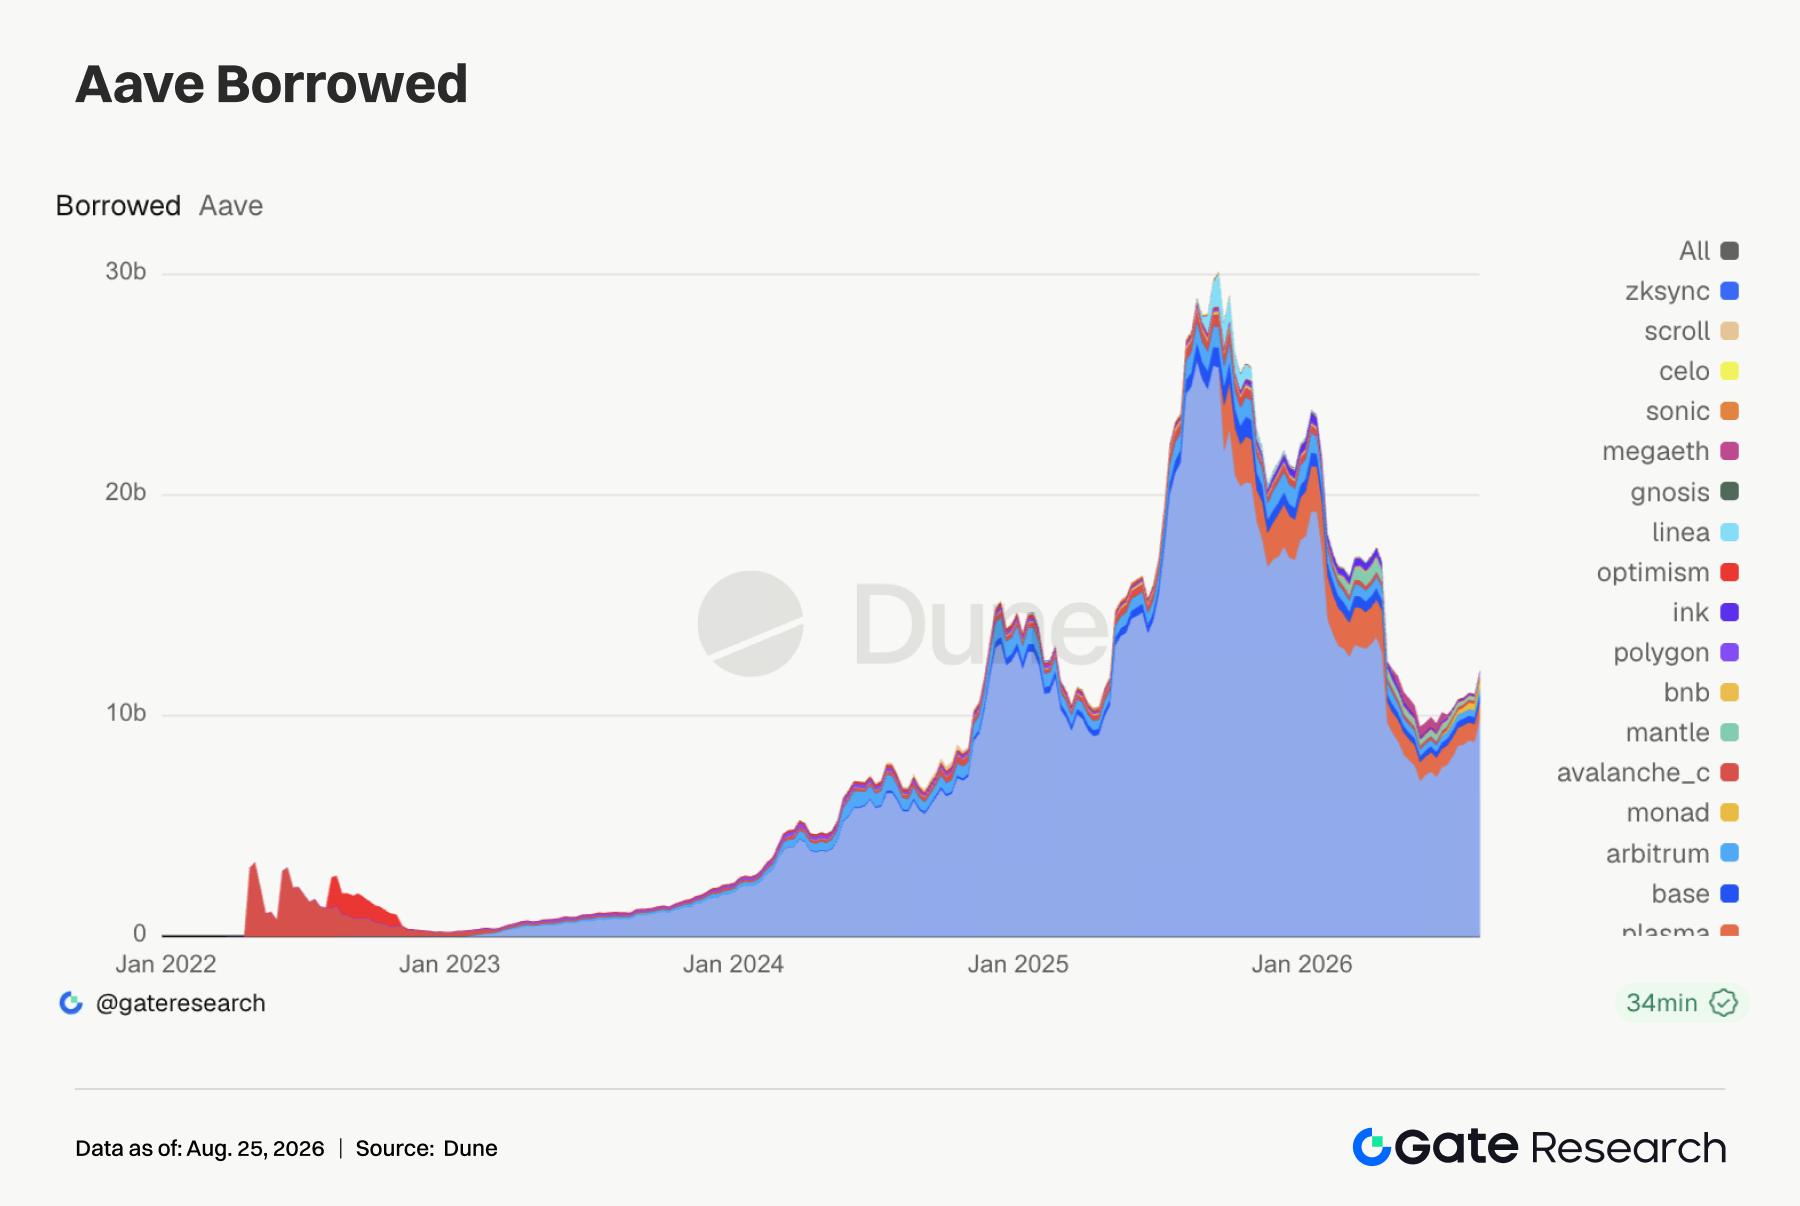
- Aave's Ethereum market borrowing balance grew 12.1% to $9.89 billion, with capital reconcentrating into Ethereum and mature L2s, while interest rates rose only modestly.
- Hyperliquid's weekly revenue grew approximately 238% week-over-week to $19.33 million, with derivatives and order flow infrastructure emerging as the primary beneficiaries of the risk appetite recovery.
- The options market shifted toward "medium-term bullish, short-term defensive," with 25D Skew dropping to approximately -5.2%, DVOL rising to 42—44, and demand for short-end protection rebounding.
Summary
• The Treasury Department's expansion of long-term bond buybacks temporarily improved liquidity, and crypto assets significantly outperformed traditional risk assets. After BTC and ETH broke through key technical levels, a short squeeze formed, diverging markedly from US equity trends.
• Institutional capital flowed strongly back into crypto ETFs, with spot BTC and ETH ETFs seeing net inflows of approximately $1.918 billion and $693 million respectively in a single week, forming a positive feedback loop between capital and price. The trading focus of TradFi continued to shift toward equities, with Gate TradFi weekly volume still exceeding $100 billion.
• On-chain risk appetite recovered across the board, and trading breadth expanded noticeably. Trading in ecosystems such as Base and Solana rebounded, with volumes on Aerodrome, Meteora, Raydium and others growing substantially; LSTs, Aave borrowing, and stablecoin supply expanded in tandem, as on-chain capital re-entered trading, staking, and leverage scenarios.
• Capital focused more on high turnover and revenue realization capability, with Hyperliquid's weekly revenue growing approximately 238% quarter-over-quarter; revenue across trading front-ends and infrastructure generally improved; USDC and RLUSD became the main drivers of stablecoin growth.
• BTC broke out strongly, but crowded leverage at high levels began to emerge, with BTC OI rising to $12.6 billion and funding rates clearly climbing in the latter half of the week, gradually accumulating the risk of longs chasing the rally.
• The options market shifted to "medium-term bullish, short-term defensive," with 25D Skew falling to approximately -5.2% and DVOL rising to 42–44, indicating that the market significantly increased short-term drawdown pricing while retaining medium-term upside exposure.
1. Market Focus Analysis
Last week (August 17–23, 2026), global markets fluctuated sharply around US Treasury supply, inflation pressures, and Middle East tensions. The US Treasury announced that starting September 9, the single buyback cap for long-term Treasury bonds would be raised from $2 billion to at least $4 billion, which briefly drove long-bond prices higher and yields lower, quickly improving liquidity expectations for high-volatility assets. However, rising crude oil prices, fiscal deficits, and issuance pressures subsequently regained dominance in the market, with the US 10-year Treasury yield rebounding to approximately 4.74% on Friday and the 30-year yield rising to approximately 5.28%. On the economic data front, initial jobless claims fell by 6,000 to 206,000, while continuing claims rose to 1.799 million, indicating layoffs remain low but hiring momentum is weak.
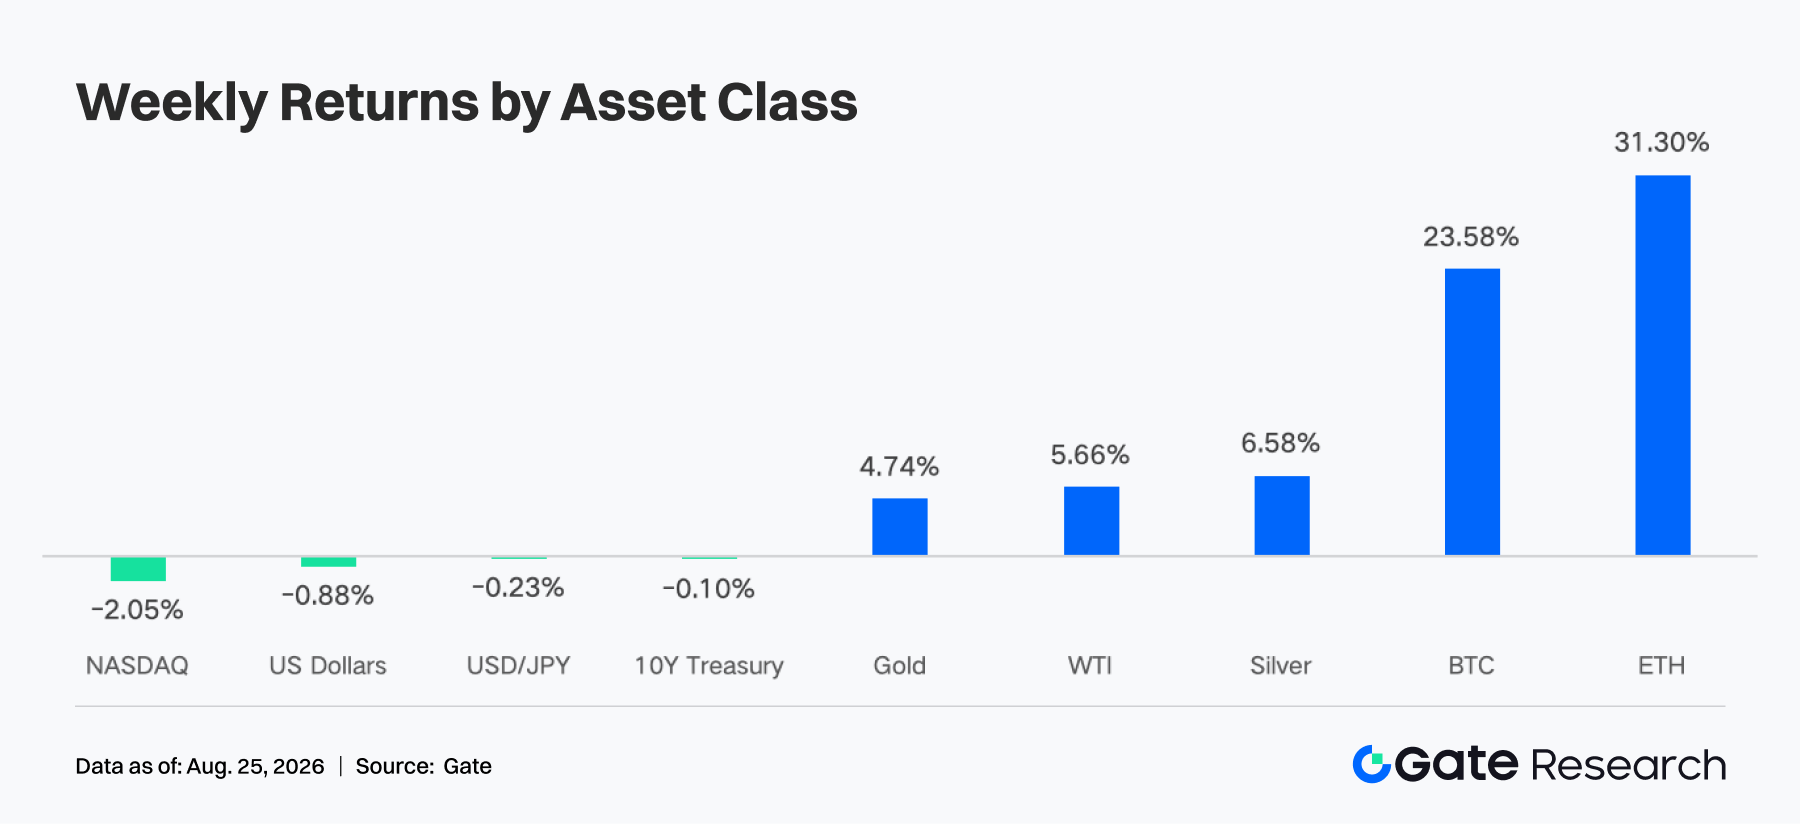
US equities were dragged down by high interest rates, oil prices, and tech stock valuation pressures, with the S&P 500, Nasdaq, and Dow Jones falling 1.4%, 2.1%, and 0.9% respectively for the week. Iran-related supply risks pushed WTI crude oil up approximately 5.7% for the week to $87.06, while Brent crude rose approximately 6.6% to $94.39; gold strengthened on safe-haven demand and real interest rate fluctuations. Crypto market performance clearly decoupled from US equities: the Treasury's buyback arrangement briefly lowered yields, and combined with warming US regulatory policy, triggered large-scale short covering. After BTC and ETH broke through key technical levels, a positive feedback short squeeze formed, with weekly gains significantly outpacing traditional risk assets.
2. Liquidity Analysis
2.1 Spot ETFs See Strong Reversal, with Combined Net Inflows of Approximately $1.918 Billion
Last week, US spot BTC ETFs saw combined net inflows of approximately $1.918 billion, a strong reversal from the previous week's net outflows of approximately $385 million; ETH ETFs saw combined net inflows of approximately $693 million, also turning positive from the previous week's net outflows of approximately $3 million. On the BTC side, IBIT led with approximately $1.331 billion in net inflows, accounting for about 69% of the week's total; HODL saw net outflows of approximately $16 million, making it the weakest performer. On the ETH side, ETHA led by a wide margin with approximately $537 million; no product saw weekly net outflows, TETH had no fund changes, and EZET was the lowest among products with inflows at only approximately $1 million. Daily totals from Farside BTC and Farside ETH show that both product categories recorded net inflows for 5 consecutive trading days.
As of August 21, total BTC ETF AUM was approximately $96.07 billion, up approximately 25.4% from approximately $76.60 billion the previous week; total ETH ETF AUM was approximately $14.30 billion, up approximately 35.9% from approximately $10.50 billion. Combined AUM for both ETF categories increased by approximately $23 billion, but actual net subscriptions were only approximately $2.6 billion, indicating that the increase mainly came from asset revaluation driven by price appreciation. Overall, institutional sentiment has rapidly switched from cautious redemptions to active allocation, and ETH's fund participation and AUM elasticity have both strengthened noticeably; however, capital is highly concentrated in BlackRock products, and the sustainability of the rally still needs to be observed to see whether subsequent inflows spread to more issuers.
2.2 TradFi Liquidity
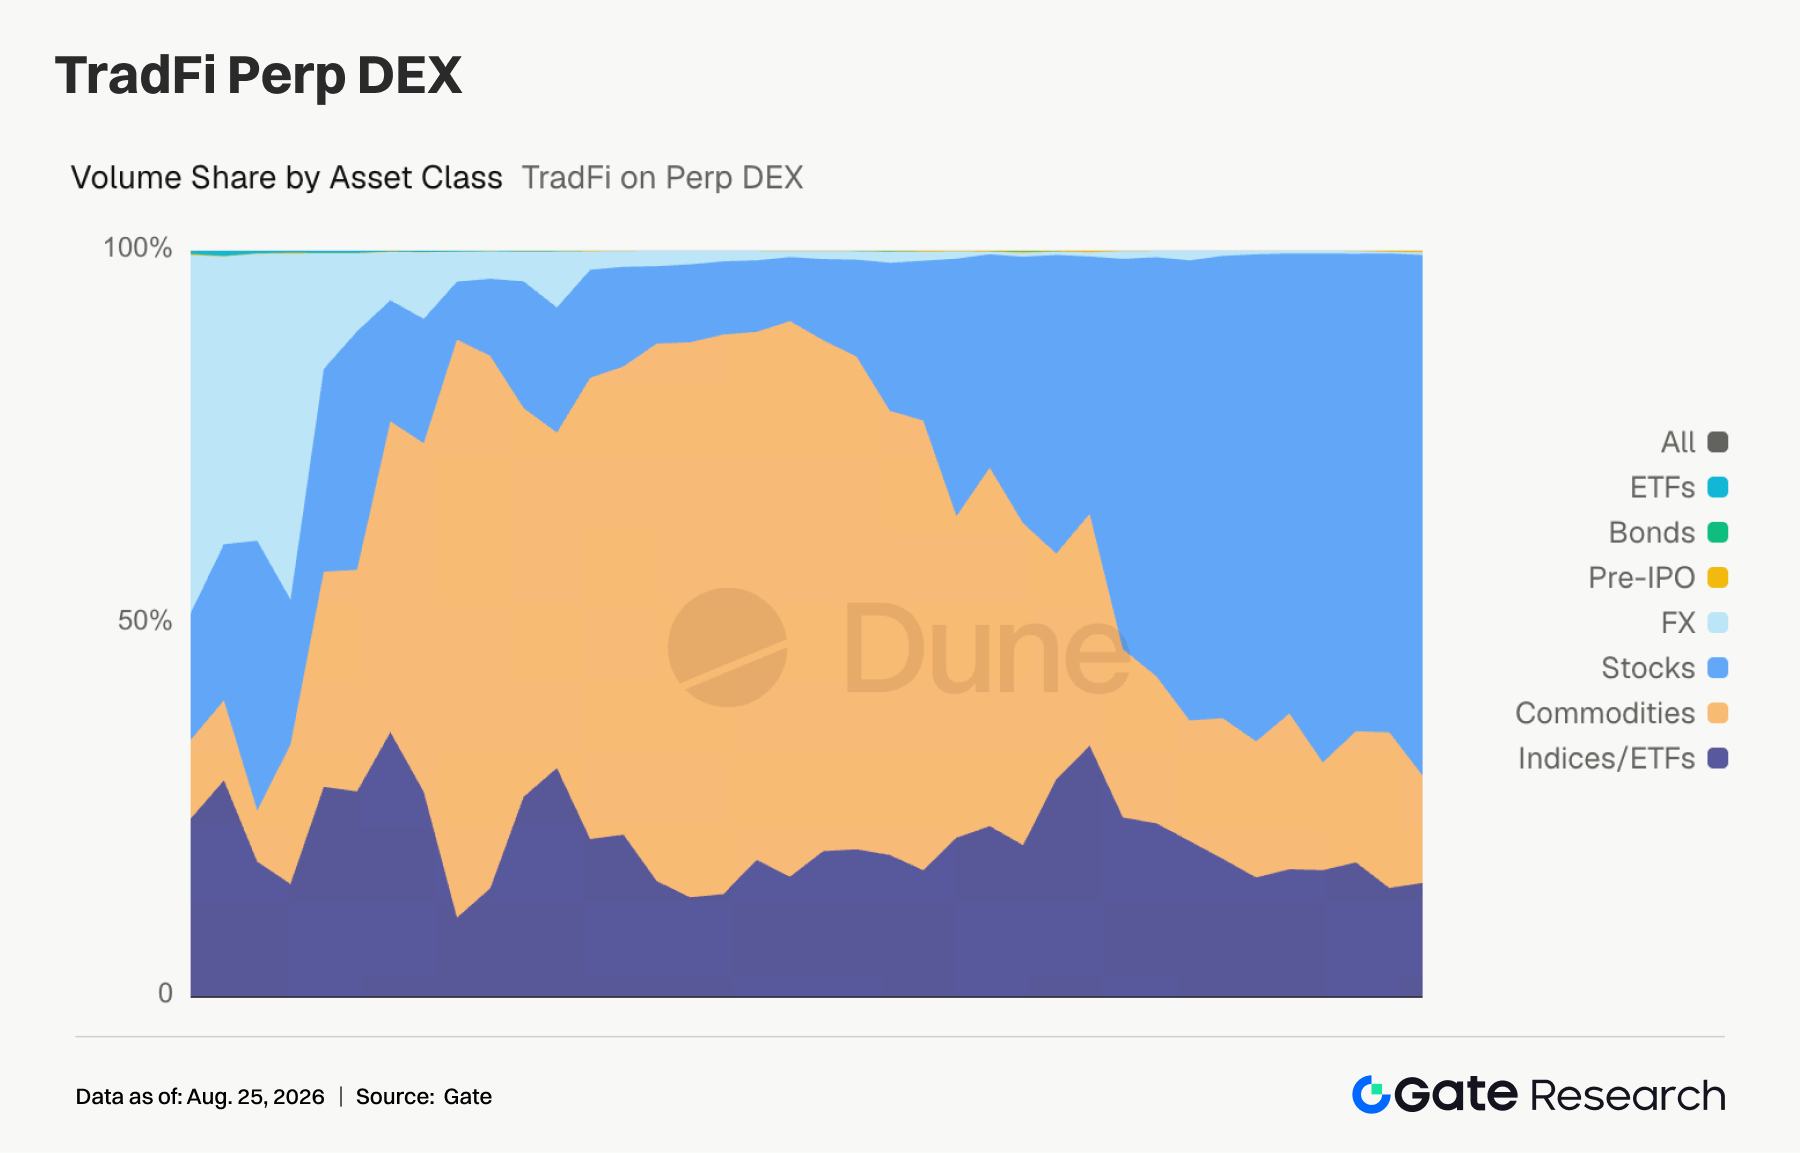
• TradFi Perp DEX: Over the past week, the broader TradFi Perp DEX market continued its trading structure dominated by equities with contracting commodities. The equity category's trading share remained at approximately 65%–70% overall, further increasing from early August and continuing as the market's absolute mainstay; the commodity category's share fell back to approximately 15%–20%, significantly cooling from highs exceeding 60% in March–April. Index/ETF accounted for approximately 15%, remaining relatively stable overall, while forex, bonds, Pre-IPO and other categories remained near marginal levels. Overall, the trading focus of TradFi Perp DEX has clearly shifted from commodity assets such as gold and crude oil in the first half of the year toward equities, with equity perpetuals becoming the core category driving growth in on-chain traditional financial derivatives.
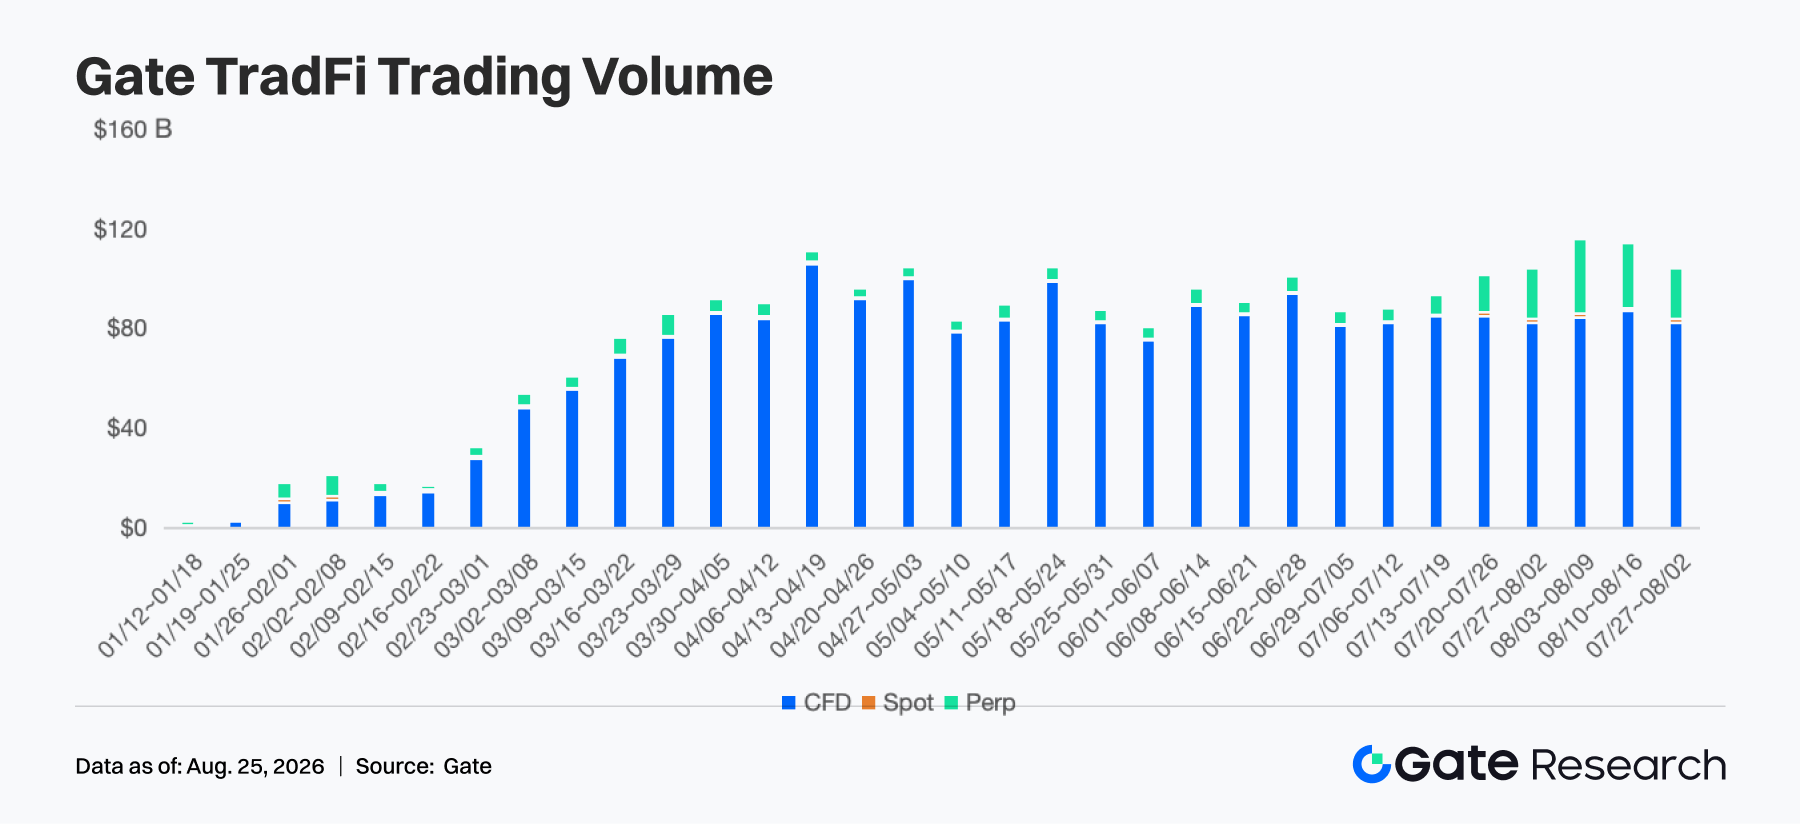
• Gate TradFi Trading Volume: Last week, Gate TradFi's total trading volume was approximately $105 billion, down from approximately $115 billion the previous week, but still significantly above the approximately $85 billion level in early July, maintaining an overall recent high. Structurally, CFD remained the core trading category at approximately $82 billion, accounting for nearly 80% of the total; Perp was approximately $22 billion, down from previous highs but still the main trading source besides CFD; Spot's share remained low. Looking at the trend over the past month, Gate TradFi's weekly trading volume has consistently remained around or above $100 billion, indicating that the center of TradFi business scale has clearly risen compared to Q2, though both CFD and Perp cooled simultaneously this week, with short-term growth momentum slowing somewhat.
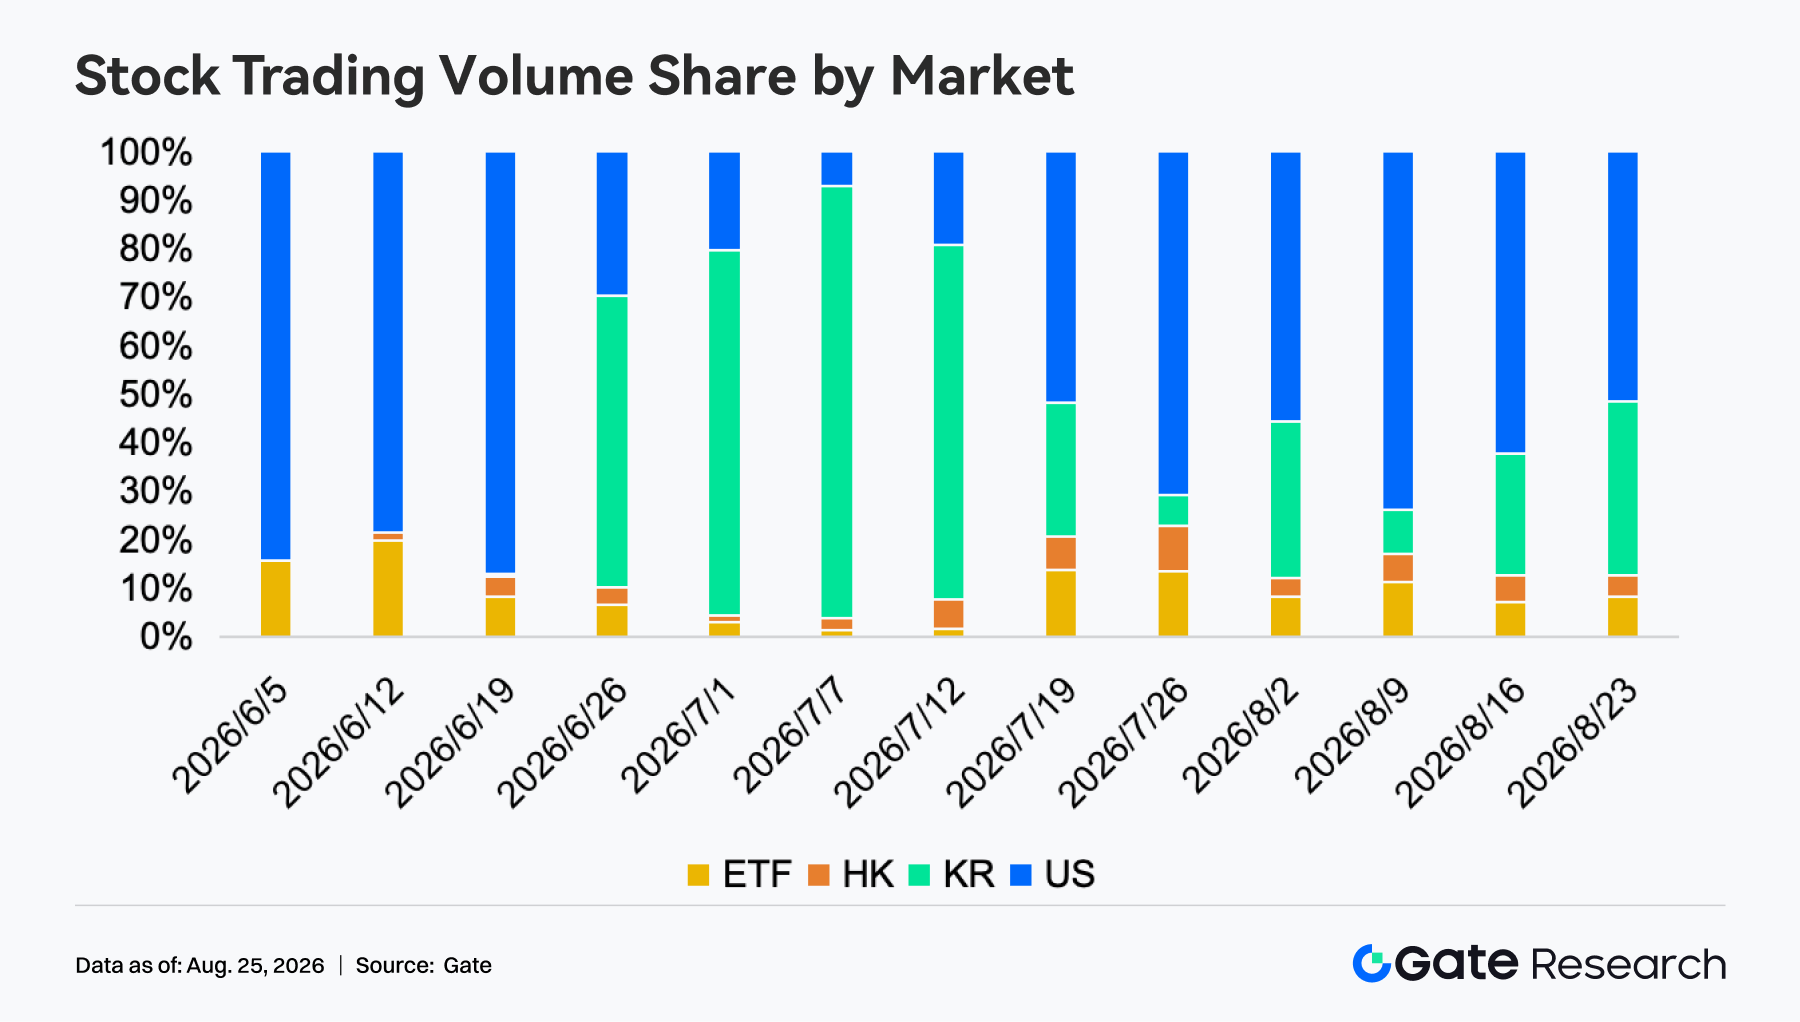
• Gate Equity Asset Trading Volume: Last week, Gate's equity trading structure continued to show US equities dominating with Korean equities rebounding. The US equity trading share fell from approximately 62% the previous week to approximately 52%, but still maintained its position as the largest market; the Korean equity share quickly rose from approximately 26% to approximately 36%, rebounding for the second consecutive week, further narrowing the gap with US equities. ETF accounted for approximately 8%, rebounding somewhat from before, while Hong Kong equities maintained a relatively low level of approximately 4%. Compared to late July when US equities once accounted for approximately 70% of trading volume, recent capital allocation has clearly become more diversified. Overall, Gate equity capital is rebalancing between US and Korean equities, with Korean equities once again becoming the most important source of growth, while ETFs and Hong Kong equities play more of a supplementary allocation role.
• TradFi Order Book Depth: We selected XAUT, which has the highest TradFi trading volume, to analyze its order book depth (Delta). Last week, XAUT's price quickly rose from approximately $4,380 to above $4,600, with order book liquidity experiencing significant improvement in tandem. When prices were at lows on the 18th–19th, the ±1% liquidity Delta once fell to approximately -$2.9 million, with sell-side depth clearly dominant; after the 20th, as prices rebounded, Delta quickly turned from negative to positive, maintaining mostly between +$500,000 and +$1.5 million on the 21st–23rd, indicating continuously strengthening buying support during the uptrend. On the 24th, XAUT further approached $4,650, but Delta briefly turned negative again, reflecting increased profit-taking at highs and rising sell orders. Overall, XAUT this week exhibited a clear "price rising, depth improving" characteristic, but buying and selling forces re-balanced as it approached highs.
3. On-Chain Data Insights
3.1 DEX Trading Breadth Expands Notably, Uniswap Shows Volume Decline but User Growth
Uniswap's weekly trading volume was approximately $63.25 billion, down 18.6% quarter-over-quarter, but transaction count grew 21.2% and trader count grew 14.5%. While it fell back from the previous week's large-transaction peak, small-transaction activity continued to increase. Robinhood Chain is an important source of this structural change. The chain's early trading was mainly driven by Meme assets, but this week cumulative trading of Robinhood stock tokens on Uniswap exceeded $1 billion again, with stock tokens becoming a new traffic entry point beyond Memes. PancakeSwap's trading volume was approximately $18.94 billion, roughly flat, but transaction count and trader count both grew approximately 27%, similarly showing declining per-transaction amounts and rising retail activity. PumpSwap's trading volume grew 4.9%, but trader count doubled to 2.25 million; Aerodrome grew 70.9%, while Meteora, Raydium, Whirlpool, and Curve grew 135.8%, 119.1%, 231.4%, and 136.1% respectively. The core of this week's rebound was the spread of trading activity to Base, Solana, and emerging high-performance venues; Pump App's zero fees and cross-chain USDC trading continued to reinforce the high-frequency, small-transaction user structure.
3.2 Stablecoin Supply Increases by Over $2.4 Billion, USDC and RLUSD Bear the Main Increment
Total supply of major stablecoins increased by over $2.3 billion for the week. USDC increased by approximately $1.67 billion, the main source of increment; USDT was roughly flat. Meanwhile, RLUSD grew approximately 21% to $2.08 billion, USDD grew 10.2%, PYUSD grew 4.2%, while BUIDL declined approximately 5.6%, with capital shifting from some tokenized money market funds to stablecoins that can be directly used for trading, payments, and collateral. USDC's expansion echoes this week's use cases. USDC Treasury continued large-scale minting on Solana, while Coinbase's x402 protocol processed approximately 14 million AI agent payments over the past 30 days, with settlement assets almost entirely in USDC. x402 embeds stablecoins into API and machine payment processes, making USDC demand no longer solely from exchanges and DeFi. RLUSD added two new issuance batches on the XRP Ledger on August 17 and continued to expand institutional distribution.
3.3 LSTs Enter Comprehensive Valuation Recovery, HYPE Staking Assets Lead in Elasticity
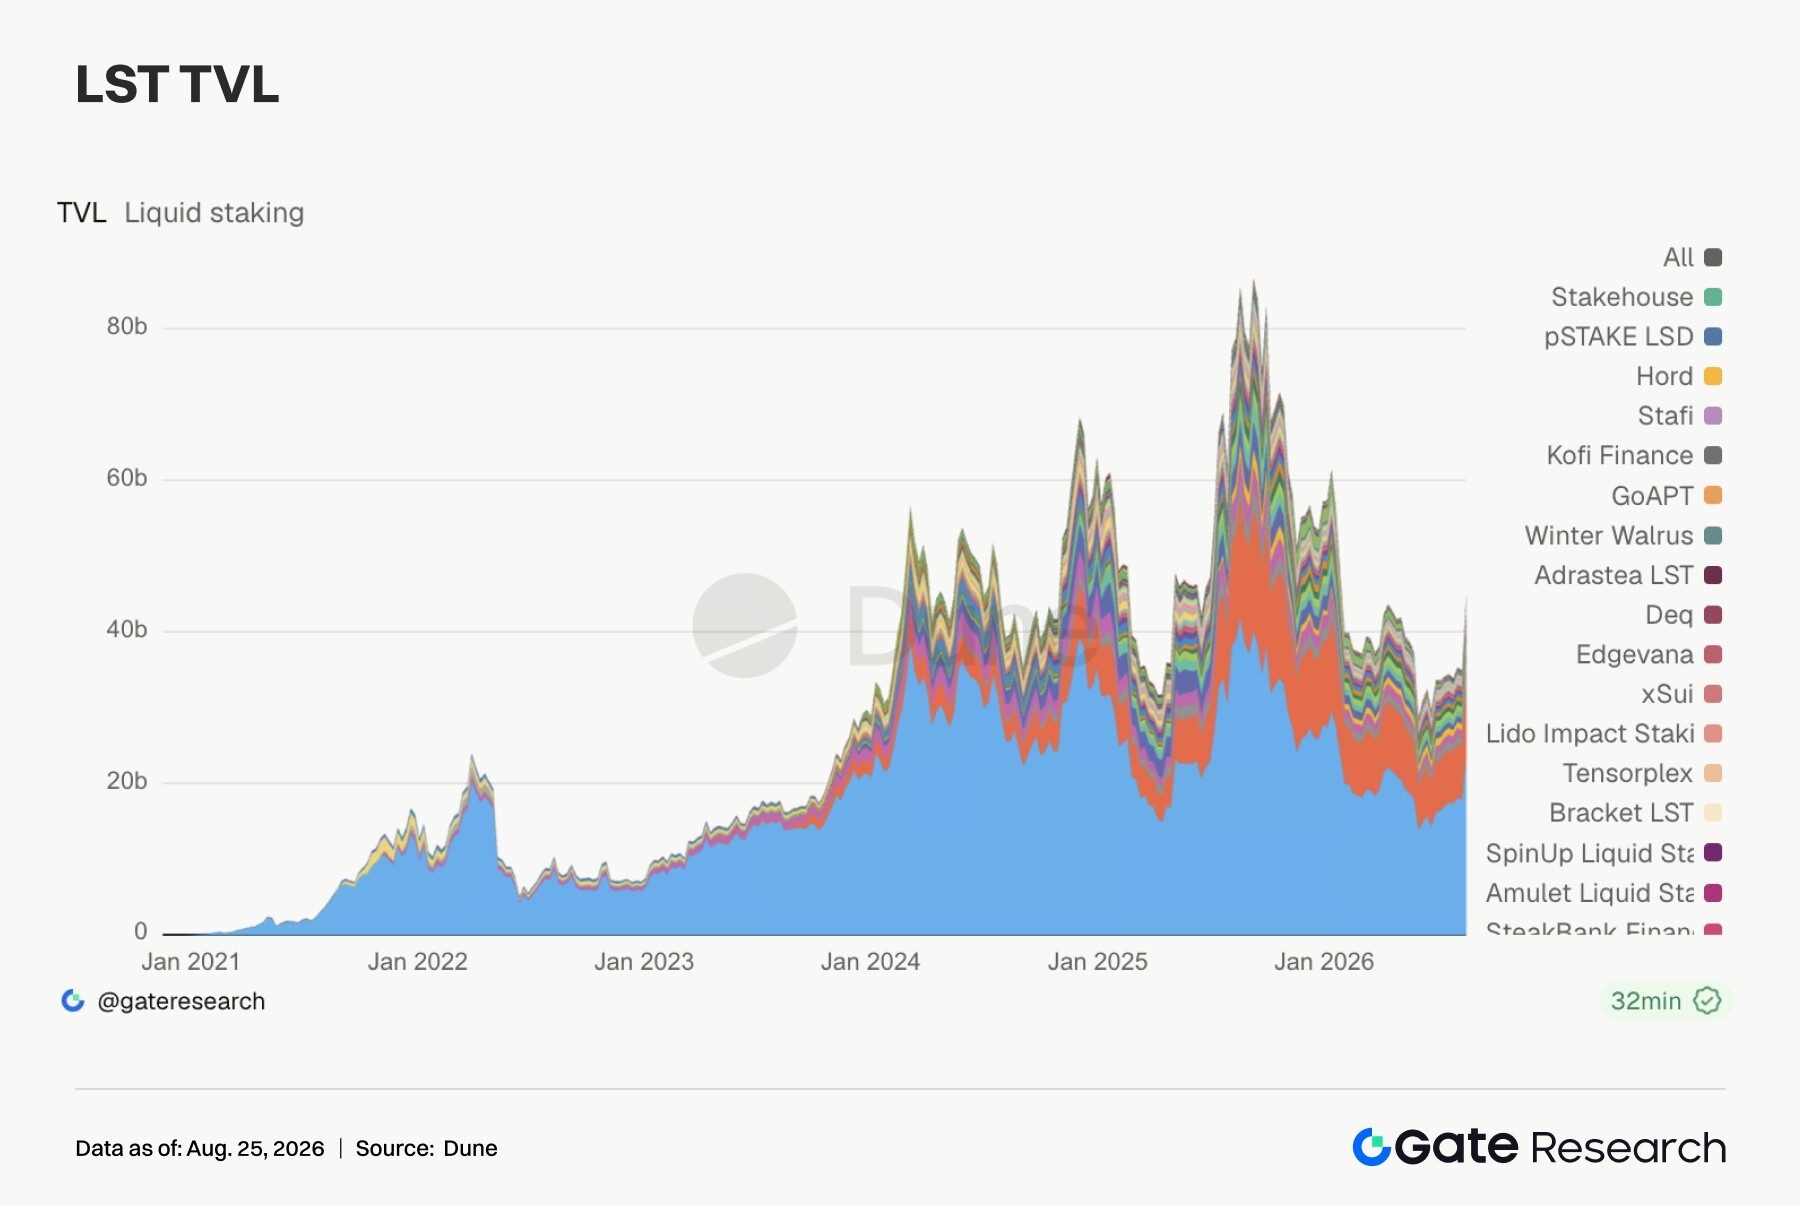
The LST sector generally rebounded along with underlying assets. Lido TVL rose to approximately $23.26 billion, up 29.9% quarter-over-quarter; Rocket Pool grew 28.9%, and StakeWise grew 29.1%. On the Solana side, Sanctum, Jito, and Jupiter Staked SOL grew 25.1%, 28.1%, and 23.9% respectively, with overall elasticity close to ETH staking assets. The strongest performer was Kinetiq kHYPE, with TVL growing 38.4% to approximately $1.13 billion. Its outperformance is related to HYPE's rise and Hyperliquid's trading revenue surge, with Hyperliquid's single-day perpetual trading volume once reaching $15.21 billion this week and HYPE rising to near $70.
3.4 Aave Borrowing Returns to Core Market Expansion, Institutional Collateral Boundaries Continue to Move Outward
Aave's Ethereum market borrowing balance rose from $8.82 billion to $9.89 billion, up 12.1%, an increase of approximately $1.07 billion in a single week, the main source of overall expansion. Base, Arbitrum, and Mantle grew 13.2%, 11.5%, and 12.0% respectively, while Avalanche, BNB Chain, and Optimism also recovered moderately; Plasma and Monad contracted 8% and 3.7% respectively. Capital reconcentrated in Ethereum and mature L2s, with borrowers prioritizing collateral depth, liquidation liquidity, and stability of risk parameters. Additionally, Aave V4 deposits approached $750 million, increasing by over $300 million in a week, as the Hub-and-Spoke architecture began to gain real capital validation. Meanwhile, Securitize proposed including Neuberger Berman's tokenized high-yield fund HINC into Aave Horizon, allowing it to be used as collateral to borrow USDC, GHO, and RLUSD, meaning Aave's growth boundary is gradually expanding from crypto asset leverage to institutional credit markets.
3.5 Aave Interest Rates Rise Moderately, Borrowing Growth Has Not Evolved into Liquidity Competition
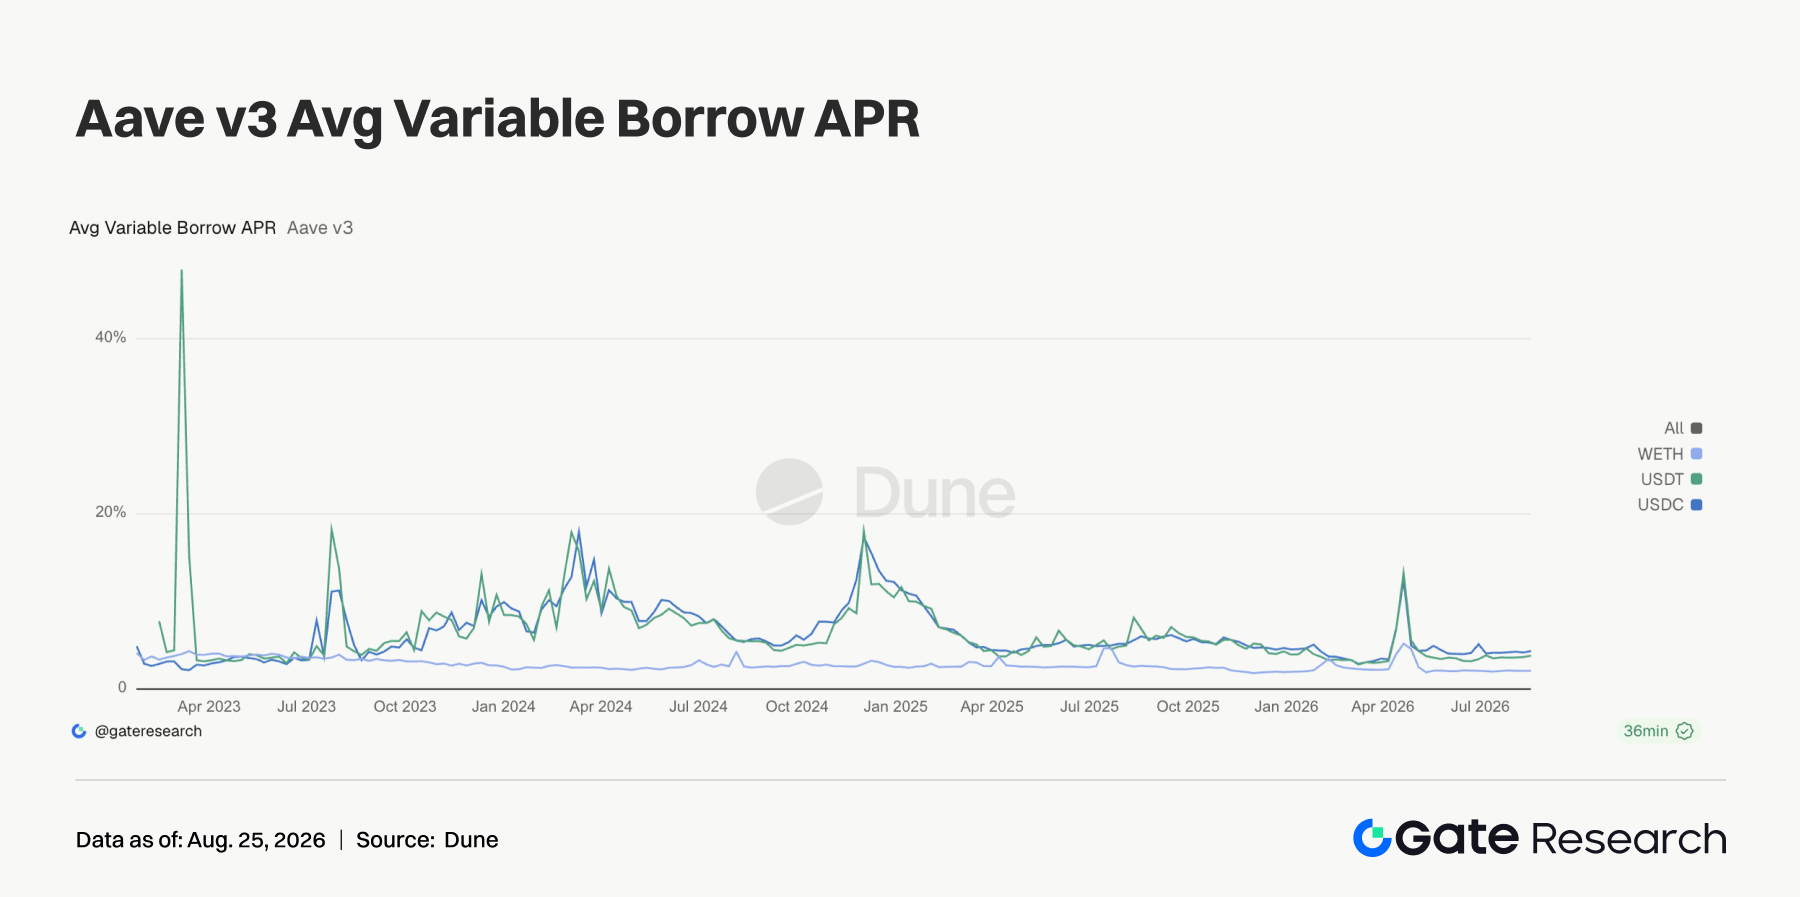
USDC average borrowing rate rose from 4.21% to 4.37%, USDT from 3.69% to 3.85%, both up approximately 16 basis points; WETH rose only from 2.11% to 2.13%. USDC's intraweek high rate approached 14%, indicating short-term pressure in some high-utilization pools, but average funding costs did not spike significantly in tandem with borrowing balances. USDT's high rate rose to 4.52%, with tail volatility expanding somewhat, but still within a controllable range. The market is recovering carry, market-neutral, and directional leverage demand, but has not yet entered a phase where borrowers compete for stablecoins. WETH balances expanded while rates remained largely unchanged, also indicating that ETH's rebound came more from spot, LST valuations, and position replenishment rather than aggressive ETH lending leverage.
3.6 Protocol Revenue Rebounds Notably, Hyperliquid Becomes the Main Beneficiary of Risk Appetite Recovery
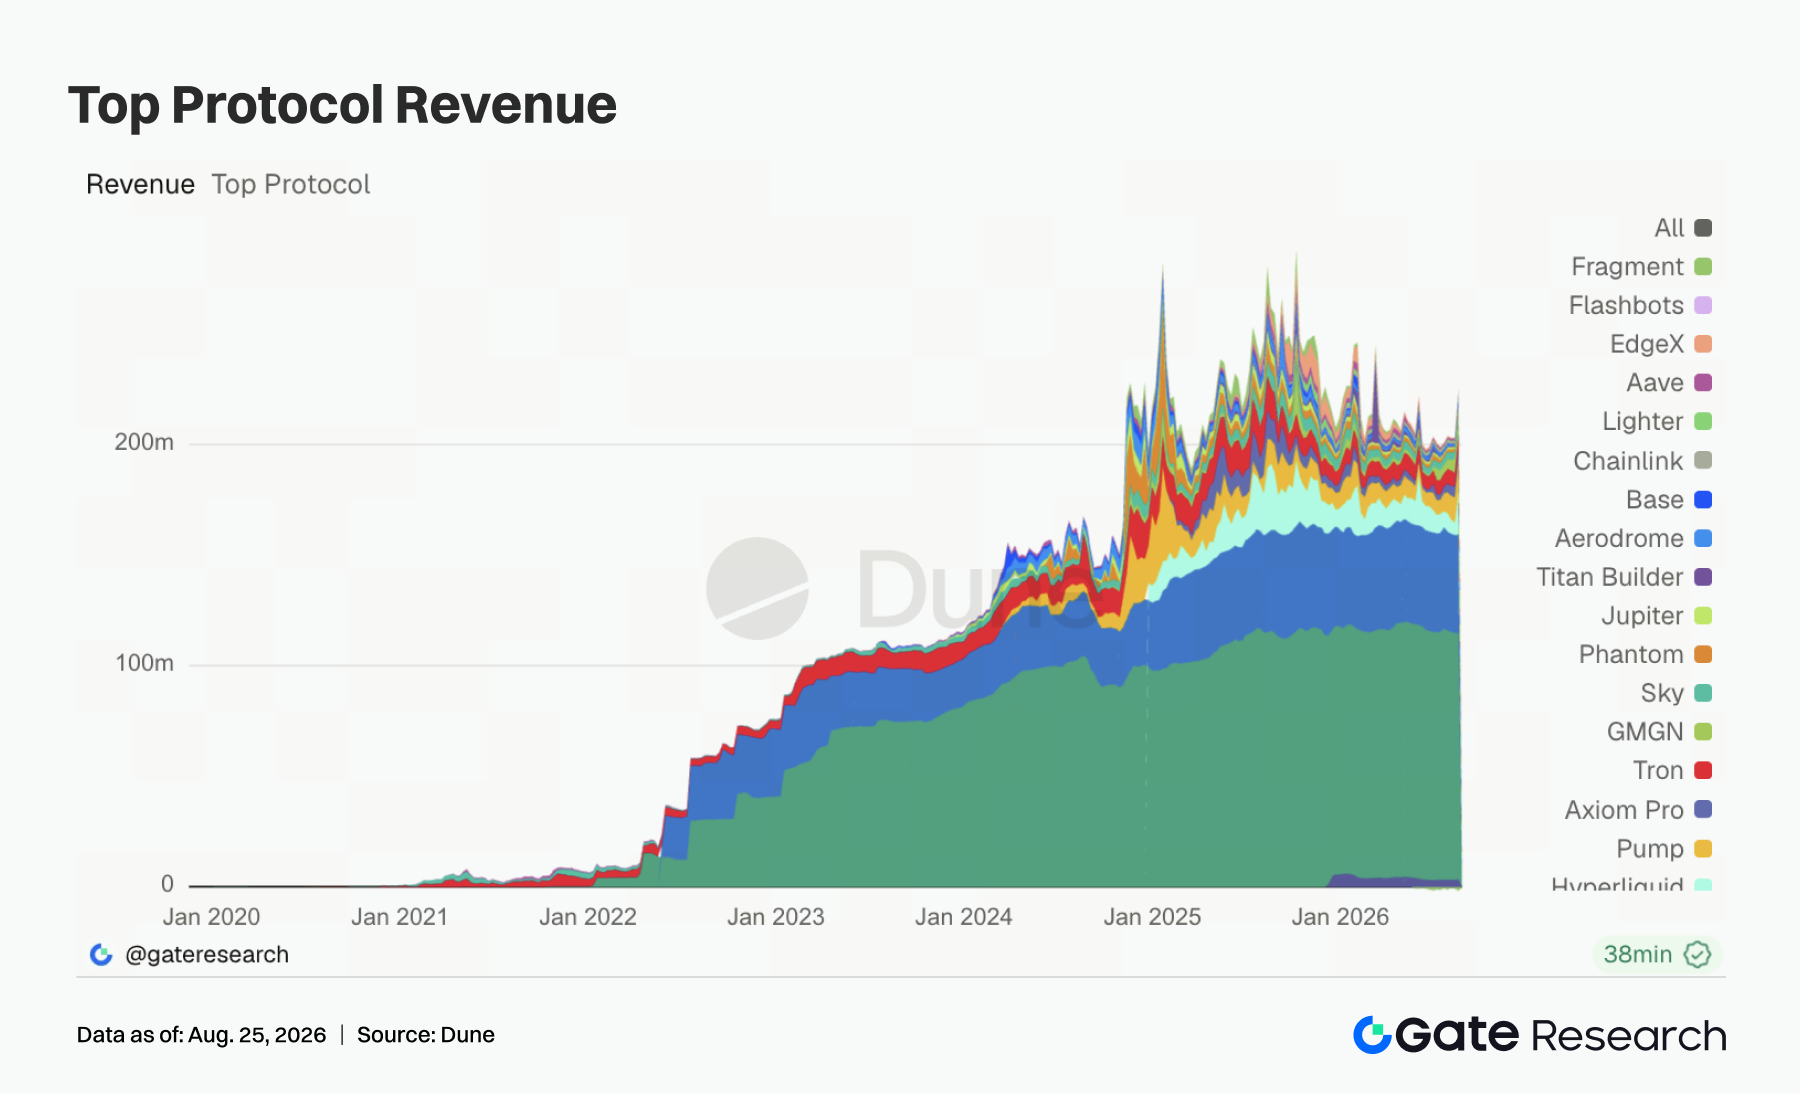
Hyperliquid's weekly revenue rose from $5.72 million to $19.33 million, growing approximately 238% quarter-over-quarter, the most significant increase among top protocols. Pump revenue grew 18.7% to $13.68 million, Axiom Pro grew 20.8%; Phantom, Jupiter, and Lighter grew 83.5%, 119.9%, and 186.1% respectively. The infrastructure side also benefited, with Titan Builder, Base, and Aerodrome revenue growing 332%, 224%, and 126% respectively, showing that this rebound transmitted to trading front-ends, block space, MEV, and liquidity layers simultaneously. Tether and Circle still ranked first and second with approximately $111 million and $44.51 million, but revenue was roughly flat; Aave revenue was approximately $990,000, growing only 1.1%. Therefore, this week's revenue improvement was highly concentrated in derivatives, Meme trading, and order flow infrastructure.
4. Derivatives Tracking
4.1 BTC Funding Rates Rise After Strong Upside, Moderate OI Growth Indicates Accumulating Leveraged Chasing
Over the past week, BTC rose rapidly from around $63,000, briefly touching $79,600 on August 21, then oscillating at highs and closing at approximately $77,700 on August 23, a weekly gain of approximately 23.6%. Price increases significantly outpaced contract open interest expansion. Cross-exchange aggregate OI





