






Gate Institutional Weekly Report: BTC Price Pulls Back but OI Remains Elevated, BTC ETF Sees Net Outflow of Approximately $385 Million (August 10 – August 16, 2026)


- Key Takeaways: U.S. inflation cooled but a 0.6% decline in retail sales exacerbated growth concerns, shifting the market's trading logic from inflation to economic growth; crypto assets significantly underperformed U.S. equities, with capital favoring more liquid traditional risk assets, BTC ETF saw a net outflow of $385 million, and institutional sentiment shifted from accumulation to defense.
- Key Elements:
- BTC spot ETF saw a net outflow of approximately $385 million, with AUM declining 3.57% week-over-week to $75.7 billion; ETH ETF saw a slight net outflow of $3 million, with capital interest nearly fading.
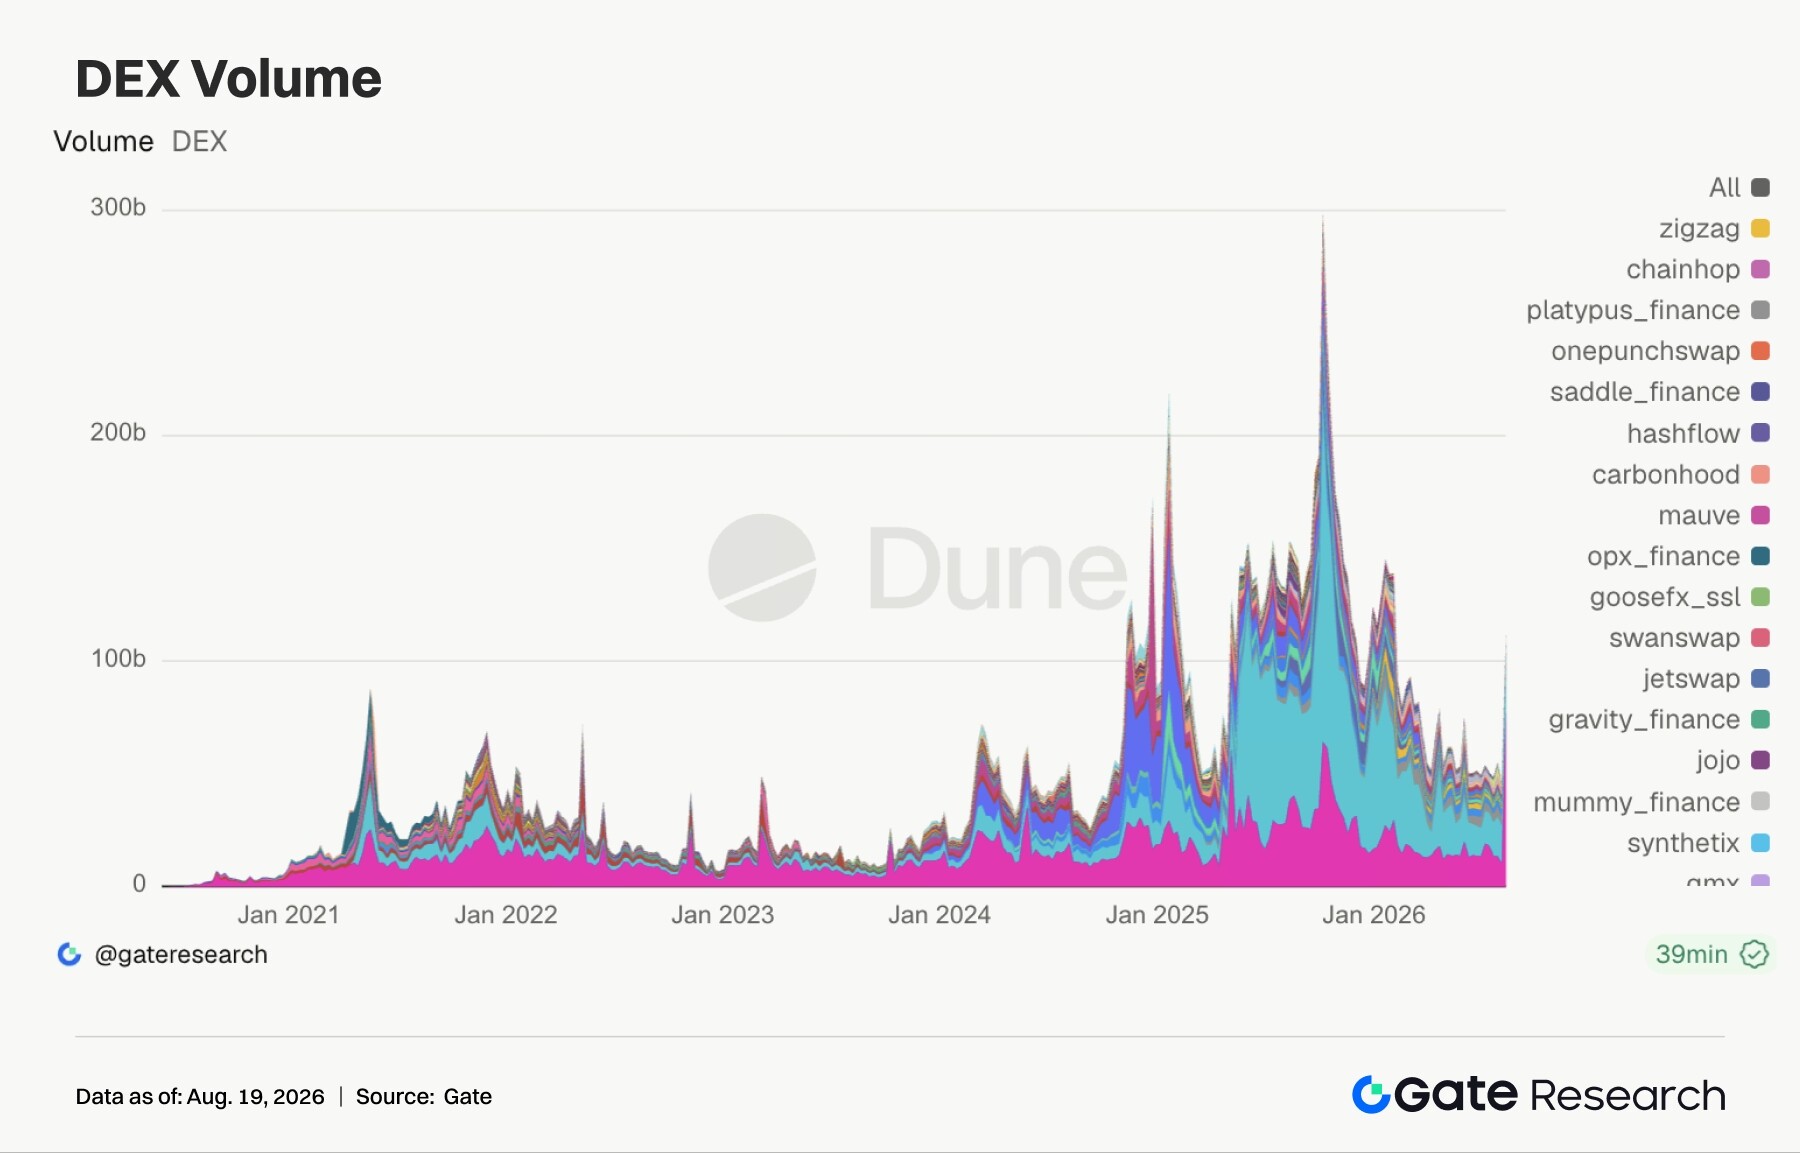
- DEX weekly trading volume fell 5.2% to $37.296 billion, with Uniswap V3 down 32.9% while V4 rose 2.7%; Robinhood Chain contributed approximately 60% of Uniswap protocol revenue, drawing attention to the conversion of traffic into protocol revenue.
- Total stablecoin market cap grew by only $148 million, with USDS contracting 4.5%, while USDD and RLUSD grew 10.2% and 8.3% respectively, as new supply flowed toward incentive, compliance, and institutional distribution channels.
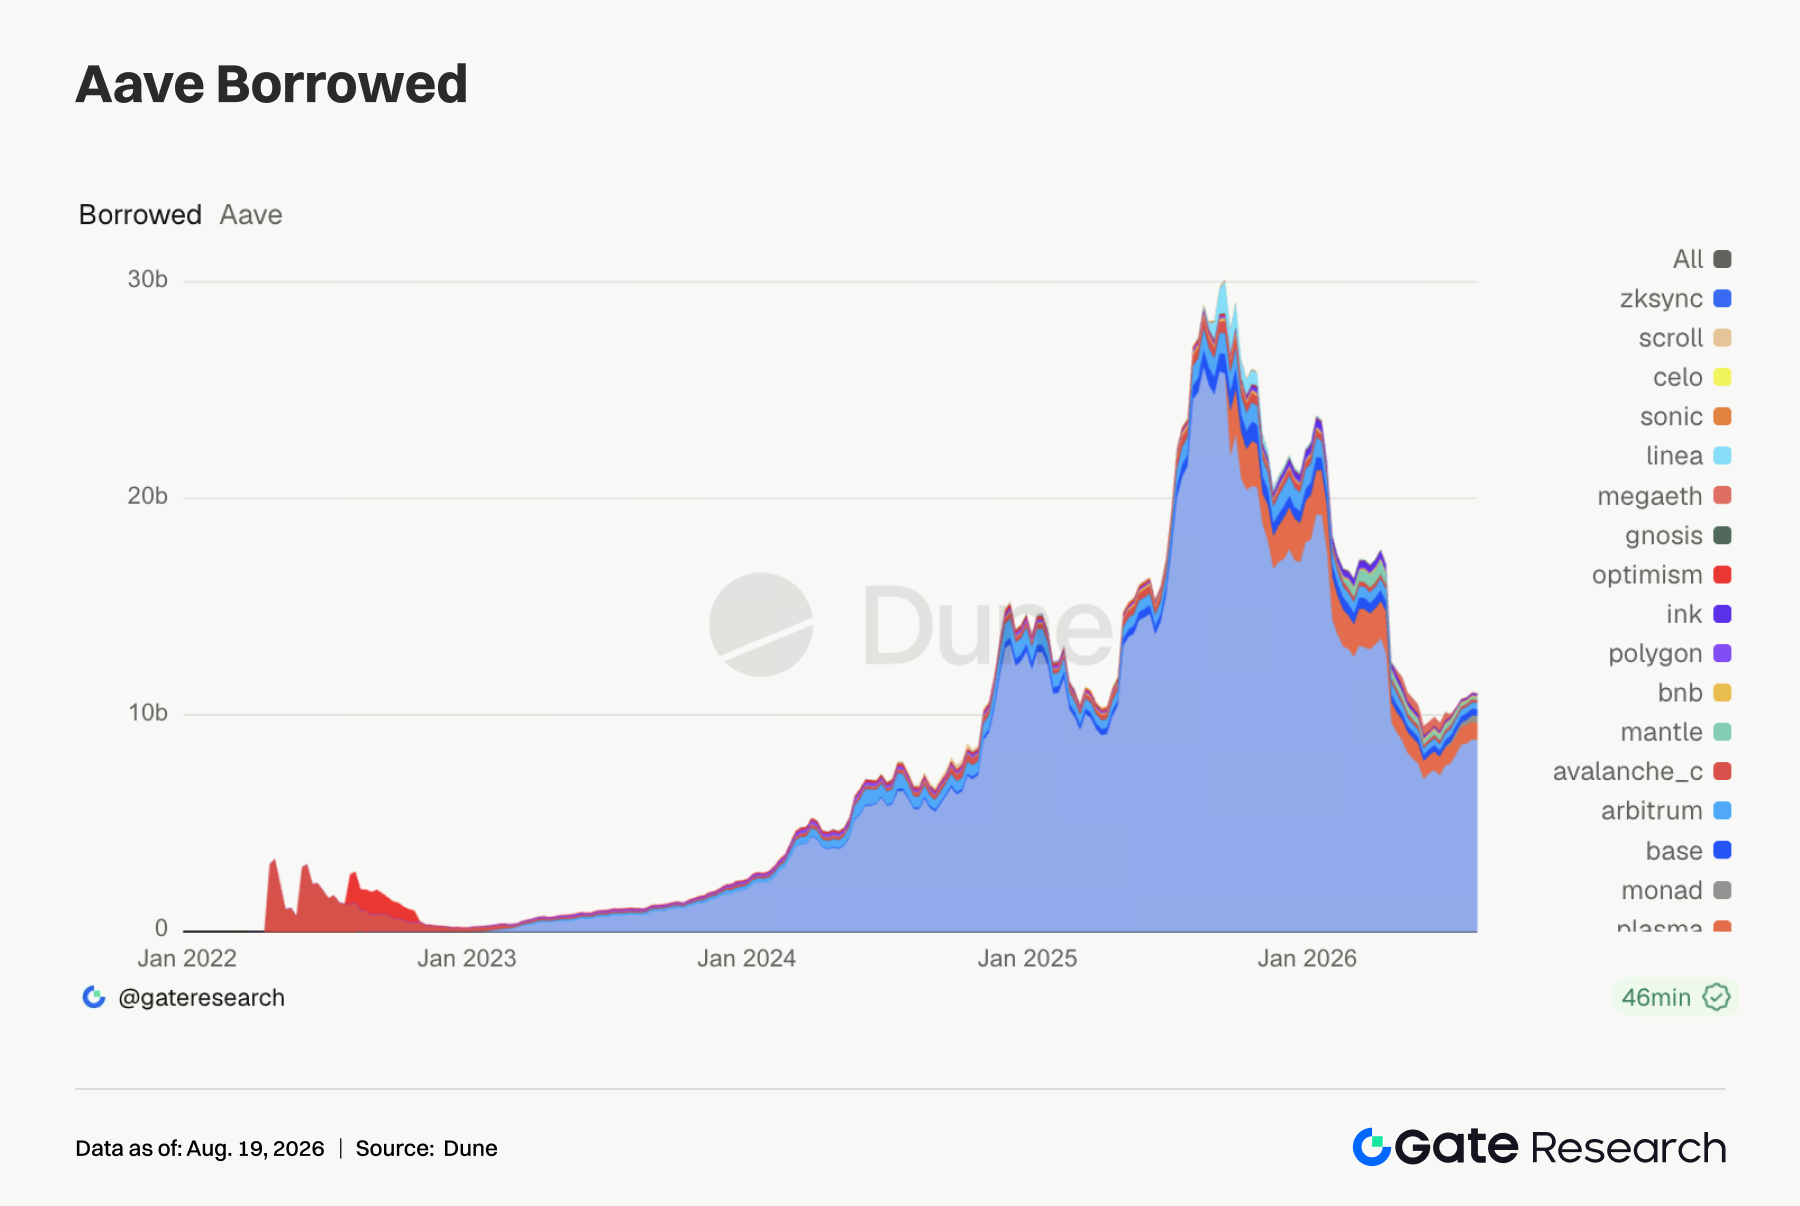
- Aave borrowing balances declined slightly, V4 deposits surpassed $400 million to hit a new high, USDC average interest rate dropped to 4.21%, and leverage expansion remained cautious.
- BTC price fell back to $62,900 but OI rose to approximately $12.3 billion with funding rates remaining positive, forming a "price down, OI high, positive funding rate" combination; a break below $62,500 would warrant caution over long position deleveraging.
- The Put/Call Ratio for end-of-August options rose to 1.9, the 25D Skew briefly dropped to -8.12 before recovering to around -3, and DVOL spiked then pulled back to around 35; short-term defensive demand increased but the medium-to-long-term outlook remains bullish.
Summary
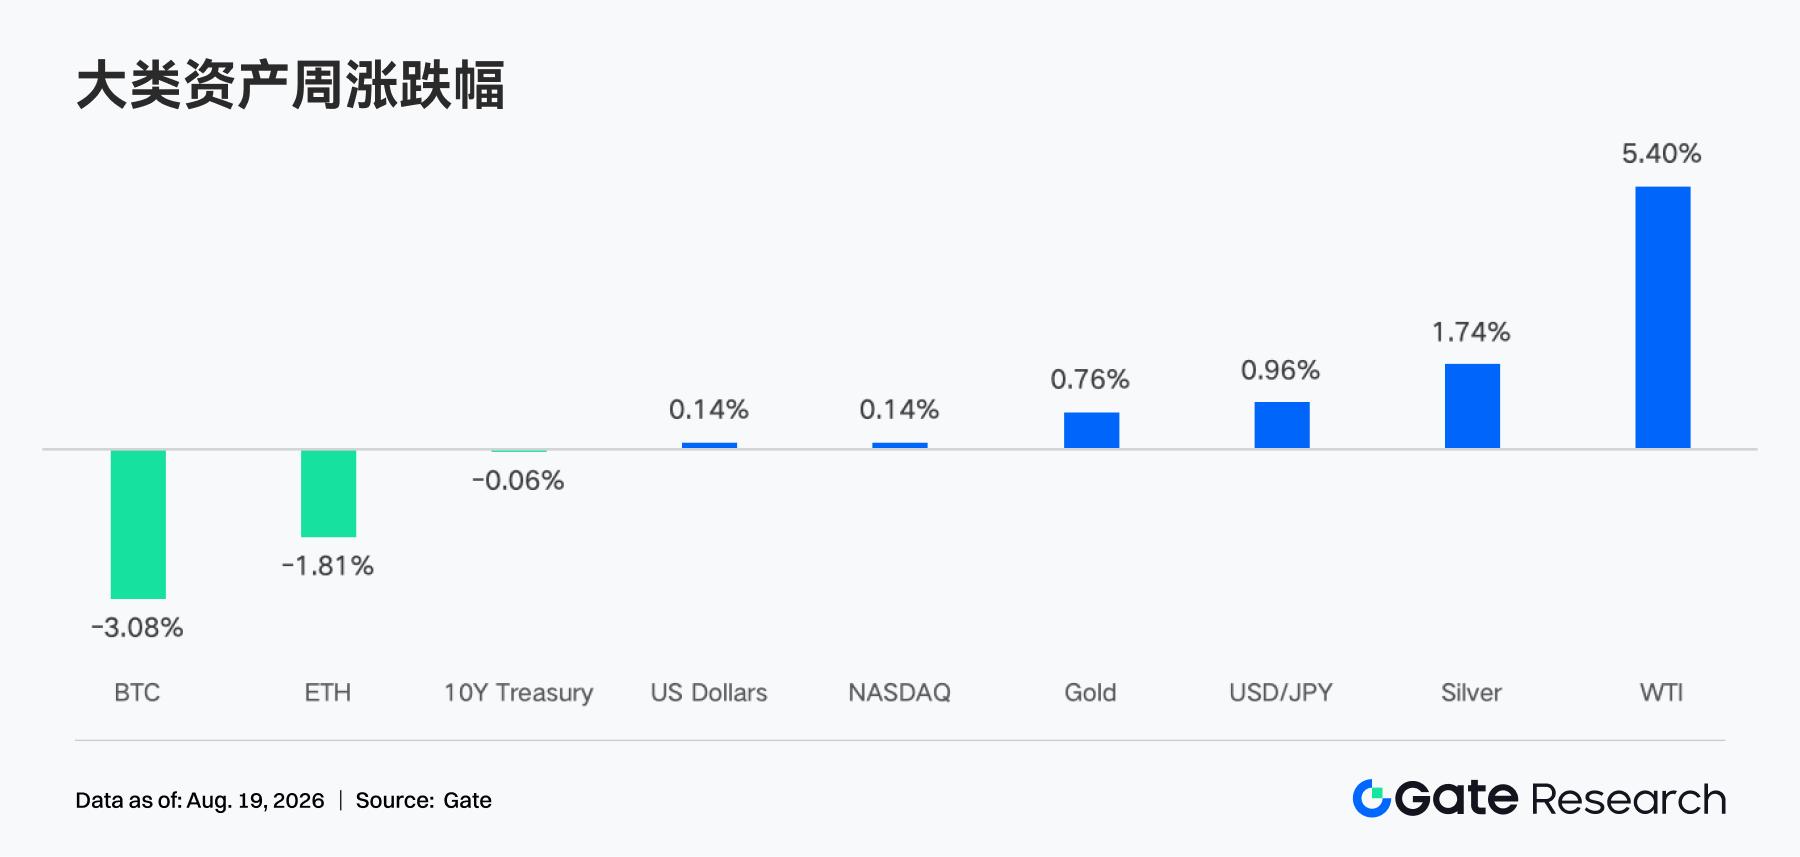
• Easing CPI and PPI pressure pushed US Treasury yields lower, but a 0.6% drop in retail sales intensified growth concerns. US equities overall remained resilient, with the market's trading focus shifting from inflation back to economic growth. Crypto assets significantly underperformed US equities, as capital continued to favor more liquid traditional risk assets.
• BTC ETFs saw net outflows of approximately $385 million. Gate TradFi's weekly trading volume remained around $115 billion, while Gate's stock trading showed a structure of "US stocks dominating, Korean stocks rebounding rapidly."
• DEX weekly volume fell 5.2%, but Uniswap V4, Aerodrome, and others saw localized growth; Robinhood Chain has contributed roughly 60% of Uniswap's weekly protocol revenue, as capital began paying more attention to whether trading flow can be converted into protocol revenue, buybacks, and long-term value.
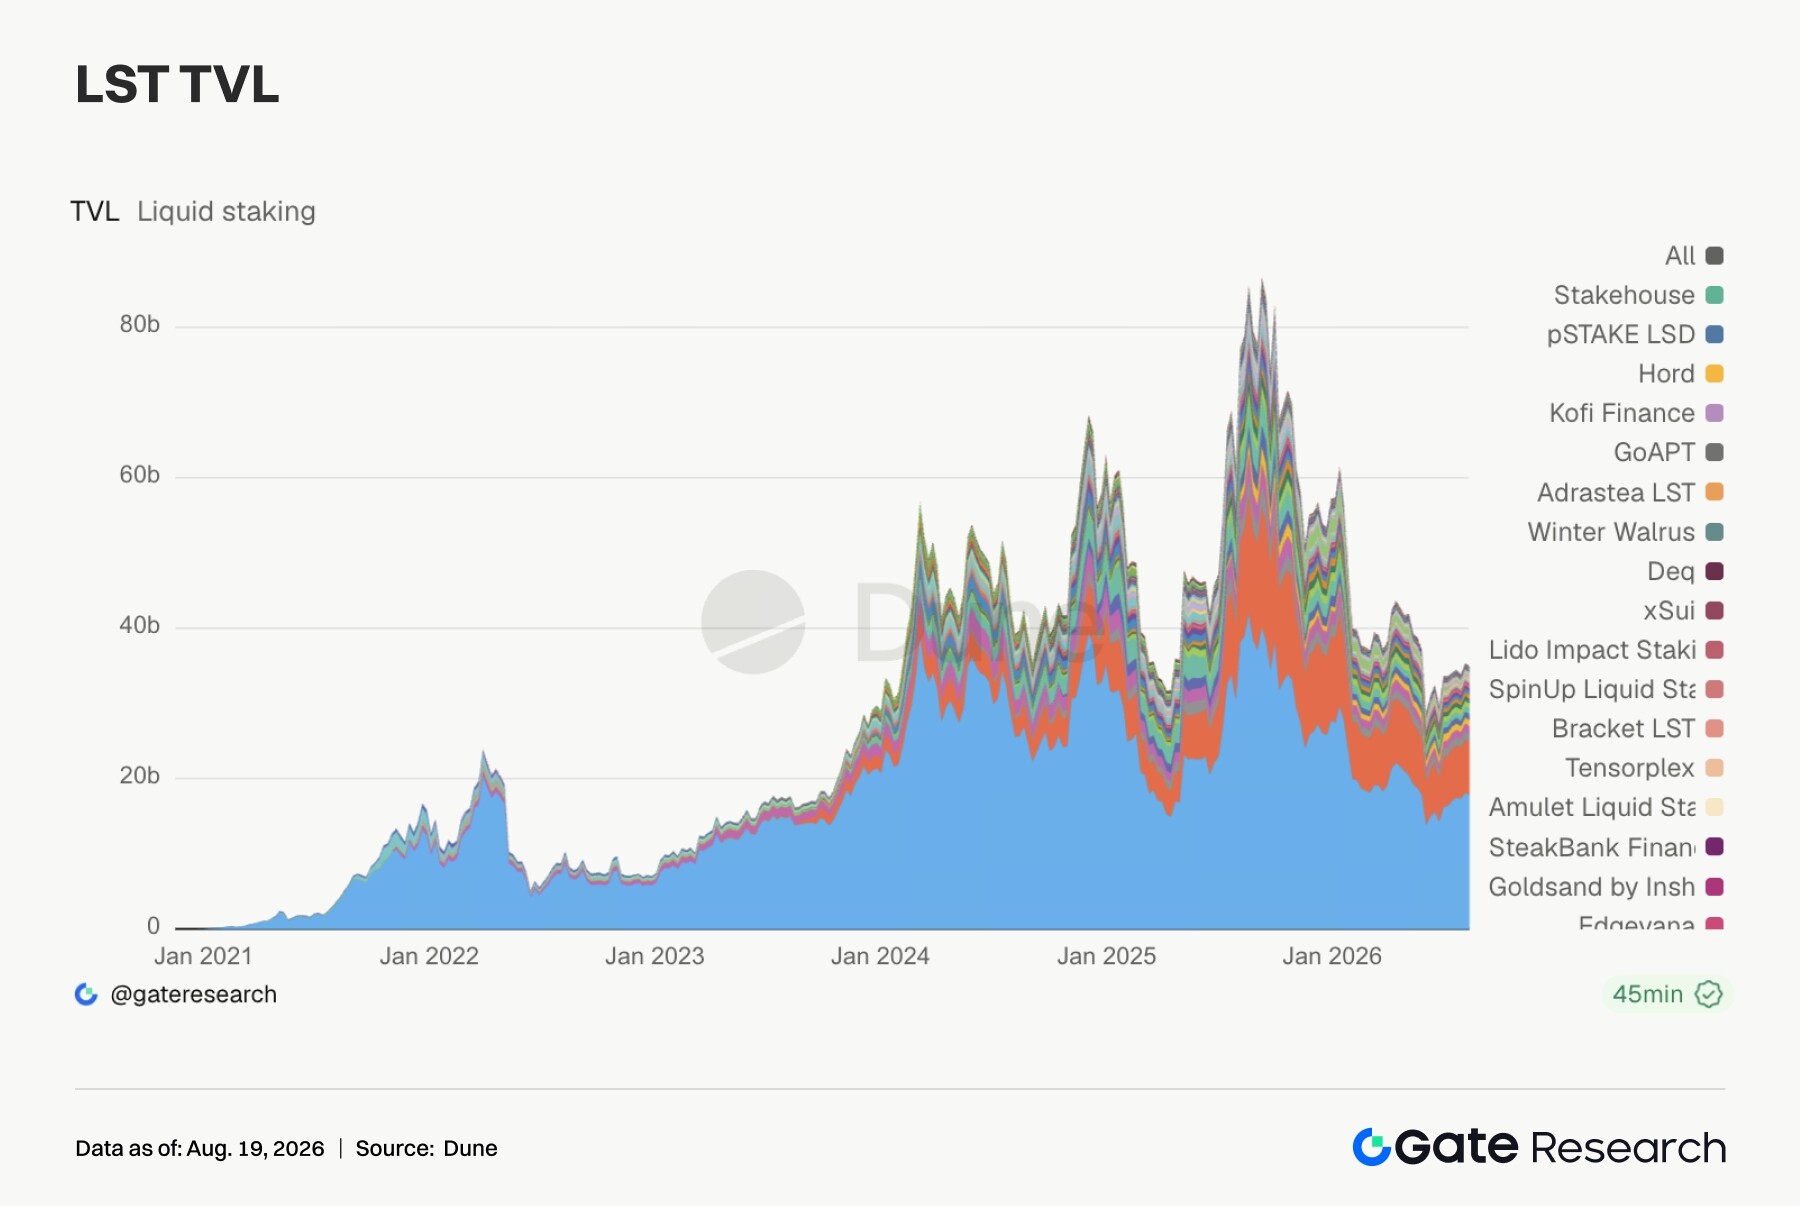
• DeFi leverage remained cautious, with capital concentrating in high-yield scenarios. Aave's borrow balances and funding rates were overall stable, with no broad-based leverage expansion yet; ETH and SOL LSTs broadly corrected, while kHYPE and stHYPE grew against the trend. New stablecoin supply also flowed more toward incentive, compliance, and institutional distribution channels.
• BTC declined but OI instead rose to approximately $12.3 billion with funding rates persistently positive, forming a combination of "falling price, elevated OI, positive funding rate." A drop below $62,500 would warrant caution over concentrated long deleveraging.
• The Put/Call Ratio for end-of-August options rose to 1.9, and the 25D Skew briefly fell to -8.12 before clearly recovering; DVOL spiked and then fell back to around 35, indicating increased short-term defensive demand while medium- to long-term positioning remained bullish, with overall volatility expectations staying moderate.
1. Market Focus Interpretation
Last week (August 10 – August 16, 2026), US inflation and consumption data together reinforced the trading logic of "cooling inflation, slowing growth." July CPI rose 0.1% MoM and 3.4% YoY, while core CPI rose 0.2% MoM and 2.5% YoY; the subsequently released PPI was flat MoM and core PPI rose 0.2%, further easing market concerns about the continued spread of cost pressures. Cooling rate-hike expectations pushed US Treasury yields lower and supported growth stock valuations. The S&P 500 rose 0.4% for the week, the Nasdaq gained 0.1%, while the Dow Jones fell 0.6%. However, July retail sales unexpectedly fell 0.6%, the largest decline in over a year, prompting the market to reassess the resilience of US consumption, and stocks pulled back from record highs on Friday. In commodities, the Iran situation and uncertainty over shipping through the Strait of Hormuz caused Brent crude to fluctuate sharply in the $87–$90 range, with the oil risk premium limiting upside room for bonds and risk assets. The crypto market failed to benefit in tandem from cooling inflation: growth concerns, oil price volatility, insufficient spot demand, and earlier profit-taking together weighed on BTC and ETH, which significantly underperformed US equities, reflecting capital's continued preference for more liquid traditional risk assets.
2. Liquidity Analysis
2.1 US Spot BTC ETFs Saw Combined Net Outflows of Approximately $385 Million
Last week, US spot BTC ETFs saw combined net outflows of approximately $385 million, a clear reversal from net inflows of $865 million the previous week. At the product level, Grayscale BTC saw net inflows of approximately $76 million, making it the best performer; FBTC saw net outflows of approximately $153 million, the largest outflow, while IBIT, GBTC, and ARKB also recorded net redemptions. Spot ETH ETFs saw combined slight net outflows of approximately $3 million, compared with net inflows of $244 million the previous week, with capital enthusiasm almost completely fading; Grayscale ETH topped the list with net inflows of approximately $15 million, while ETHA ranked last with net outflows of approximately $16 million.
BTC ETF AUM fell from approximately $78.510 billion to $75.706 billion, down about 3.57% MoM; ETH ETF AUM fell from approximately $10.130 billion to $9.944 billion, down about 1.84% MoM. The contraction in AUM was mainly driven by falling coin prices, with BTC also seeing more明显的 active redemptions. Overall, institutional sentiment shifted rapidly from active allocation in the previous week to defense: risk withdrawal from BTC was clearer, while ETH was close to capital neutrality, but neither showed signs of sustained accumulation yet.
2.2 TradFi Liquidity
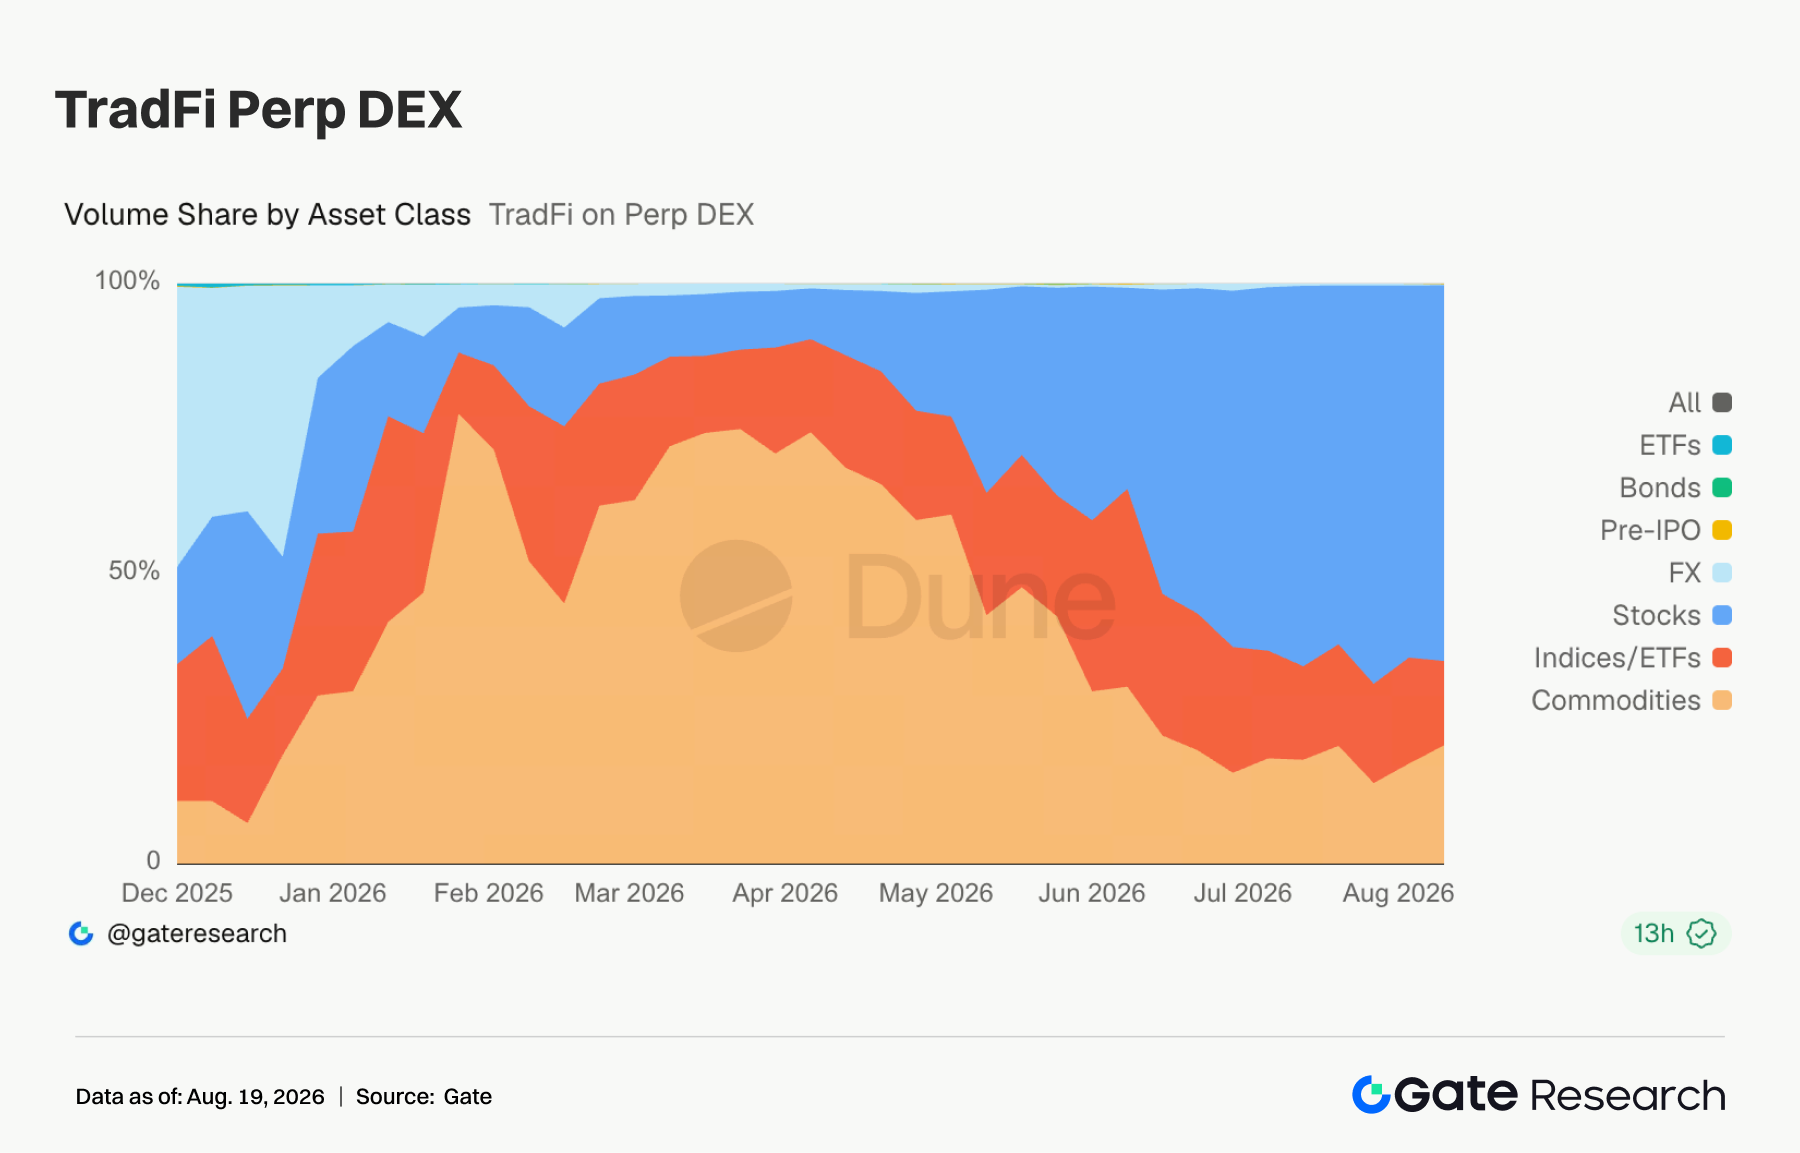
• TradFi Perp DEX: Over the past week, the trading structure of TradFi Perp DEXs across the market continued to concentrate markedly toward equity-like assets. In the chart, the share of stock trading remained at about 60%–70%, further rising from July to become the absolute main force; the share of commodities fell from once exceeding 60%–70% in the first half of the year to about 15%–20%, as the market's main line shifted from commodities such as gold and crude oil to equities. Index/ETF maintained a stable share of about 15%, while forex, bonds, and Pre-IPO accounted for relatively low shares.
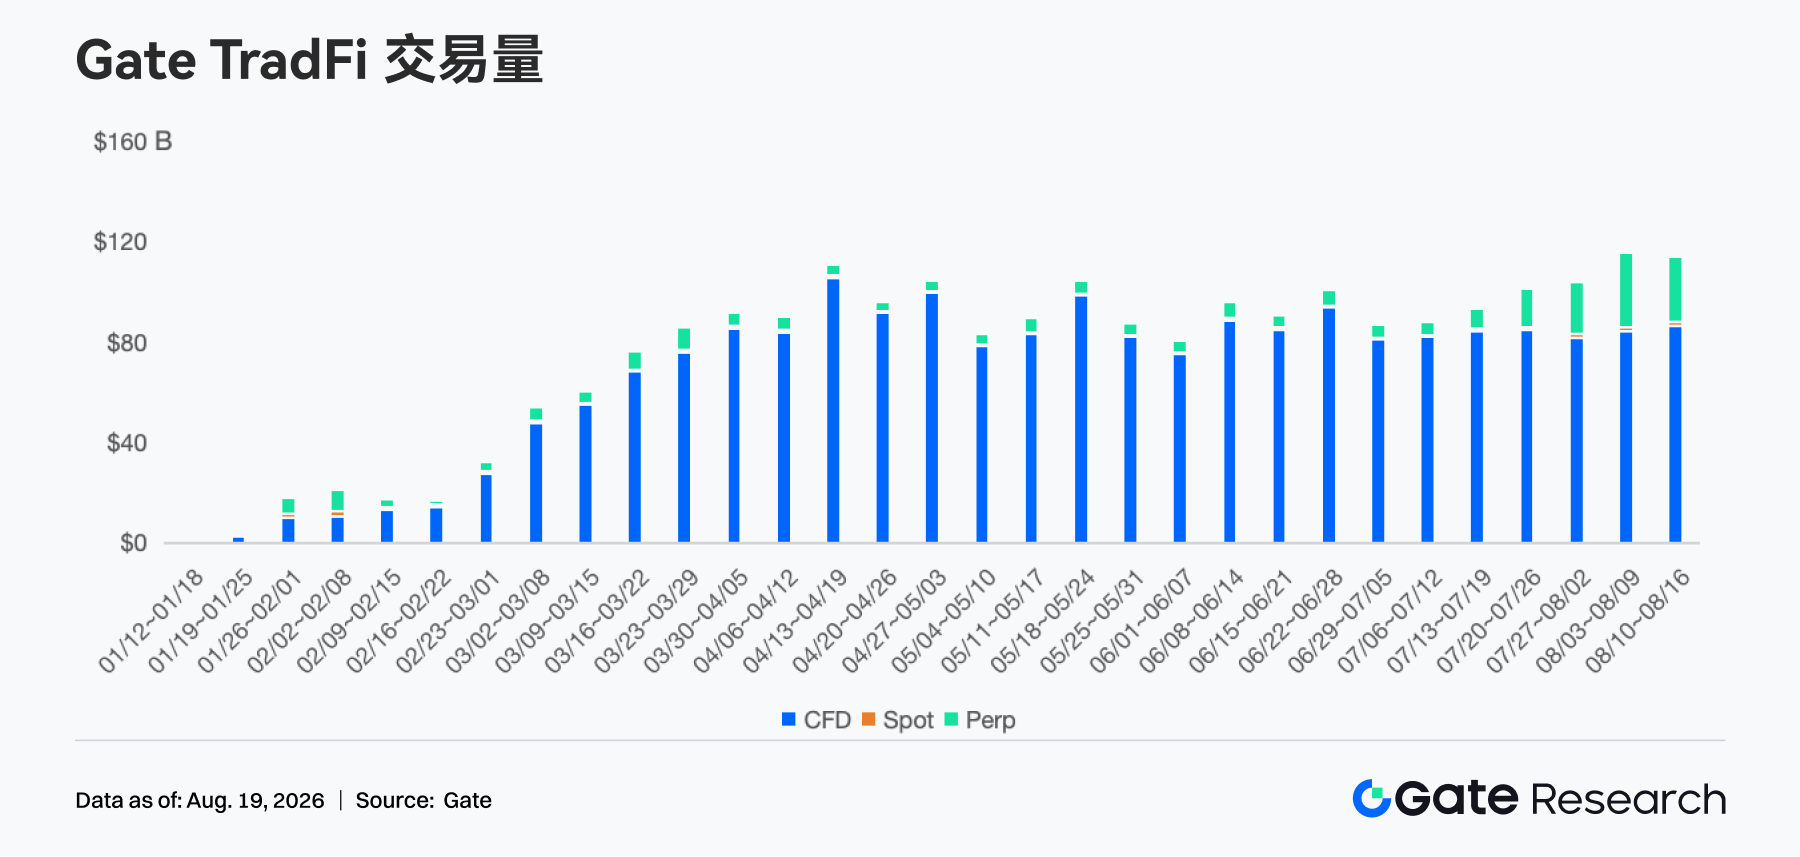
• Gate TradFi Trading Volume: Last week, Gate TradFi's trading scale continued to expand, with total trading volume rising to approximately $115 billion, roughly flat versus approximately $116 billion the previous week, but still at a recent high. Structurally, CFD remained the absolute main force, contributing approximately $87 billion, or about three-quarters; Perp continued rapid growth, rising to around $26 billion, with its share further increasing to over 20%, becoming the most obvious source of incremental growth recently; Spot remained relatively small. In recent weeks, total TradFi volume continued to climb from about $90 billion to above $110 billion, indicating that while the CFD base remained stable, perpetual contracts are becoming an important growth driver for diversifying the product structure.
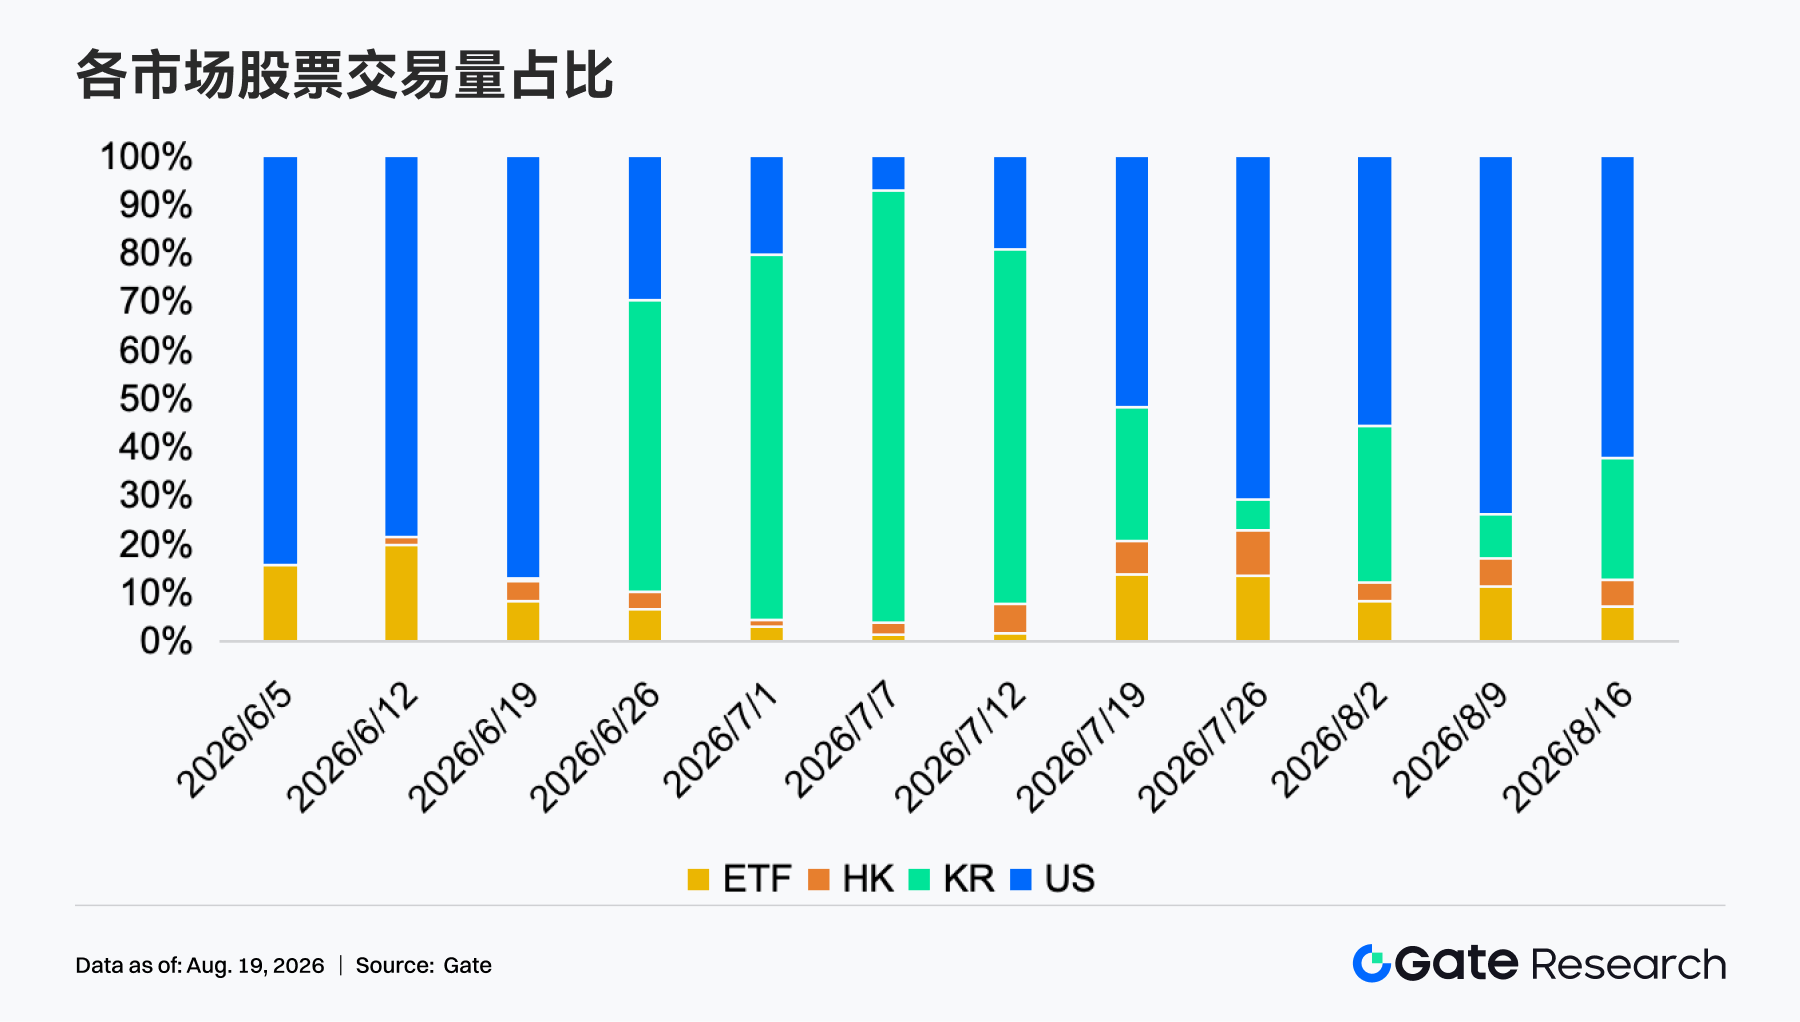
• Gate Stock Asset Trading Volume: Last week, Gate's stock trading structure shifted further toward Korean stocks compared with the previous week. The share of Korean stocks rose rapidly from about 9% to about 26%, becoming the main source of incremental capital; although US stocks still held absolute dominance at about 62%, this was a clear decline from about 74% the previous week. The ETF share fell from about 11% to about 7%, while Hong Kong stocks maintained a relatively low level of about 5%. Overall, stock trading is shifting from being highly concentrated in US stocks to a structure of "US stocks dominating, Korean stocks rebounding rapidly," indicating that capital is re-rotating among global technology and high-beta assets.
• TradFi Order Book Depth: We selected XAUT, the TradFi asset with the highest trading volume, to analyze its order book depth (Delta). XAUT's ±1% aggregated order book depth fluctuated significantly. During the price upswing on August 10, the liquidity Delta once rose to about +$3 million, with buying support strengthening markedly; on August 12–13, it quickly turned negative, reaching a low of nearly -$3.3 million, indicating clearly thicker selling at highs. After a brief recovery to about +$1.8 million on August 14, it fell again to about -$2.5 million on August 16. Notably, on August 17, as XAUT rebounded to around $4,400, Delta simultaneously turned positive and rose to about +$1 million, indicating that near-end buyer depth improved again. Overall, XAUT depth last week showed rapid switching between longs and shorts. While prices remained elevated, order book buying began to recover, but liquidity stability remained weaker than during a one-sided rally. Recently, gold prices have also been in a high range around $4,400.
3. On-Chain Data Insights
3.1 Robinhood Chain Heat Shifts Toward Value Capture; Uniswap V4 Grows Against the Trend but Overall Turnover Cools
This week, total DEX volume was approximately $37.296 billion, down 5.2% MoM. Uniswap fell about 17% MoM, with V3 down 32.9% and V4 up 2.7%, indicating that liquidity and new asset issuance activity brought by Robinhood Chain shifted from older versions to V4. Over the past seven days, Robinhood Chain contributed approximately $925,000 in Uniswap protocol revenue, accounting for about 60% of Uniswap's total revenue over the same period. PancakeSwap grew about 18.4% MoM, narrowing the gap with Uniswap; Aerodrome Slipstream grew 60.1%, with Base liquidity showing clear recovery. On the Solana side, cooling continued, with PumpSwap, Raydium, and Meteora falling 12.5%, 28.3%, and 23.1%, respectively. PumpSwap still had nearly $4 billion in weekly volume, but Pump.fun's own trading volume fell 21.1%, indicating that the recovery in PUMP price and social trading narrative did not translate into a broad expansion of the Meme spot market.
3.2 Stablecoin Total Roughly Flat, with New Supply Concentrated in Incentive, Compliance, and Institutional Distribution Channels
This week, total stablecoin scale increased by approximately $148 million MoM, a gain of less than 0.1%. USDT's scale was basically stable. USDC fell to approximately $71.958 billion, down 0.4% MoM. Structurally, USDS decreased by approximately $300 million, a decline of 4.5%, making it the main source of contraction; USDD grew 10.2% to approximately $1.507 billion, RLUSD grew 8.3% to approximately $1.716 billion, and USDe, BUIDL, and USDGO grew by approximately 1%, 1.2%, and 4.2%, respectively. USDD's expansion coincided with the Pendle sUSDD market adding TRX, USDD, and PENDLE incentives; RLUSD continued to enter Hong Kong institutional trading channels, with OSL HK already implementing zero fees on stablecoin trading pairs such as RLUSD/HKD. USD1 remained at approximately $4.024 billion this week. World Liberty obtained preliminary conditional approval from the OCC for its national trust bank application, providing a regulatory path for its stablecoin issuance, redemption, and custody infrastructure, but supply did not expand significantly following the news. The core theme for stablecoins this week was the continued concentration of capital into assets with yield incentives, payment gateways, and compliant distribution capabilities.
3.3 ETH and SOL LSTs Corrected in Tandem, While HYPE Staking Assets Expanded Against the Trend
ETH LST TVL broadly declined. Lido fell to approximately $17.833 billion, down 1.7% MoM; Rocket Pool fell to approximately $988 million, down 2.3%. The SOL side was similarly weak, with Sanctum Validator LSTs at approximately $1.114 billion, down 1.3%; Jupiter Staked SOL fell 2%. HYPE staking assets were the main exception. Kinetiq kHYPE TVL grew 6.1% to approximately $819 million, and stHYPE grew 12.2% to approximately $171 million, echoing HIP-3 open interest rising to a record high of $4.12 billion, as capital was willing to retain yield-bearing HYPE exposure within the Hyperliquid ecosystem. In addition, Lido launched the NEST automatic buyback mechanism this week. Once annualized staking revenue exceeds $40 million, 50% of the excess will be used to buy back LDO, with an initial annual cap of $10 million. LST competition is shifting from simply competing for staking scale to protocol revenue and governance token value capture.
3.4 Aave Total Borrowing Scale Edged Down; V4 Product Growth Has Not Yet Translated into Broad Leverage Expansion
Aave's Ethereum market borrow balance was approximately $8.870 billion, down 0.3% MoM; Plasma, Base, and Arbitrum fell 1.3%, 0.6%, and 0.6%, respectively. Mantle fell 7.2% to approximately $108 million, making it the main contracting market. Monad grew 7.6% against the trend to approximately $315 million, surpassing Base to become Aave's third-largest borrowing market after Ethereum and Plasma. Meanwhile, Aave V4 deposits surpassed $400 million this week, a record high; V4 also integrated Pendle PT-USDG looping, enabling loop operations to be priced based on全 Hub utilization, avoiding a single position rapidly pushing up its own funding costs. Aave's current growth is first reflected in V4's ability to absorb new products and new markets. Capital remains concentrated in the Ethereum main market, and Monad's growth has obvious characteristics of expansion from a high base, not yet enough to change the overall cautious pattern of multi-chain lending.
3.5 Aave Funding Costs Remain Low; USDC Average Rate Falls but Tail Peaks Persist
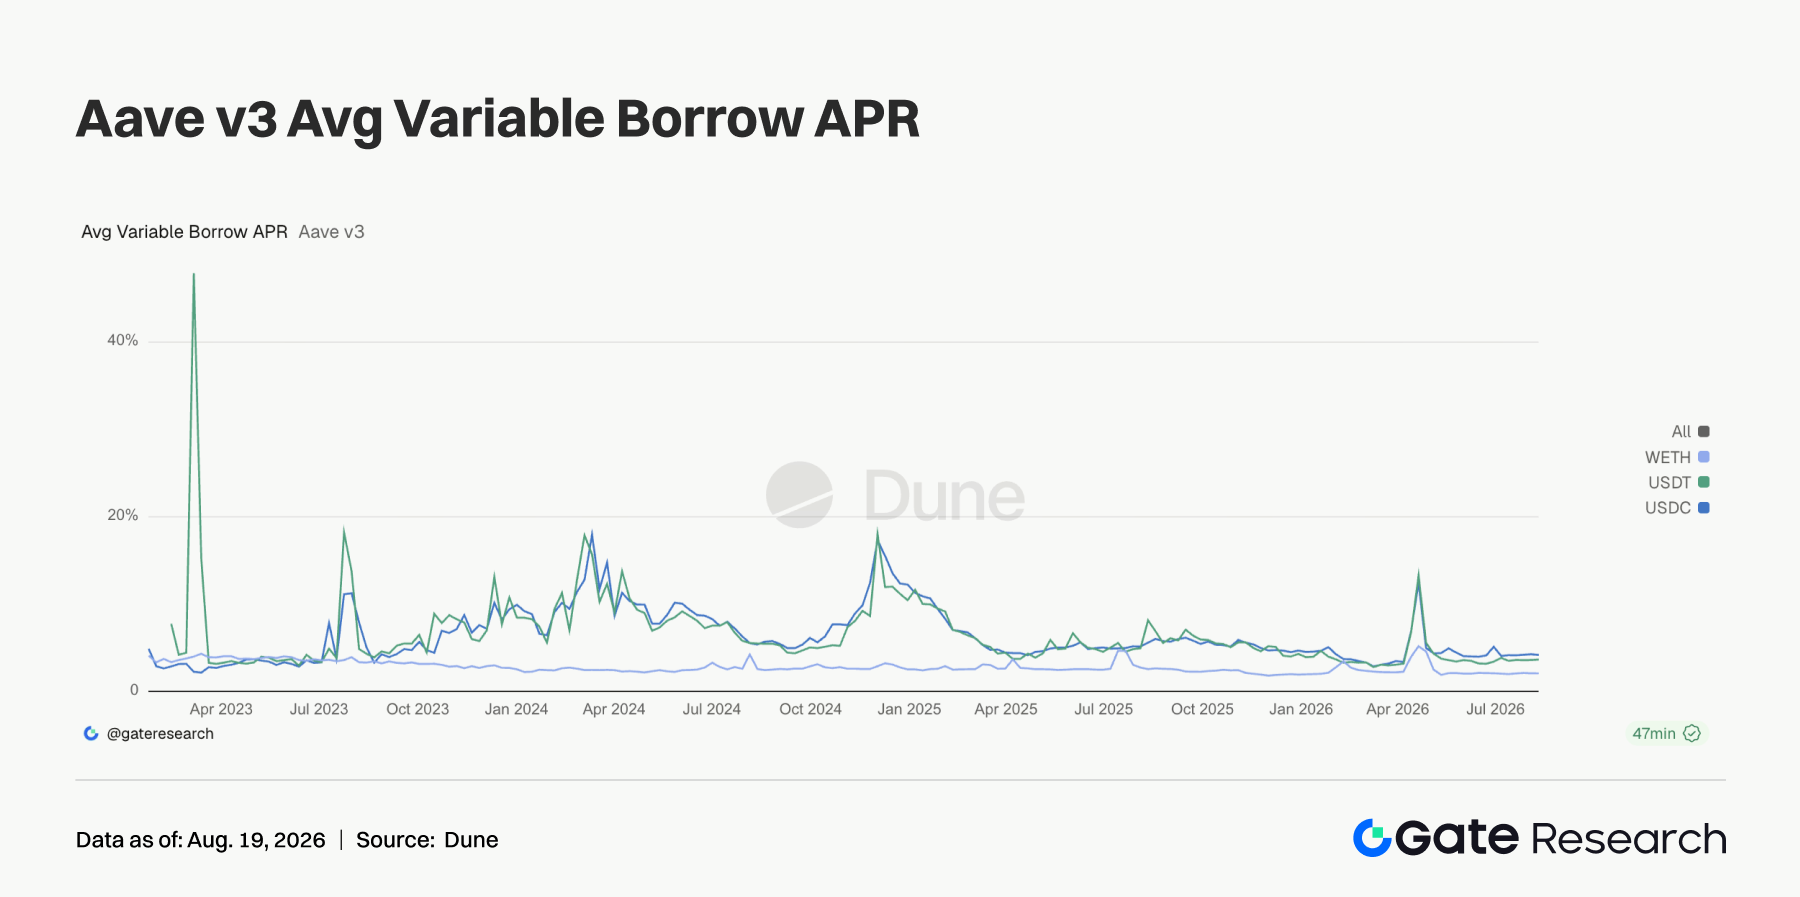
This week, Aave's average USDC borrow rate fell from 4.30% to 4.21%, WETH edged down from 2.11% to around 2.11%; USDT rose from 3.64% to 3.69%, a limited change. USDC's weekly high rate approached 14%, with utilization spikes still occurring at certain times or in certain markets, but average funding costs did not rise in tandem. After Aave V4 deposits surpassed $400 million and the PT-USDG looping strategy launched, borrow rates remained stable, with new product demand not yet causing a scramble for capital. The current rate environment is suitable for looping, fixed-income splitting, and market-neutral strategies, while directional leverage demand remains restrained. The slight contraction in balances and low-rate environment reinforce each other, namely that Aave has resumed product expansion but has not yet entered a revenue acceleration phase driven by high utilization.
3.6 Protocol Revenue Continued to Diverge; Trading Heat Gives Way to Real Value Capture
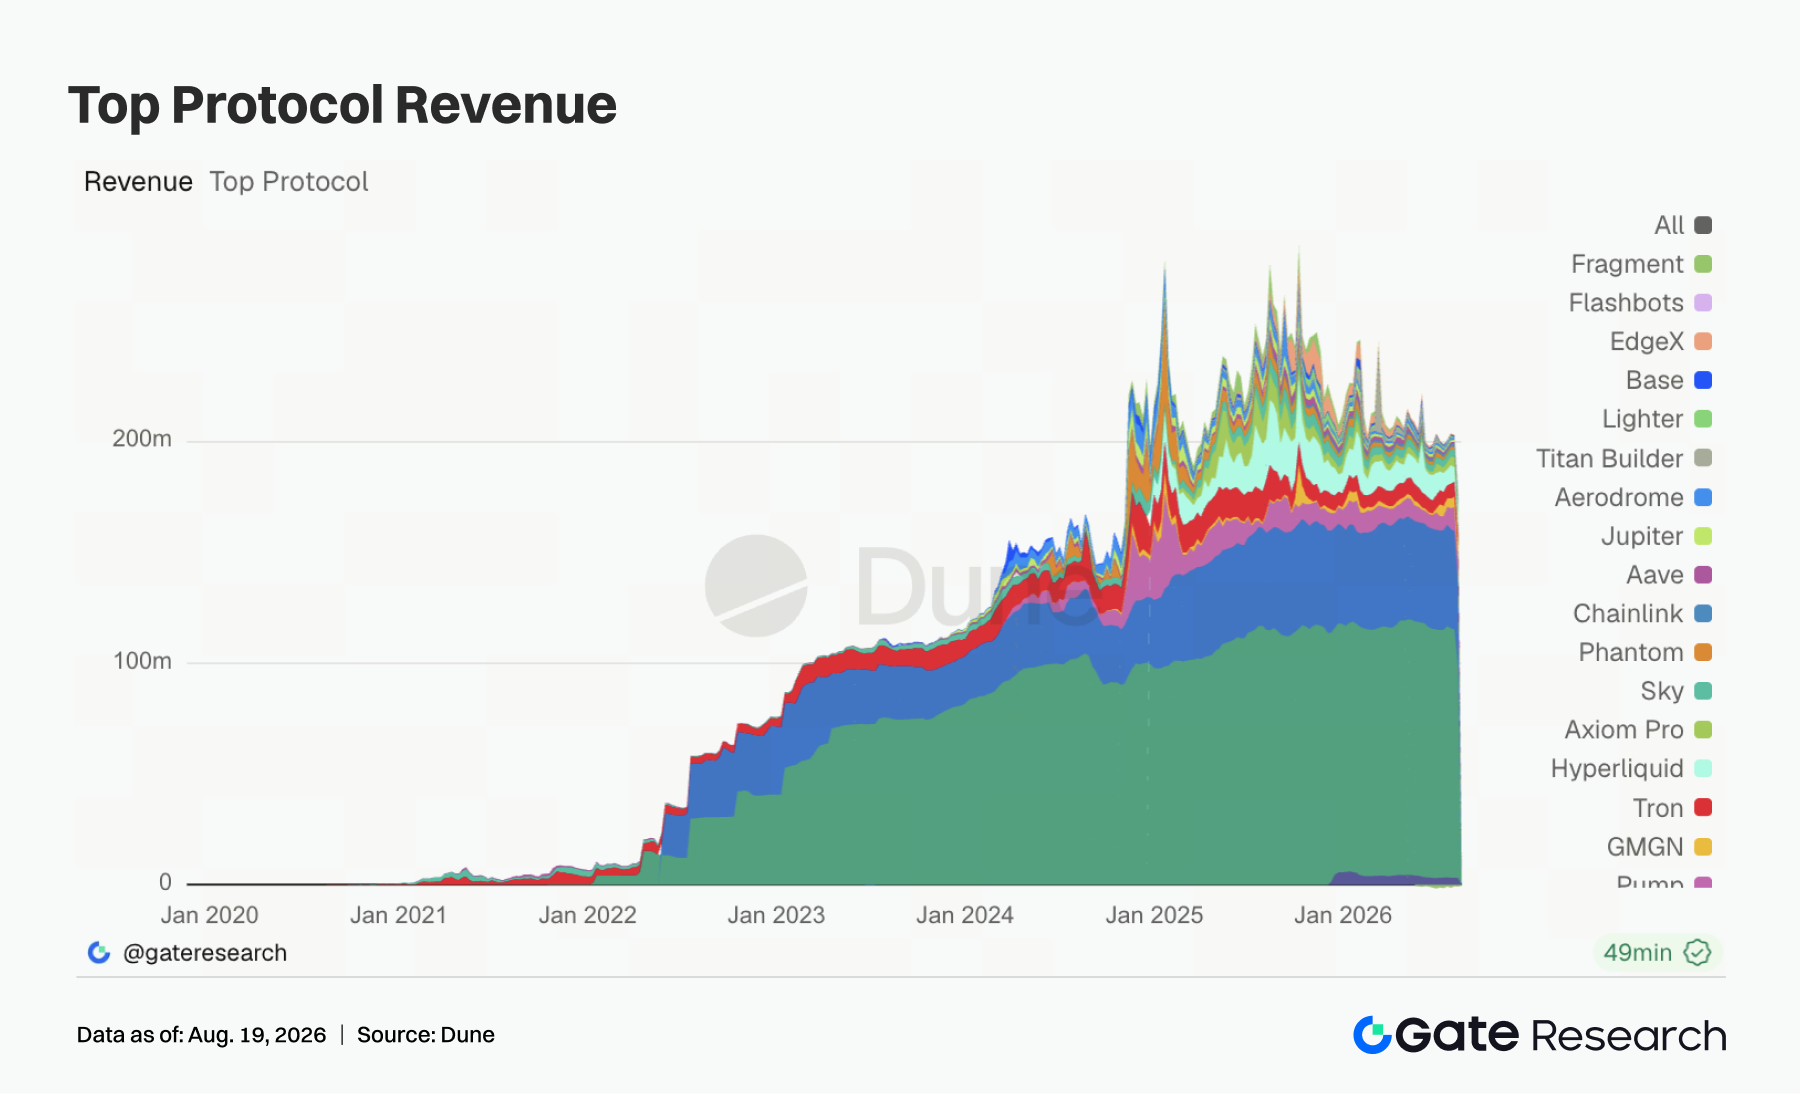
This week, Tether and Circle revenue was approximately $95.71 million and $38.02 million, respectively, down about 14.7% and 14.4% MoM. At the application layer, Pump revenue was approximately $10.16 million, down 5%, making it the highest-revenue on-chain application; PUMP rose nearly 20% over the same period, and despite the team and investors unlocking approximately 4.94 billion tokens worth about $13.6 million, the market continued to trade on its cash flow and buyback expectations. GMGN revenue grew 36.8% to approximately $6.61 million, becoming one of the few trading front-ends with clear expansion. Hyperliquid revenue fell 17.6% to approximately $5.3 million; although HIP-3 open interest hit a record high, external builders can receive up to 50% of trading fees, creating a structural divergence of growing trading activity and declining platform retained revenue. Aave revenue grew 3.8% to approximately $984,000, consistent with V4 deposits and product expansion. EdgeX revenue fell 65.4%, Jupiter fell 25.7%, while Titan Builder grew 21.6%. Whether traffic can be converted into protocol retention, token buybacks, or long-term liquidity is becoming a core metric for evaluating protocol quality.
4. Derivatives Tracking
4.1 BTC Price Fell but OI Remained High; Long Deleveraging Risk Under Positive Funding Rates Still Warrants Attention
Over the past week, BTC overall showed a volatile downward trend. It opened at approximately $64,900 on August 10 and briefly climbed to $65,400 during the week, but then gradually declined, closing near $62,900 on August 16, with a weekly low of approximately $62,500. The price failed to regain a firm footing above $64





