






Gate Institutional Weekly: Cooling September Rate Hike Expectations Lift BTC to Around $65K (August 3 – August 9, 2026)


- Key Takeaways: Last week, the crypto market was driven by weak U.S. employment data, which cooled September rate hike expectations and pushed Treasury yields lower, with tech stocks leading gains and improving risk appetite. On the capital front, spot BTC and ETH ETFs both swung from outflows to significant net inflows. TradFi trading expanded and migrated toward equity assets, while on-chain trading shifted toward structural rotation. Overall, the market is pricing in "moderate recovery with low volatility consolidation."
- Key Factors:
- U.S. July non-farm payrolls unexpectedly fell by 23,000, bringing the probability of a September rate hike down from roughly 55% to 44%. The 10-year Treasury yield dropped to 4.64%, while inflation remains above 3%. Markets are awaiting July CPI data to confirm the policy path.
- U.S. spot BTC ETFs recorded weekly net inflows of approximately $865 million (vs. $62 million in net outflows the prior week), with IBIT contributing about $694 million. ETH ETFs saw net inflows of roughly $244 million, expanding about 23-fold from the prior week, signaling institutional sentiment shifting from caution to synchronized accumulation of both core asset classes.
- TradFi perpetual trading structures continue to migrate from commodities to equities, with equity trading share rising to approximately 65%. Gate's total weekly volume approached $115 billion, hitting a new stage high, with Perp volume surging to nearly $30 billion as the core incremental driver.
- On-chain DEX trading pulled back from the pulse of Robinhood Chain launchpad activity. PancakeSwap led Uniswap with approximately $16.64 billion in volume. Stablecoin total market cap expanded slightly by 0.21%, with competitive focus shifting toward distribution, yield, and compliance use cases. Monad's borrowing balance grew approximately 35.9% week-over-week, becoming Aave's most notable incremental source.
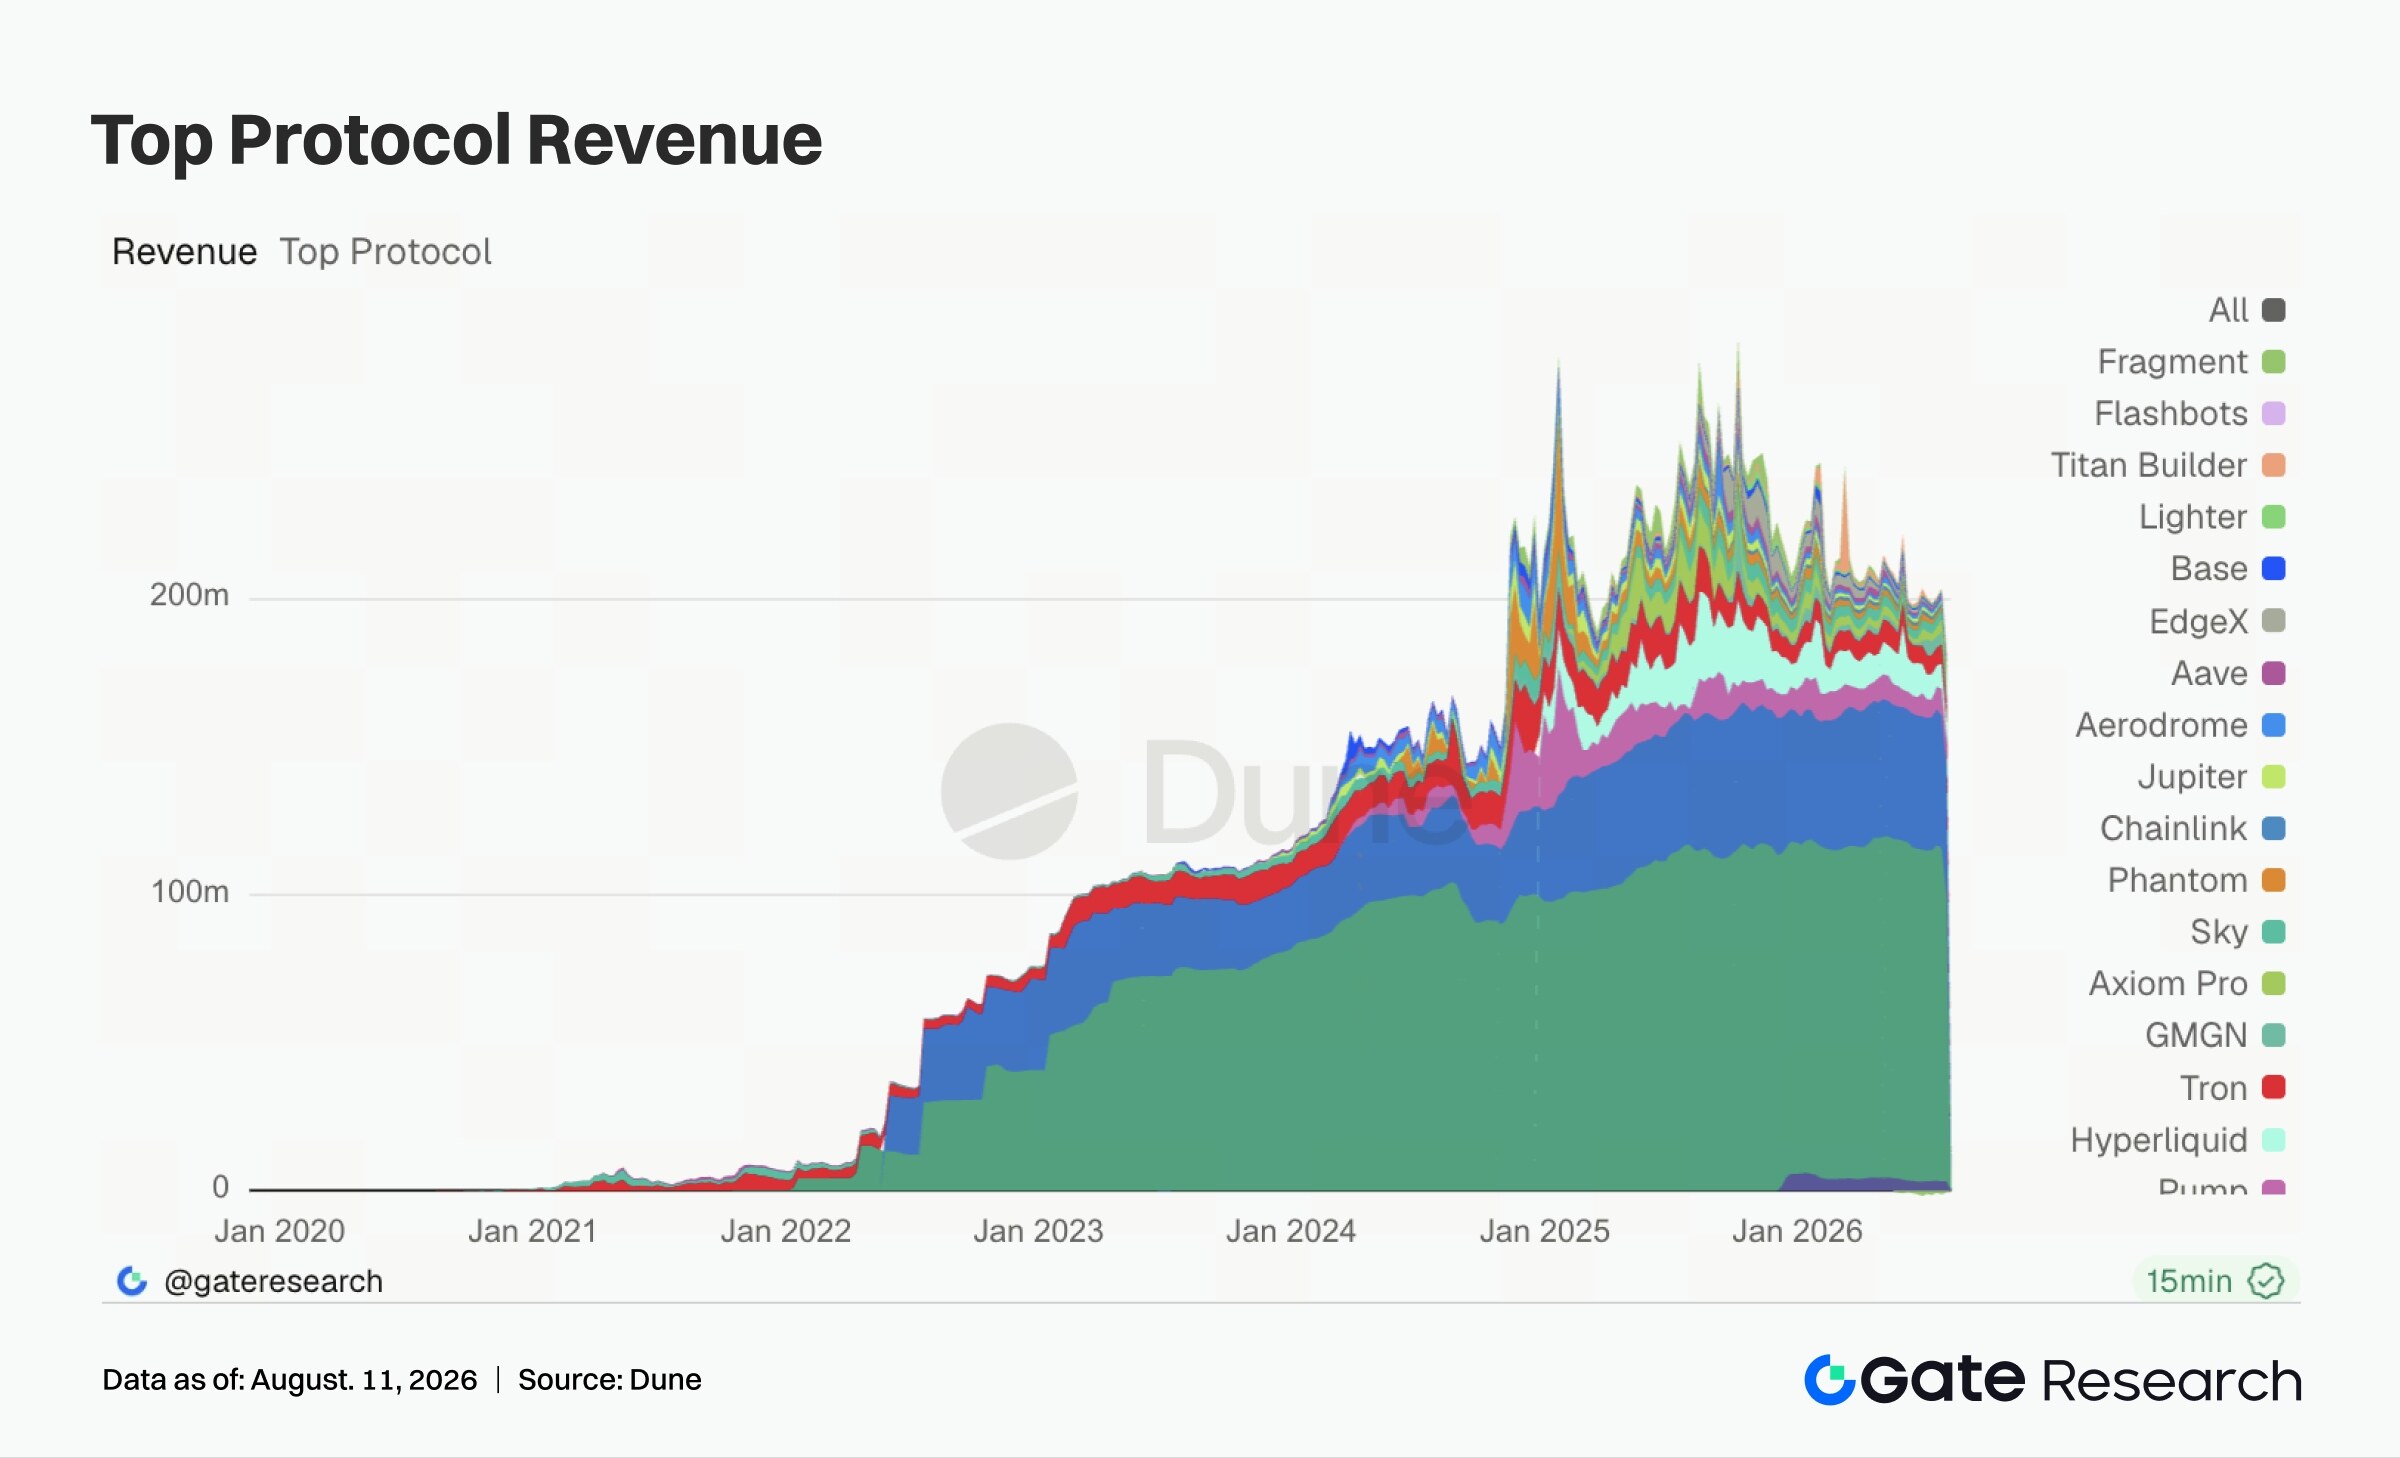
- Protocol revenues broadly cooled (Tether down 14.6% MoM, Hyperliquid down 22.8%), but front-end channels such as wallets, Meme platforms, launchpads, and aggregators showed greater resilience, with Phantom bucking the trend with growth of approximately 25%.
- BTC recovered to around $65K, with open interest increasing moderately and funding rates remaining positive without signs of crowding. The 25D options skew recovered from roughly -4 to -6 vol to about -3.6 vol, while DVOL held near the low end at 35. The market is pricing range-bound trading, and either a breakout above $65K or a loss of the $62K–$63K support zone could trigger a volatility repricing.
Executive Summary
• Weakening US employment data has cooled September rate hike expectations and pushed Treasury yields lower. US tech stocks led gains and transmitted risk appetite to the crypto market, but inflation remains above 3% and Middle East tensions persist. Upcoming CPI data will be a key variable in determining the policy path.
• US spot BTC and ETH ETFs recorded weekly net inflows of approximately $865 million and $244 million respectively, showing a clear improvement in capital flows and indicating institutions have shifted from caution to synchronized accumulation of both core crypto assets.
• TradFi trading continued to expand and migrate toward equity assets. Gate's weekly trading volume approached $115 billion, hitting a stage high; US equities regained dominance in stock trading, while XAUT depth volatility widened, reflecting simultaneous increases in on-chain trading activity and liquidity for traditional assets.
• On-chain trading shifted from speculative spikes in early-stage hotspots to structural rotation: PancakeSwap continued to lead Uniswap, while the Robinhood Chain launchpad craze cooled; stablecoins, LSTs, and Aave lending expanded modestly alongside improving risk appetite.
• Capital showed a preference for high-liquidity primary markets and emerging high-elasticity opportunities. Ethereum continued to underpin lending demand while Monad emerged as the primary incremental source; protocol revenues broadly declined, but user-facing gateways such as wallets, Meme platforms, launchpads, and aggregators demonstrated notable resilience.
• BTC recovered to near $65,000, with OI increasing moderately and funding rates remaining positive, indicating leveraged longs are returning but have not yet become crowded; options activity leaned bullish while medium-term protection positions remained in place.
• The 25D Skew recovered from approximately -4 to -6 vol to around -3.6 vol, while DVOL remained low near 35. The market continues to price in "moderate recovery, low-volatility consolidation." A breakout above $65,000 or a loss of the $62,000–$63,000 support level could trigger a volatility repricing.
1. Market Focus Analysis
Last week (August 3–9, 2026), market trends were jointly driven by US employment data, interest rate expectations, and Middle East tensions. The US July nonfarm payrolls unexpectedly declined by 23,000, significantly missing the market expectation of 87,000 job additions, while the unemployment rate fell from 4.2% to 4.1%. Prior months' employment data were also revised downward, signaling cracks emerging in labor demand. Following the data release, market expectations for a Fed rate hike in September cooled, with the probability dropping from approximately 55% the previous day to 44%. The 10-year US Treasury yield fell to 4.64% on Friday, down from around 4.75% the prior week. However, with inflation still above 3%, the slowing employment data alone is insufficient to completely eliminate the risk of further rate hikes, and the market continues to await July CPI data to confirm the policy direction.
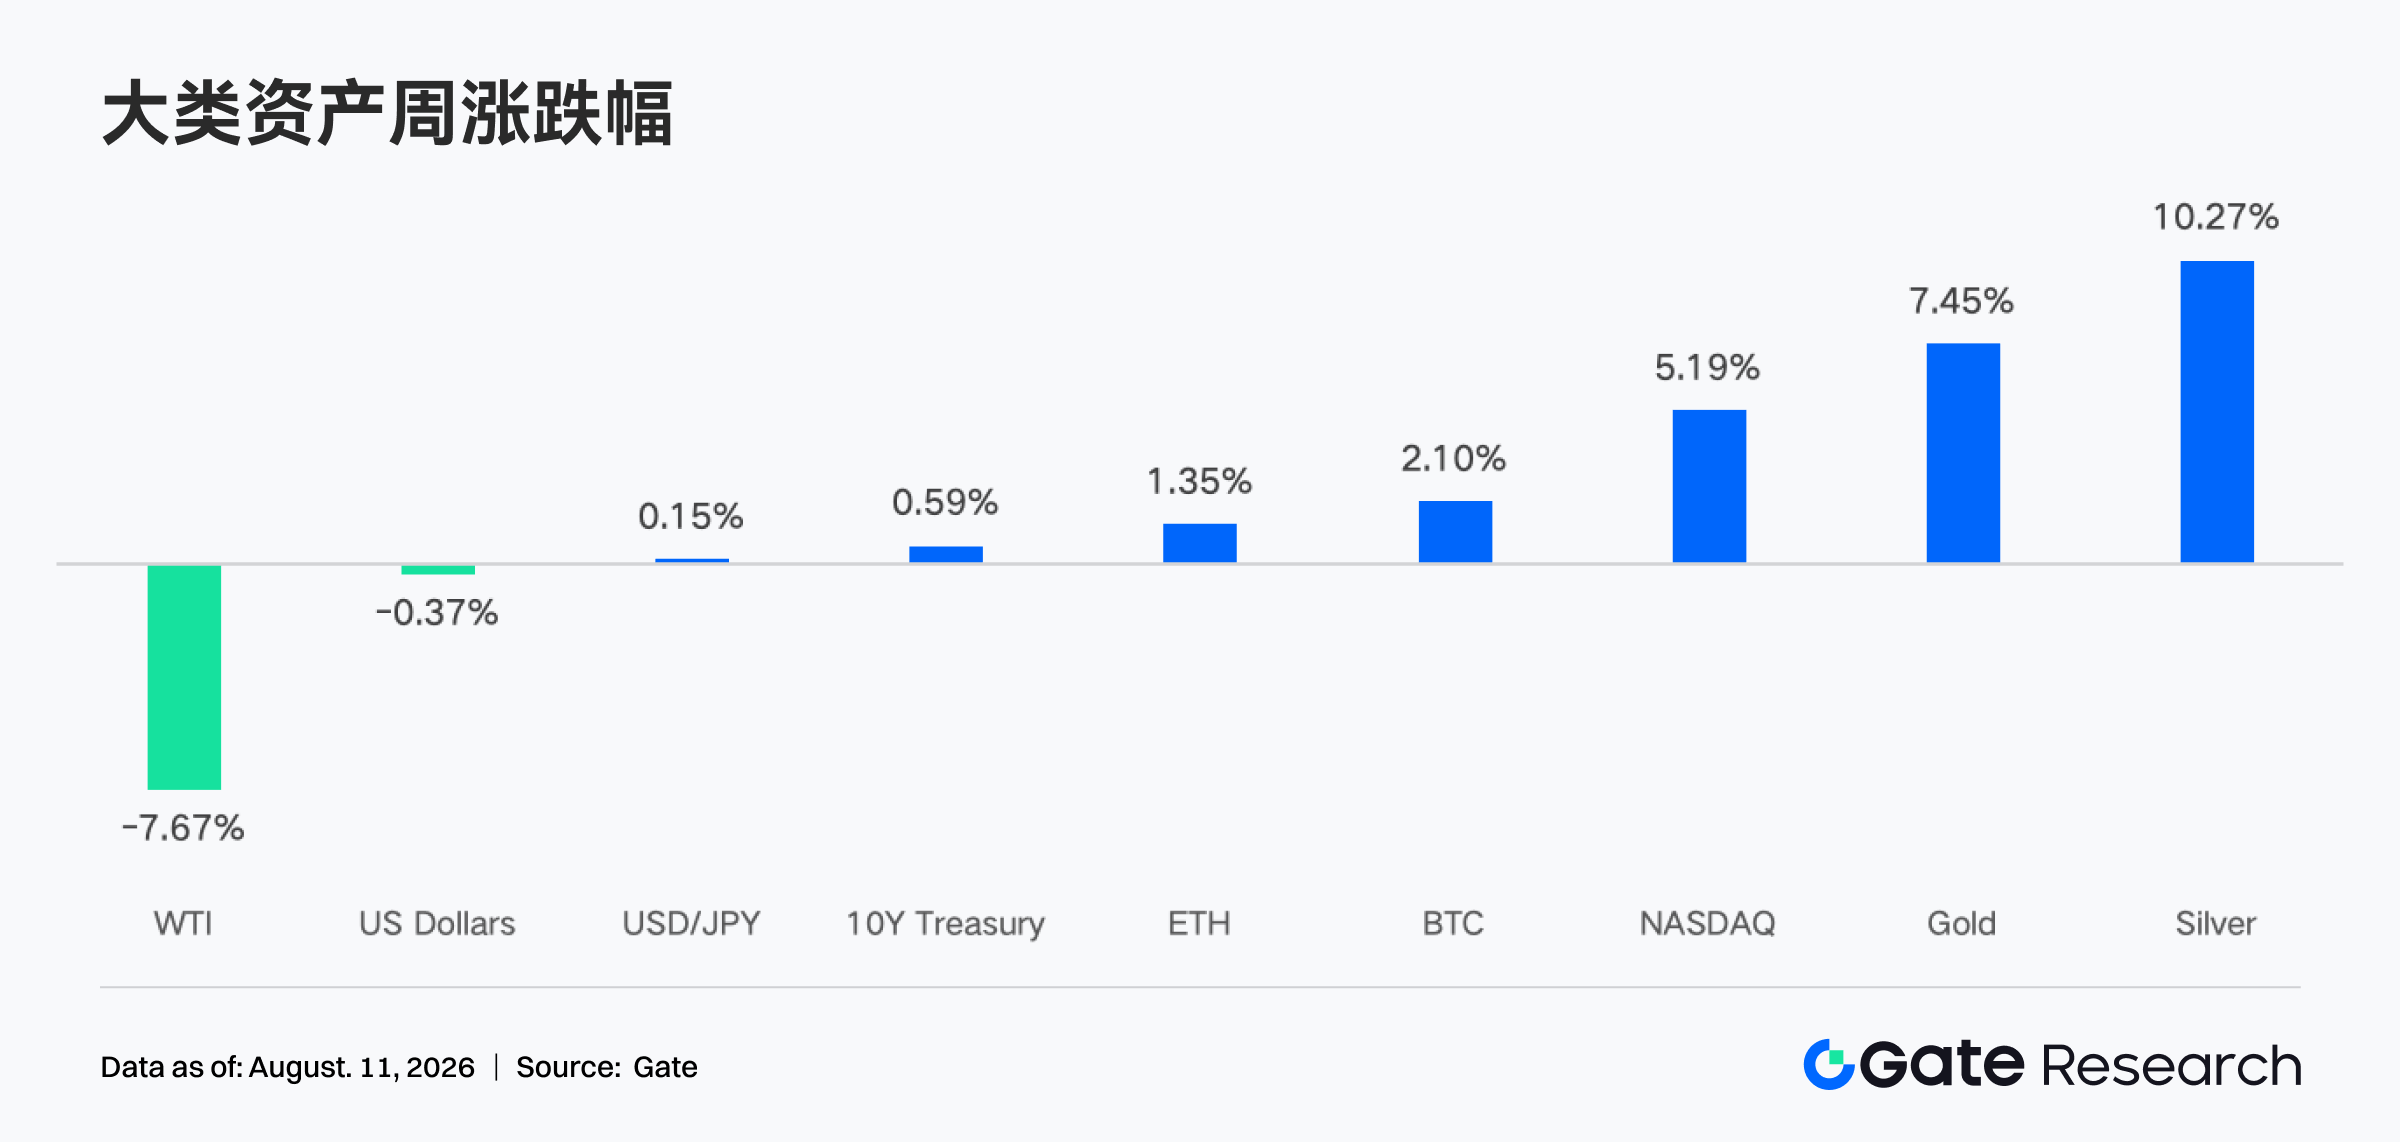
The "weak data, easing expectations" dynamic drove simultaneous gains in US stocks and Treasuries. Over the week, the S&P 500 rose 3.6%, the Dow Jones gained 3.0%, and the Nasdaq climbed 5.2%, with tech stocks leading the advance and pushing major indices to record highs. Falling bond yields also improved the discounting environment for high-valuation growth assets. In commodities, the US and Iran continued consultations over restoring transit through the Strait of Hormuz, reducing supply risk premiums, with WTI crude closing Friday at approximately $76.94. However, negotiation uncertainty kept oil prices relatively volatile. Improved risk appetite, easing dollar rate pressures, and tech stock gains transmitted to the crypto market, with BTC and ETH both rebounding over the week, though momentum slowed toward the weekend as investors awaited confirmation from inflation data.
2. Liquidity Analysis
2.1 Institutional Sentiment Shifts to Accumulation, IBIT Sees ~$694 Million Net Inflows
Last week, US spot BTC ETFs recorded total net inflows of approximately $865 million, reversing the prior week's net outflows of approximately $62 million, with positive flows sustained across all 5 trading days. IBIT led with net inflows of approximately $694 million, while HODL recorded the weakest performance with net outflows of approximately $58 million. ETH ETFs saw total net inflows of approximately $244 million, expanding roughly 23-fold from the prior week's approximately $10 million. ETHA led with approximately $203 million, while ETHE recorded net outflows of approximately $5 million, ranking last. Institutional subscriptions were notably concentrated in BlackRock products, but other BTC products also saw broader positive inflows, indicating risk appetite is not dependent on a single trading day.
As public channels lack precise full-market AUM data as of the same cutoff time on August 7, this report uses a proxy estimation methodology: using the previous estimated AUM as a baseline, adjusted for token price changes and weekly net subscriptions/redemptions. BTC ETF AUM rose from approximately $76.05 billion to $78.51 billion, an increase of approximately 3.23% WoW. ETH ETF AUM increased from approximately $9.75 billion to $10.13 billion, up approximately 3.85% WoW. Both ETF categories experienced simultaneous capital inflows and asset price appreciation, indicating that institutional sentiment has clearly shifted from caution to accumulation. BTC demonstrates stronger absolute capital absorption, while ETH shows greater relative improvement, reflecting a pattern of risk appetite spreading synchronously across both core crypto assets.
2.2 TradFi Liquidity
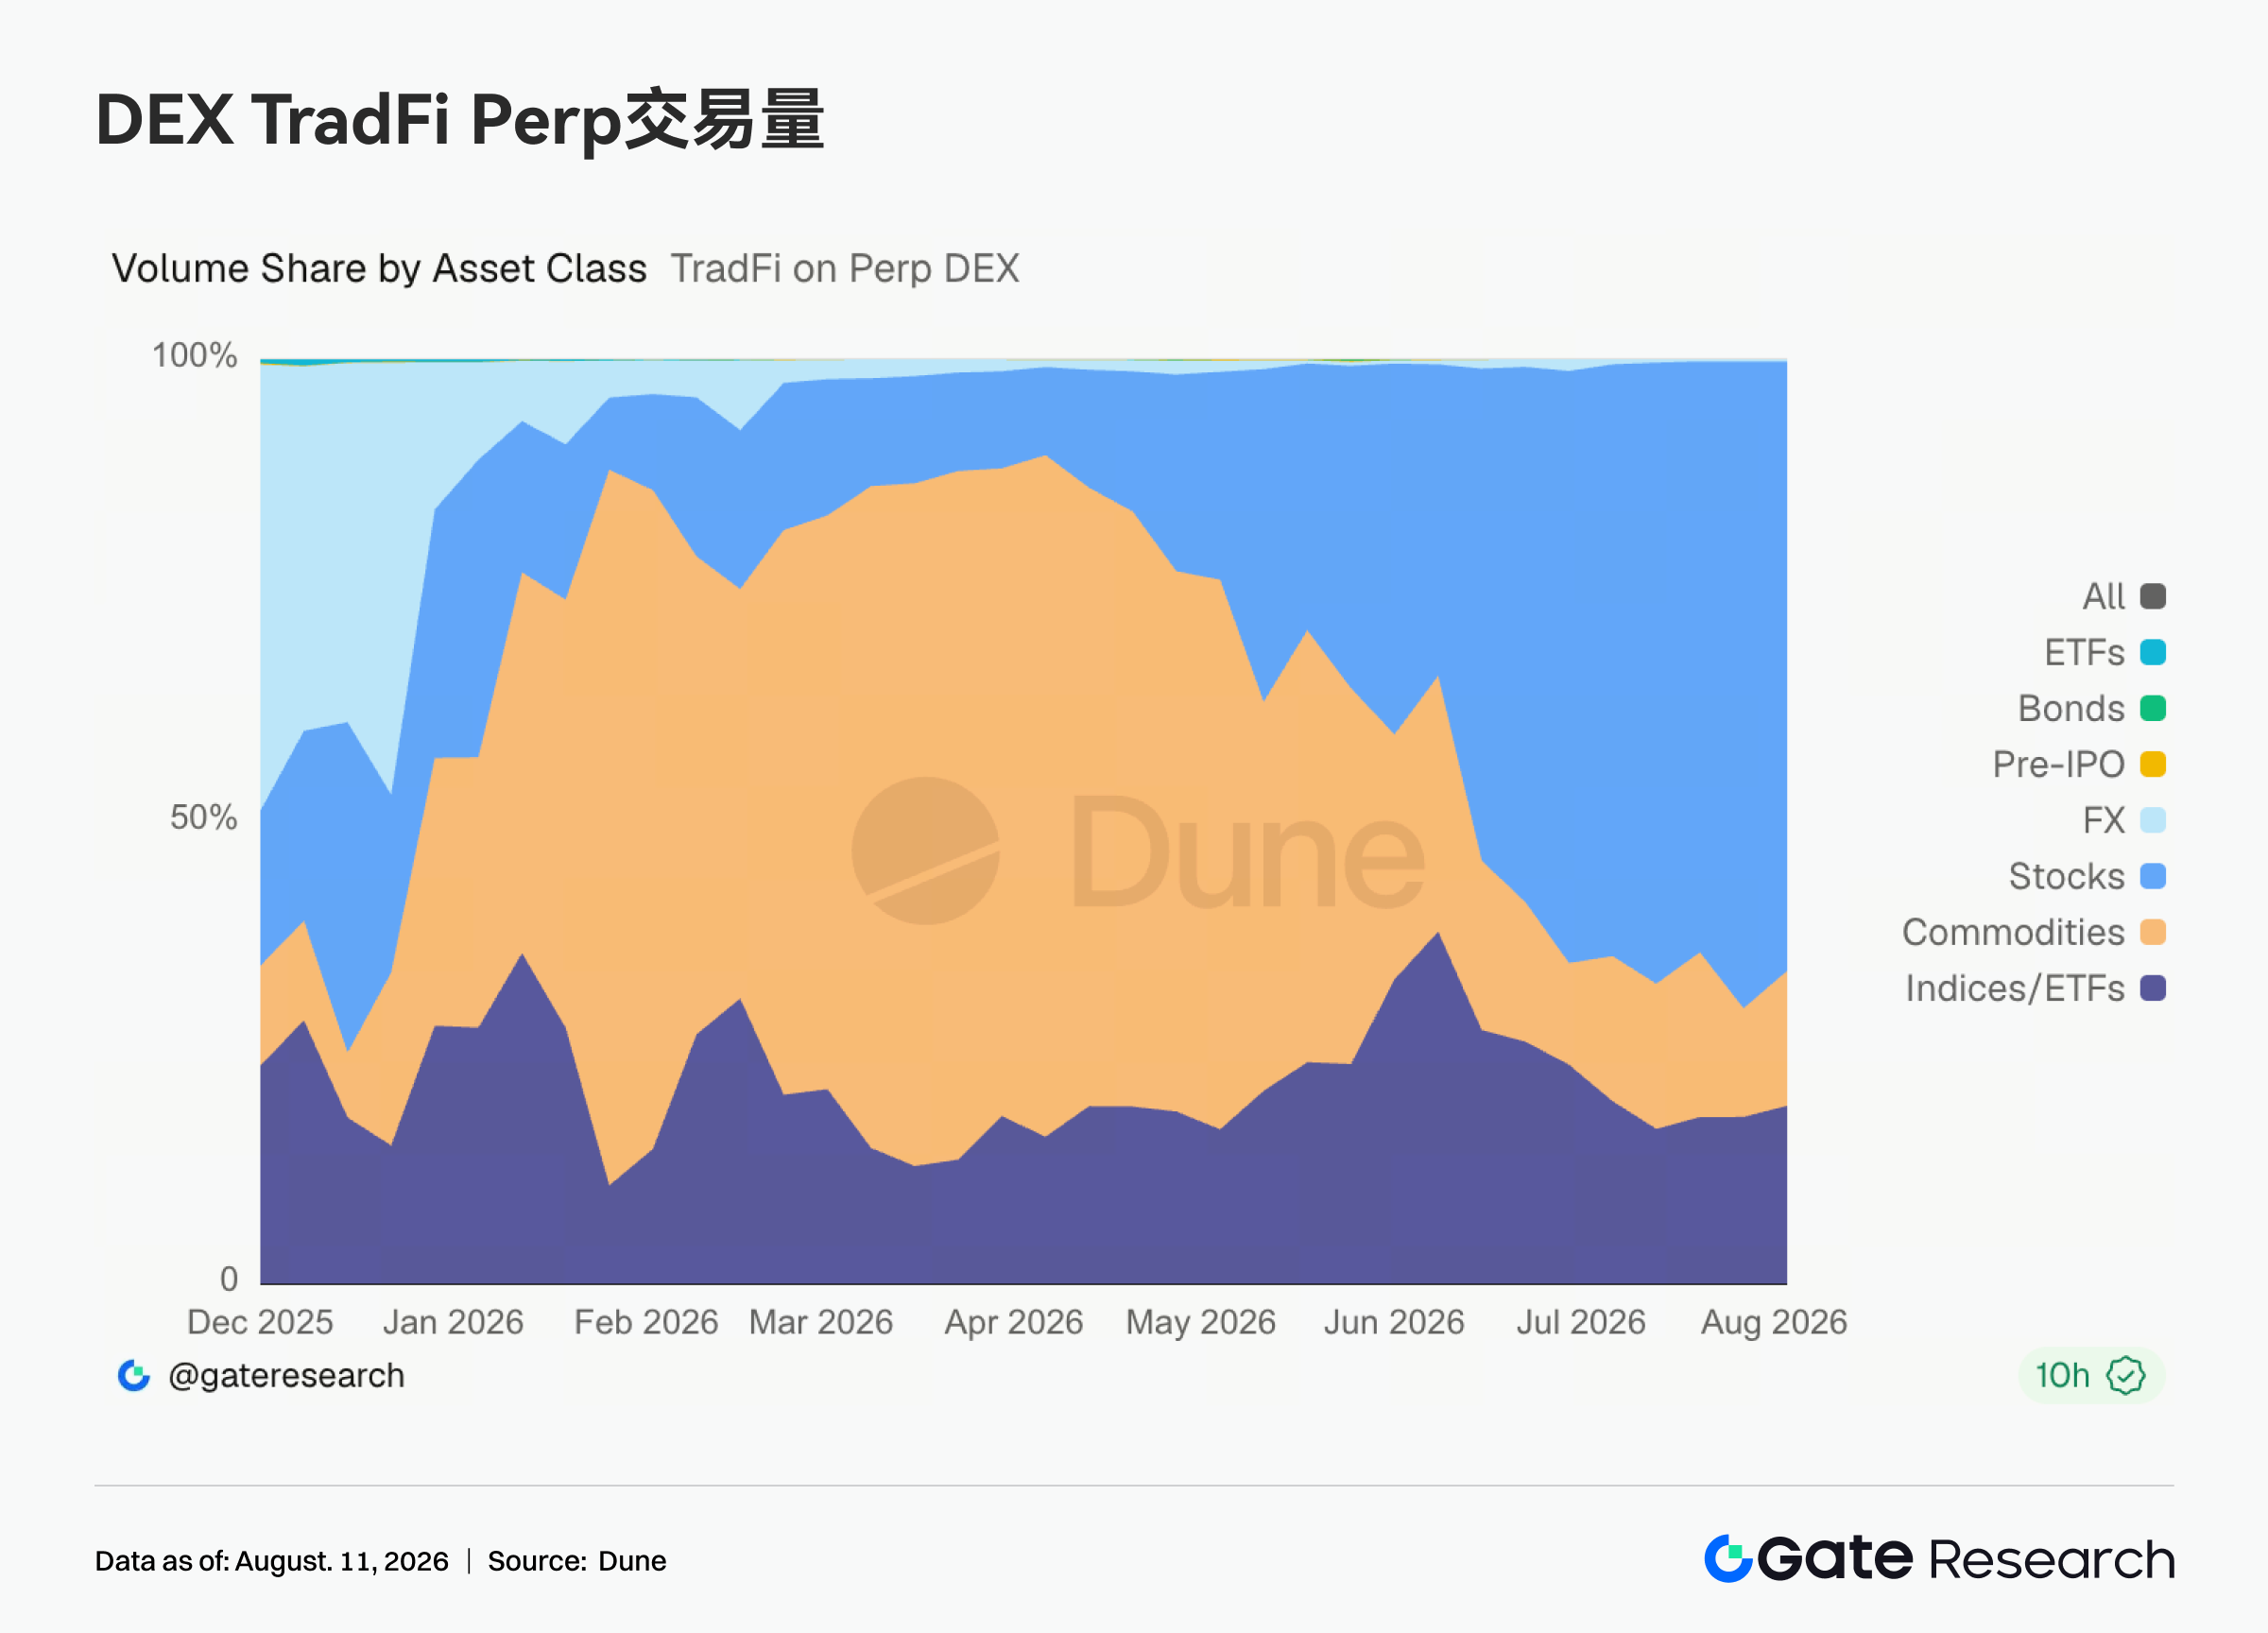
• TradFi Perp DEX: Over the past week, the structure of TradFi perpetual trading across crypto platforms continued its migration from commodities to equities. As shown in the chart, equity trading share rose to approximately 65% in early August, further expanding from July to become the largest asset class. Commodities fell to approximately 15%, significantly cooling from the 70%–80% highs seen in Q1. Index/ETF share remained relatively stable at approximately 20%. This structural shift indicates that the growth driver for TradFi Perps has gradually transitioned from gold, silver, and crude oil at the start of the year toward global equity assets. At the industry level, 2026 TradFi perpetual cumulative trading volume has reached the trillion-dollar scale, with exchanges continuously expanding equity, index, and commodity contracts, suggesting that crypto derivatives are becoming a new gateway for 24/7 trading of traditional assets.
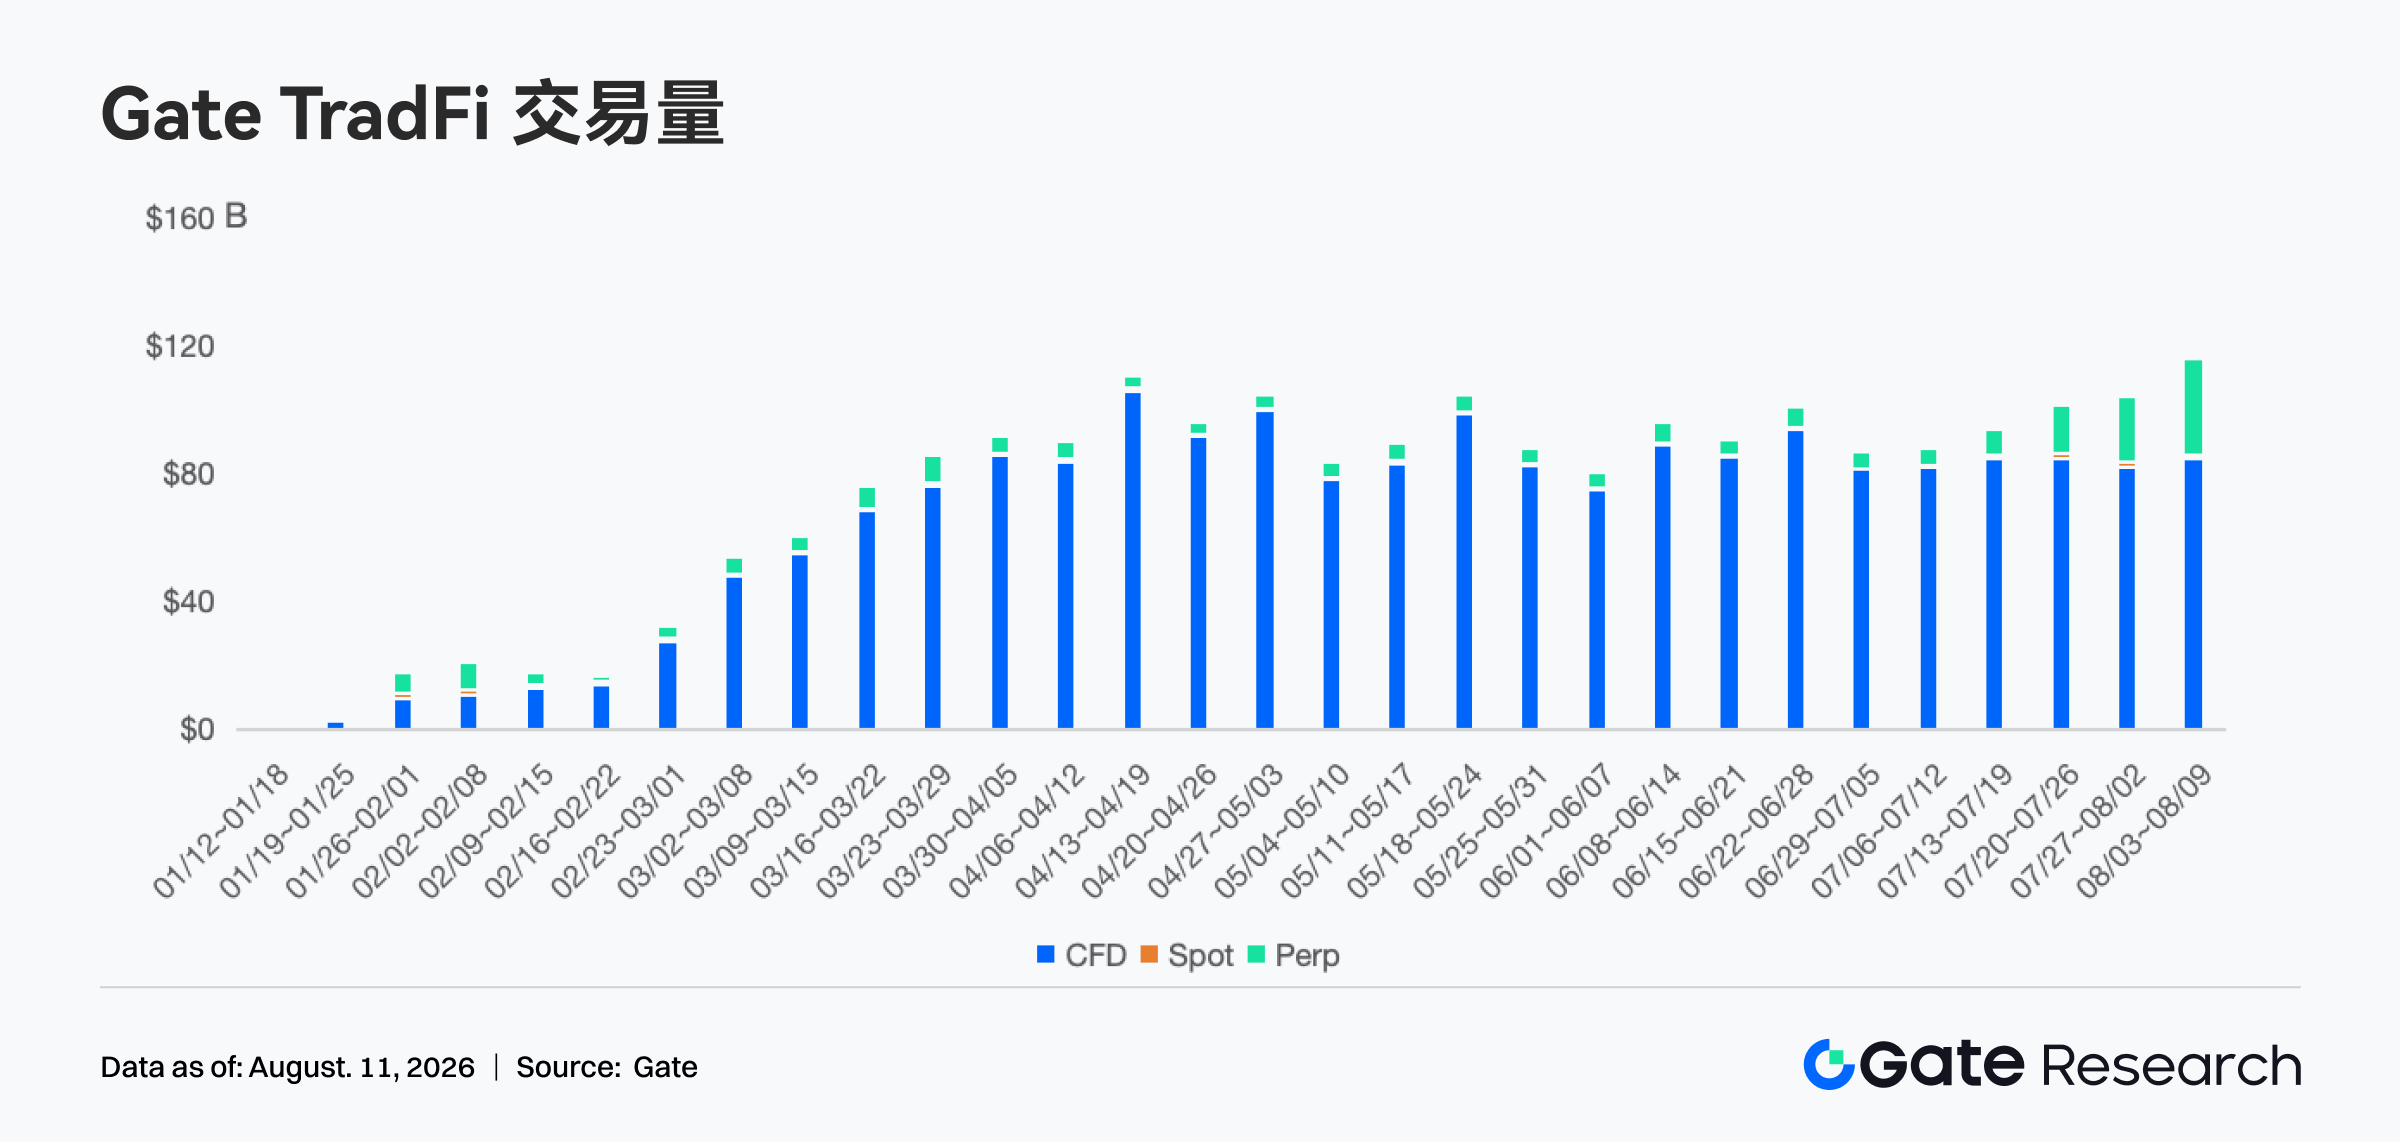
• Gate TradFi Trading Volume: Over the past week, Gate's TradFi trading volume expanded further, with total volume from August 3–9 approaching $115 billion, up approximately 12% from the prior week's approximately $103 billion, setting a new high for the charted period. CFD still contributed approximately $85 billion in volume as the platform's primary trading source, though its share declined. Perp volume surged to nearly $30 billion, becoming the core driver of weekly growth, while Spot contribution remained relatively small. Overall, while TradFi maintains a solid CFD base volume, growth momentum is spreading toward perpetual contracts, further enriching the derivatives trading structure.
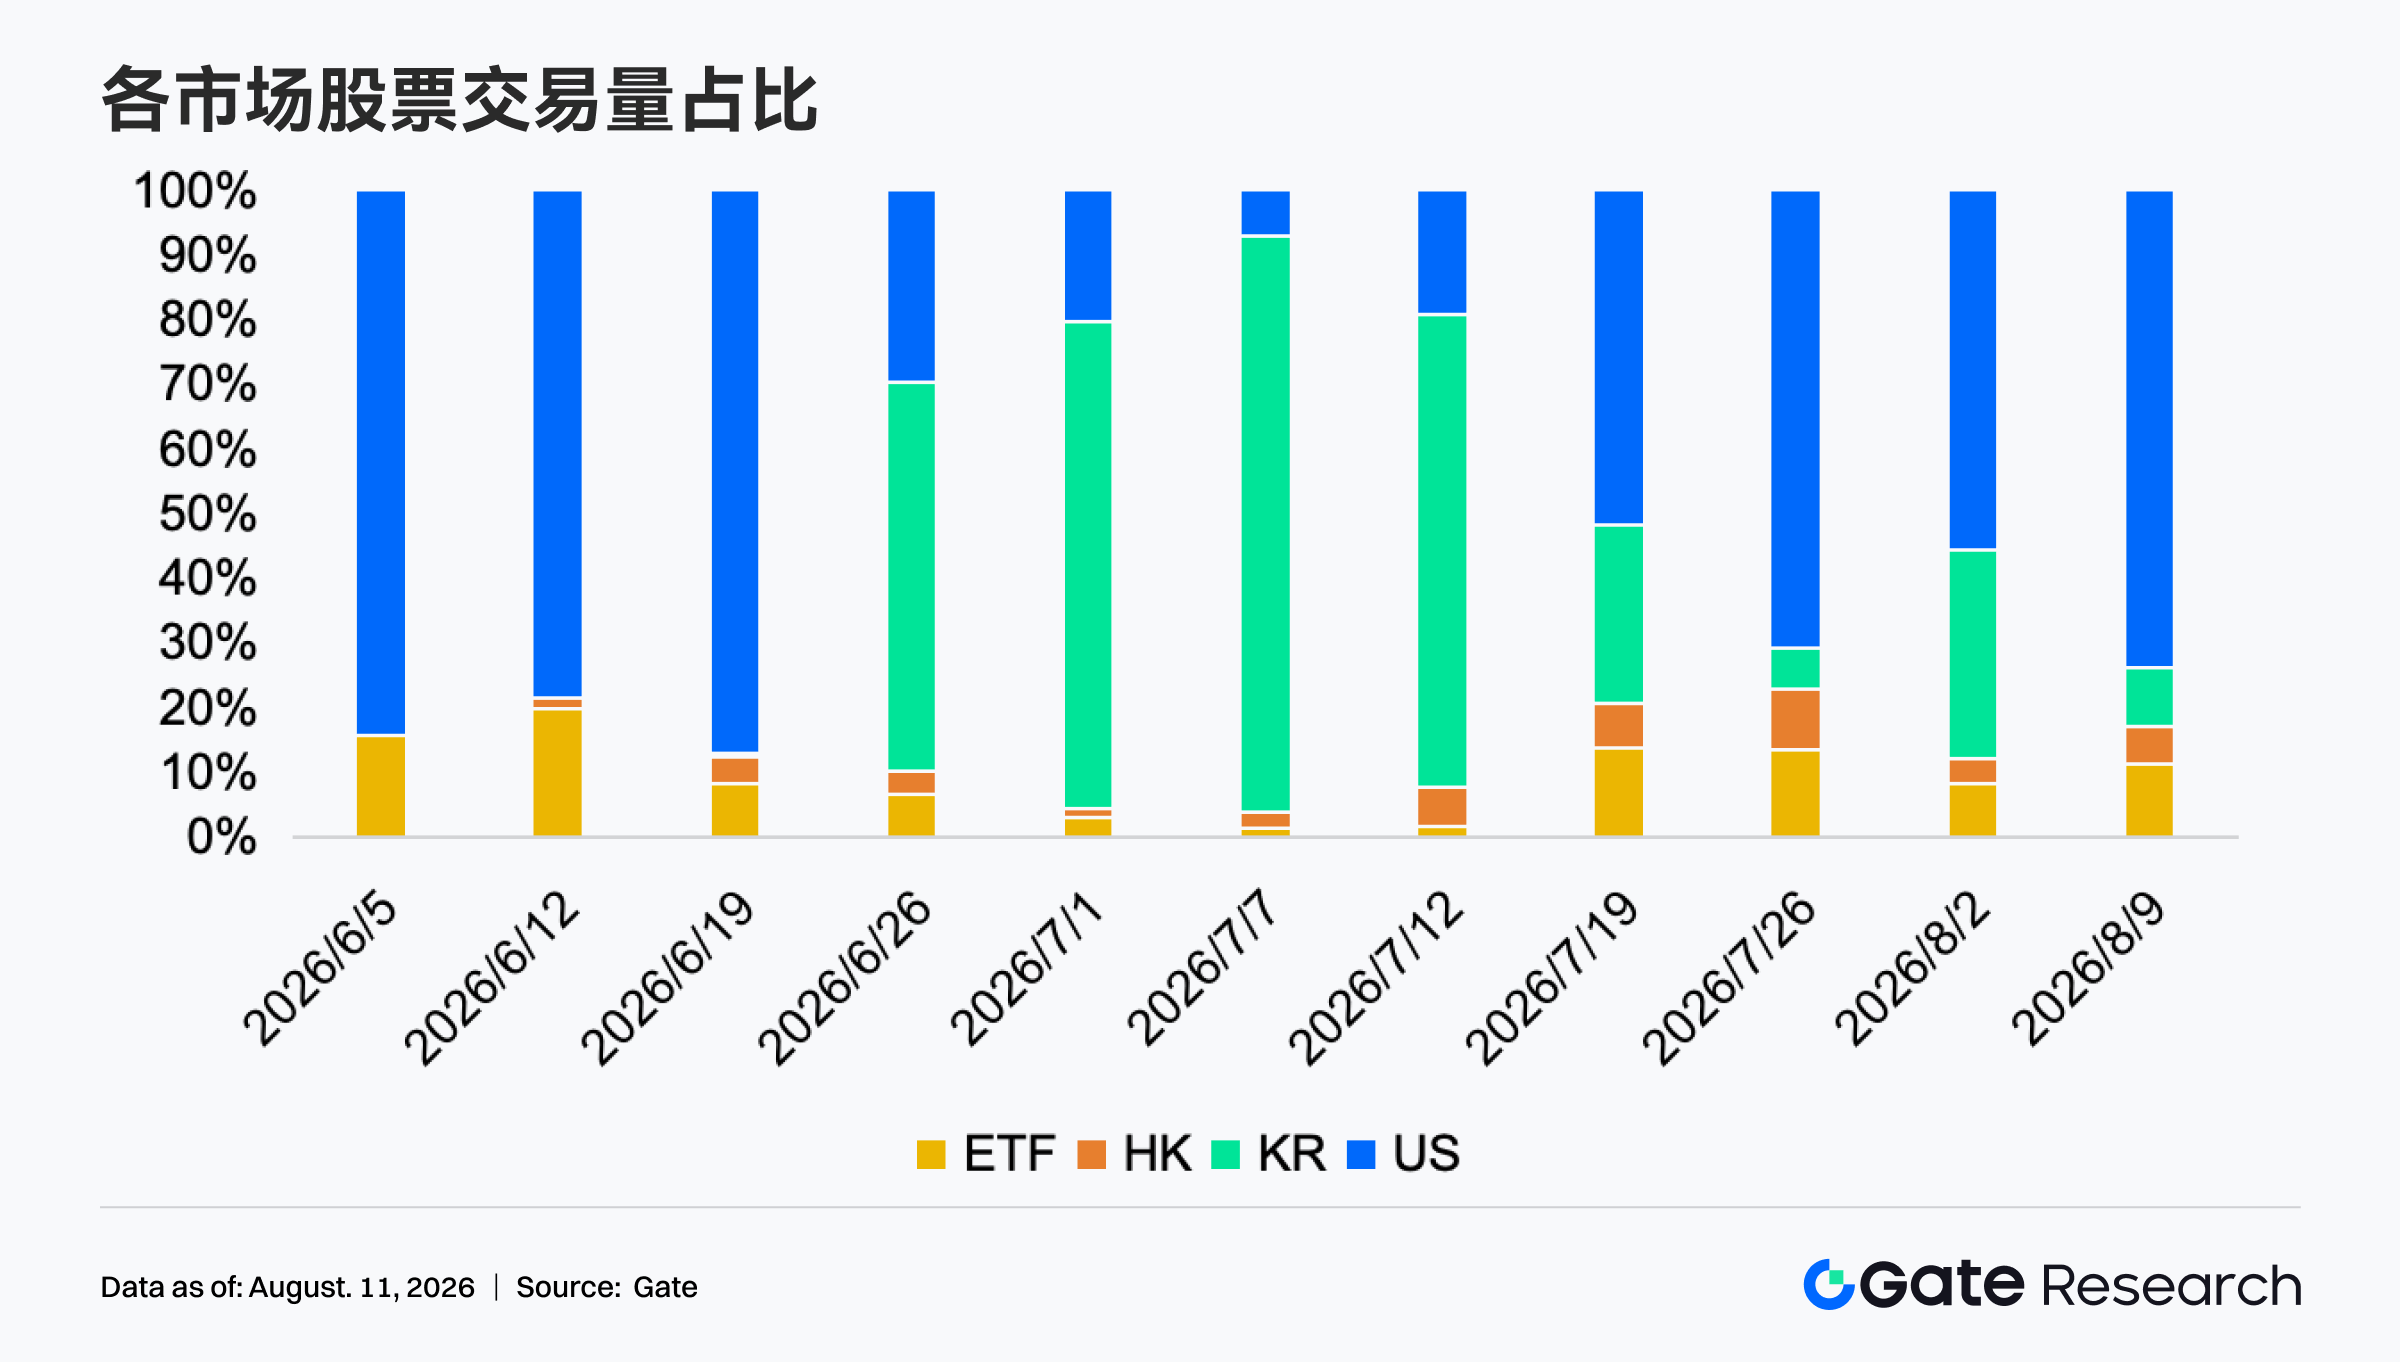
• Gate Equity Trading Volume: Over the past week, Gate's equity trading structure re-concentrated toward US stocks. During the week of August 9, US equity trading share rose from approximately 56% the prior week to approximately 74%, re-establishing absolute dominance. ETF share recovered from approximately 8% to approximately 11%, Hong Kong stocks rose from approximately 4% to approximately 6%, while Korean stocks dropped sharply from approximately 32% to approximately 9%. Overall, capital quickly rotated back to US equities after the previous period's notable allocation to Korean stocks, indicating short-term trading focus has shifted back toward the more liquid US market. Meanwhile, both ETF and Hong Kong stock shares increased simultaneously, making the equity trading structure more diversified than the previous week.
• TradFi Order Book Depth: We selected XAUT, the highest-volume TradFi instrument, to analyze order book depth (Delta). Over the past week, XAUT's ±1% order book depth fluctuated significantly, with liquidity structure shifting from a previously bid-heavy bias to two-sided volatile adjustments. On August 5–6, bid-side depth rose to approximately $1.5–1.8 million, but from August 6–7, ask-side depth expanded rapidly, with maximum negative Delta approaching $5 million, reflecting concentrated sell pressure during the rapid gold price rally. Selling pressure gradually eased after August 8, with bid-side liquidity recovering on August 9–10 and positive Delta approaching $1.9 million at one point. During the same period, XAUT's price rose from approximately $4,100 to above $4,300, presenting a pattern of "price strengthening, amplified depth volatility, and bid-side recovery in the tail end."
3. On-Chain Data Insights
3.1 DEX Trading Cools from Robinhood Chain Launchpad Craze; PancakeSwap Continues to Outpace Uniswap
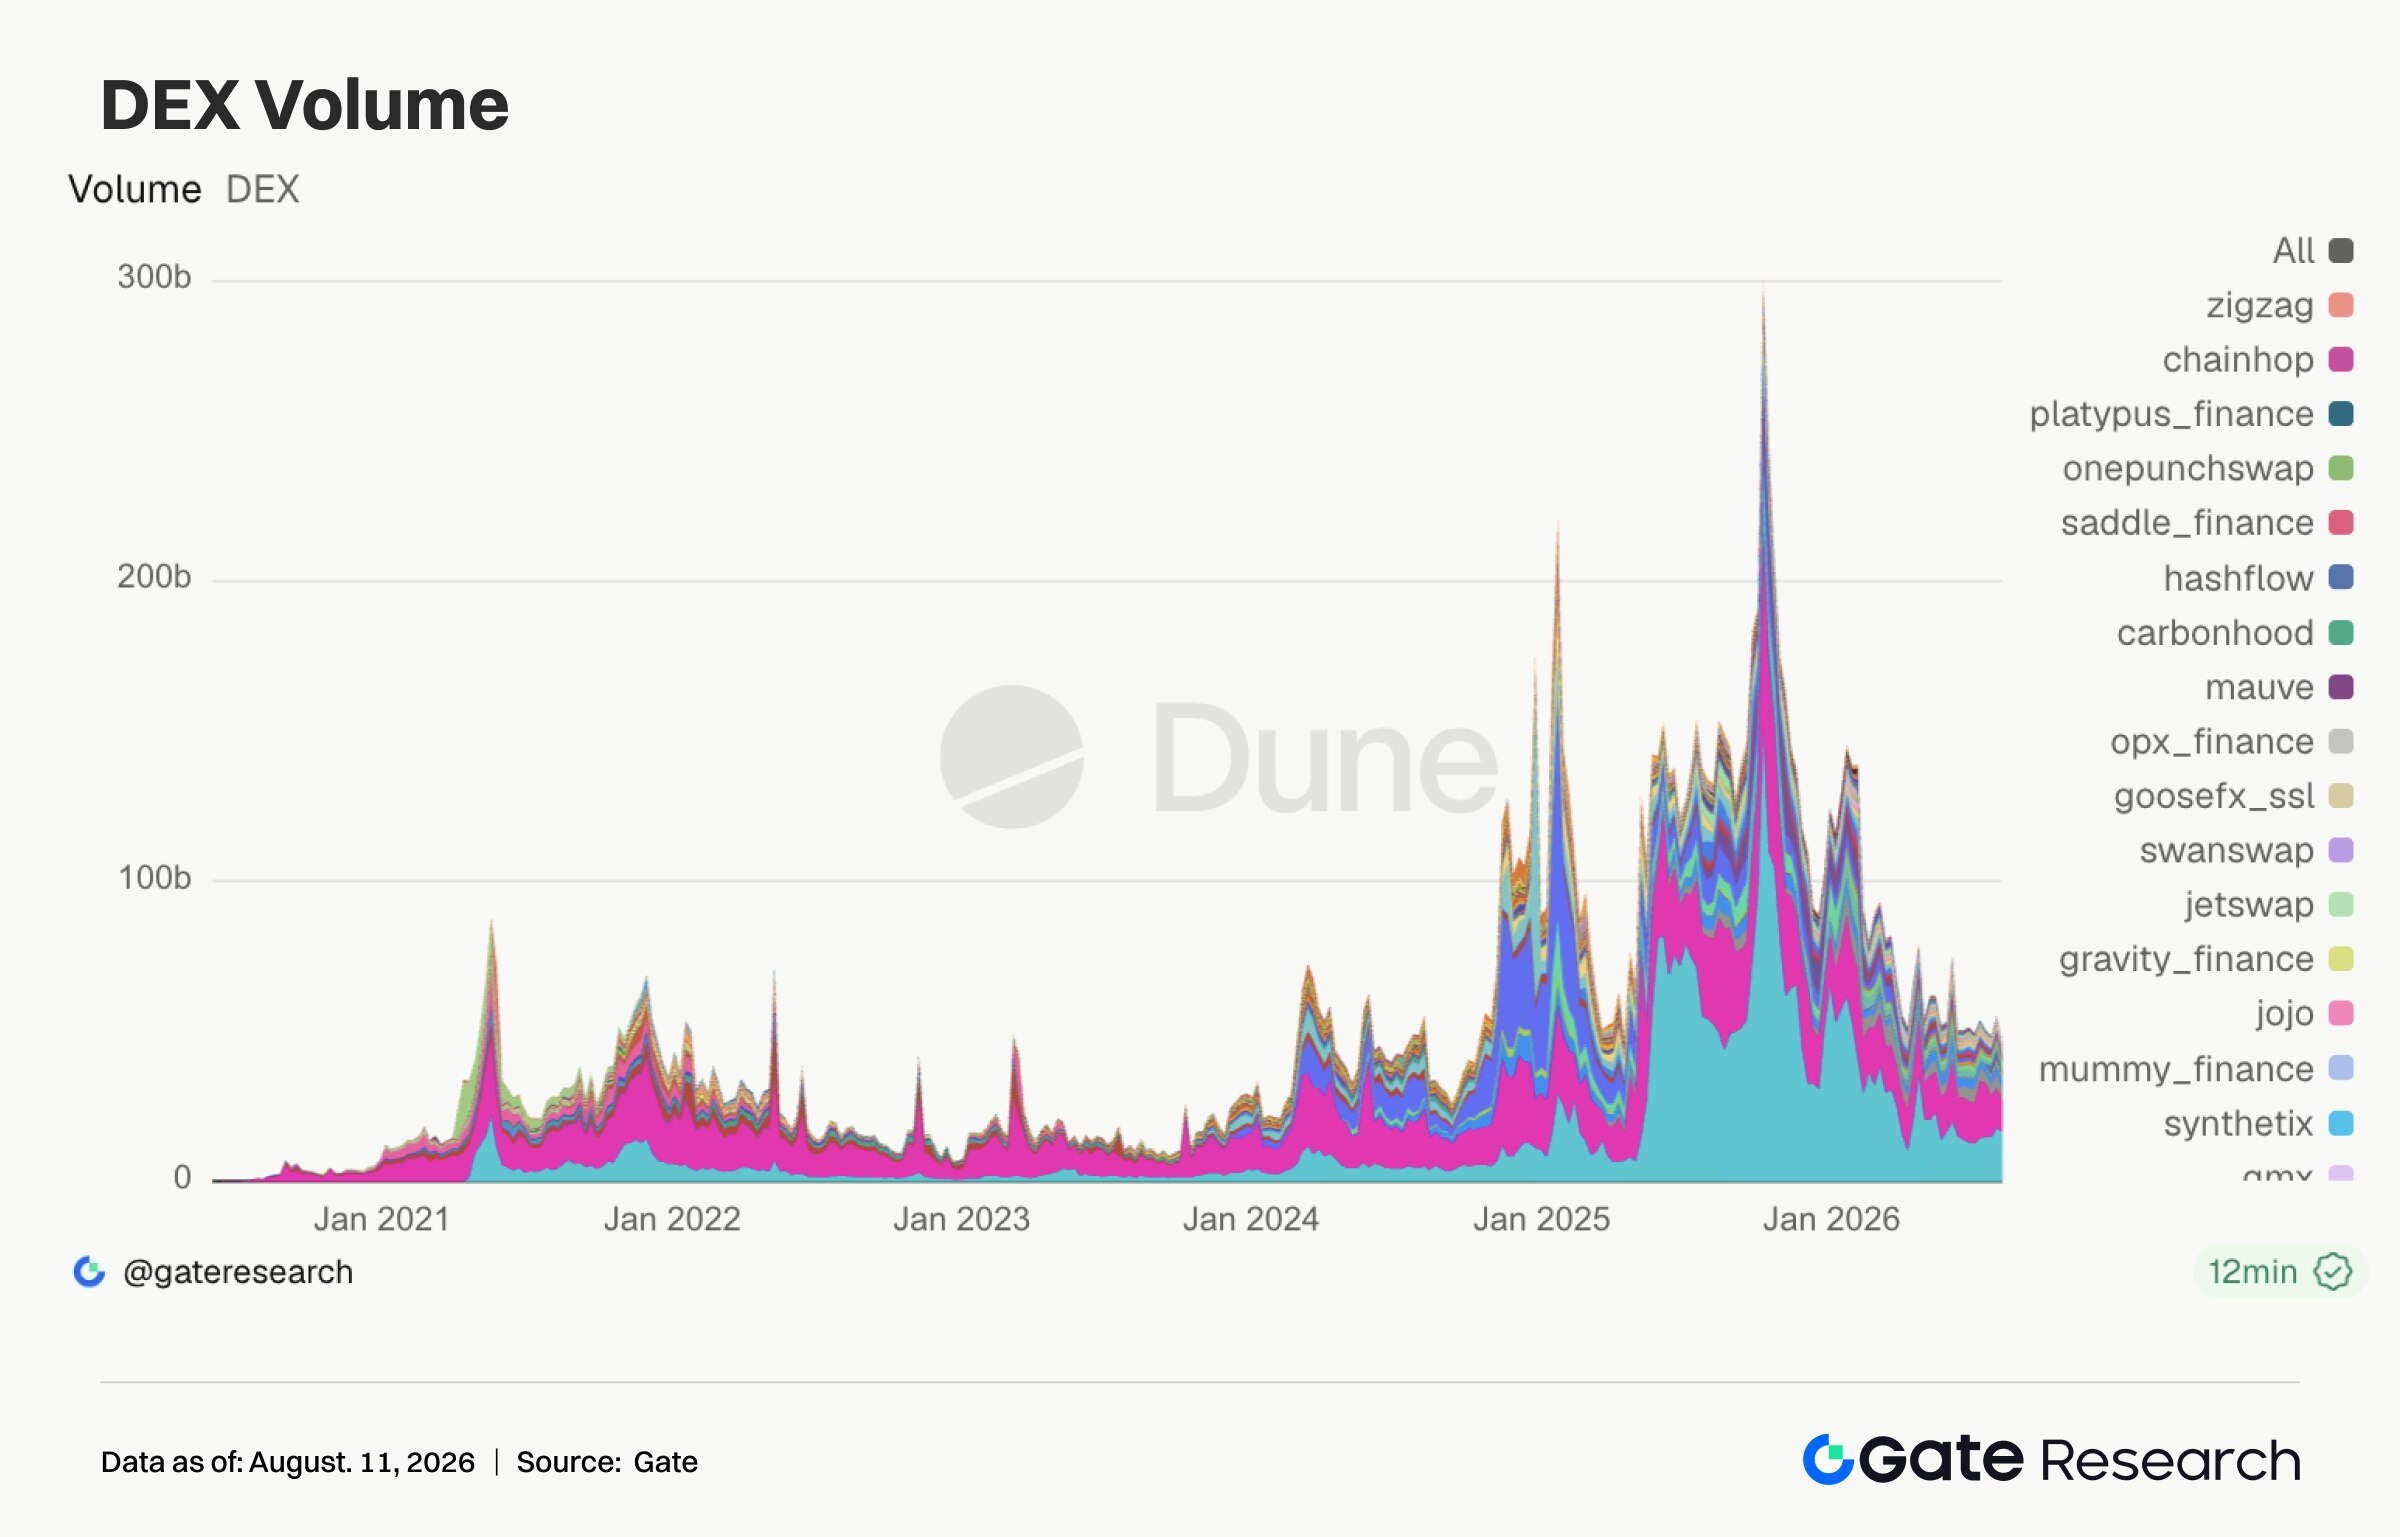
DEX volume did not sustain the prior week's high-level expansion. PancakeSwap ranked first with approximately $16.64 billion in volume, down approximately 6.9% WoW. Uniswap recorded approximately $10.31 billion, down approximately 24% WoW. A more pronounced change came from Robinhood Chain-related trading. Native volume fell from approximately $4.34 billion the prior week to approximately $1.22 billion, as the impulse from Pons, tokenized stocks, and early-stage Meme launches cooled. However, Robinhood Chain's heat has not disappeared—it has entered a platform competition phase. Over the past week, Uniswap launched Pools.trade on Robinhood Chain, creating more tokens on day one than Pons and contributing approximately half of that day's trading volume on Robinhood Chain token launch platforms, with traffic concentrating on new launchpads and Meme debuts. PumpSwap recorded approximately $4.22 billion in weekly volume with transaction counts remaining elevated. Pump.fun-associated apps further upgraded with social trading, zero-fee, and USDC cross-chain capabilities. Solana Meme retains user stickiness, but PumpSwap's unique traders fell from approximately 1.63 million the prior week to approximately 1.03 million, indicating a narrowing retail footprint with activity increasingly supported by high-frequency and core participants.
3.2 Stablecoin Supply Expands Modestly; Competition Shifts Toward Distribution, Yield, and Compliance Use Cases
Total stablecoin market cap increased by approximately $644 million over 7 days, up 0.21%. USDT and USDC saw only minor fluctuations, remaining the core vehicles for institutional dollar liquidity. The market continues to be dominated by existing capital rotating between different narratives. Structurally, the expansion of second-tier stablecoins deserves attention. USDG grew approximately 1.87% over 7 days, PYUSD approximately 2.96%, RLUSD approximately 7.86%, and GHO approximately 7.68%, while BUIDL also continued expanding. Earn, USDG, tokenized stocks, and stablecoin lending scenarios on Robinhood Chain are pushing stablecoin competition toward integrating with trading gateways, yield gateways, and compliant asset gateways. USD1 and USDe also saw modest weekly growth, but remain in drawdown territory on a monthly basis, suggesting that brand exposure and short-term market discussion have not yet fully converted into stable, sustainable on-chain dollar demand.
3.3 LST Sector Sees Broad Valuation Recovery; SOL and HYPE Staking Assets Show Greater Elasticity
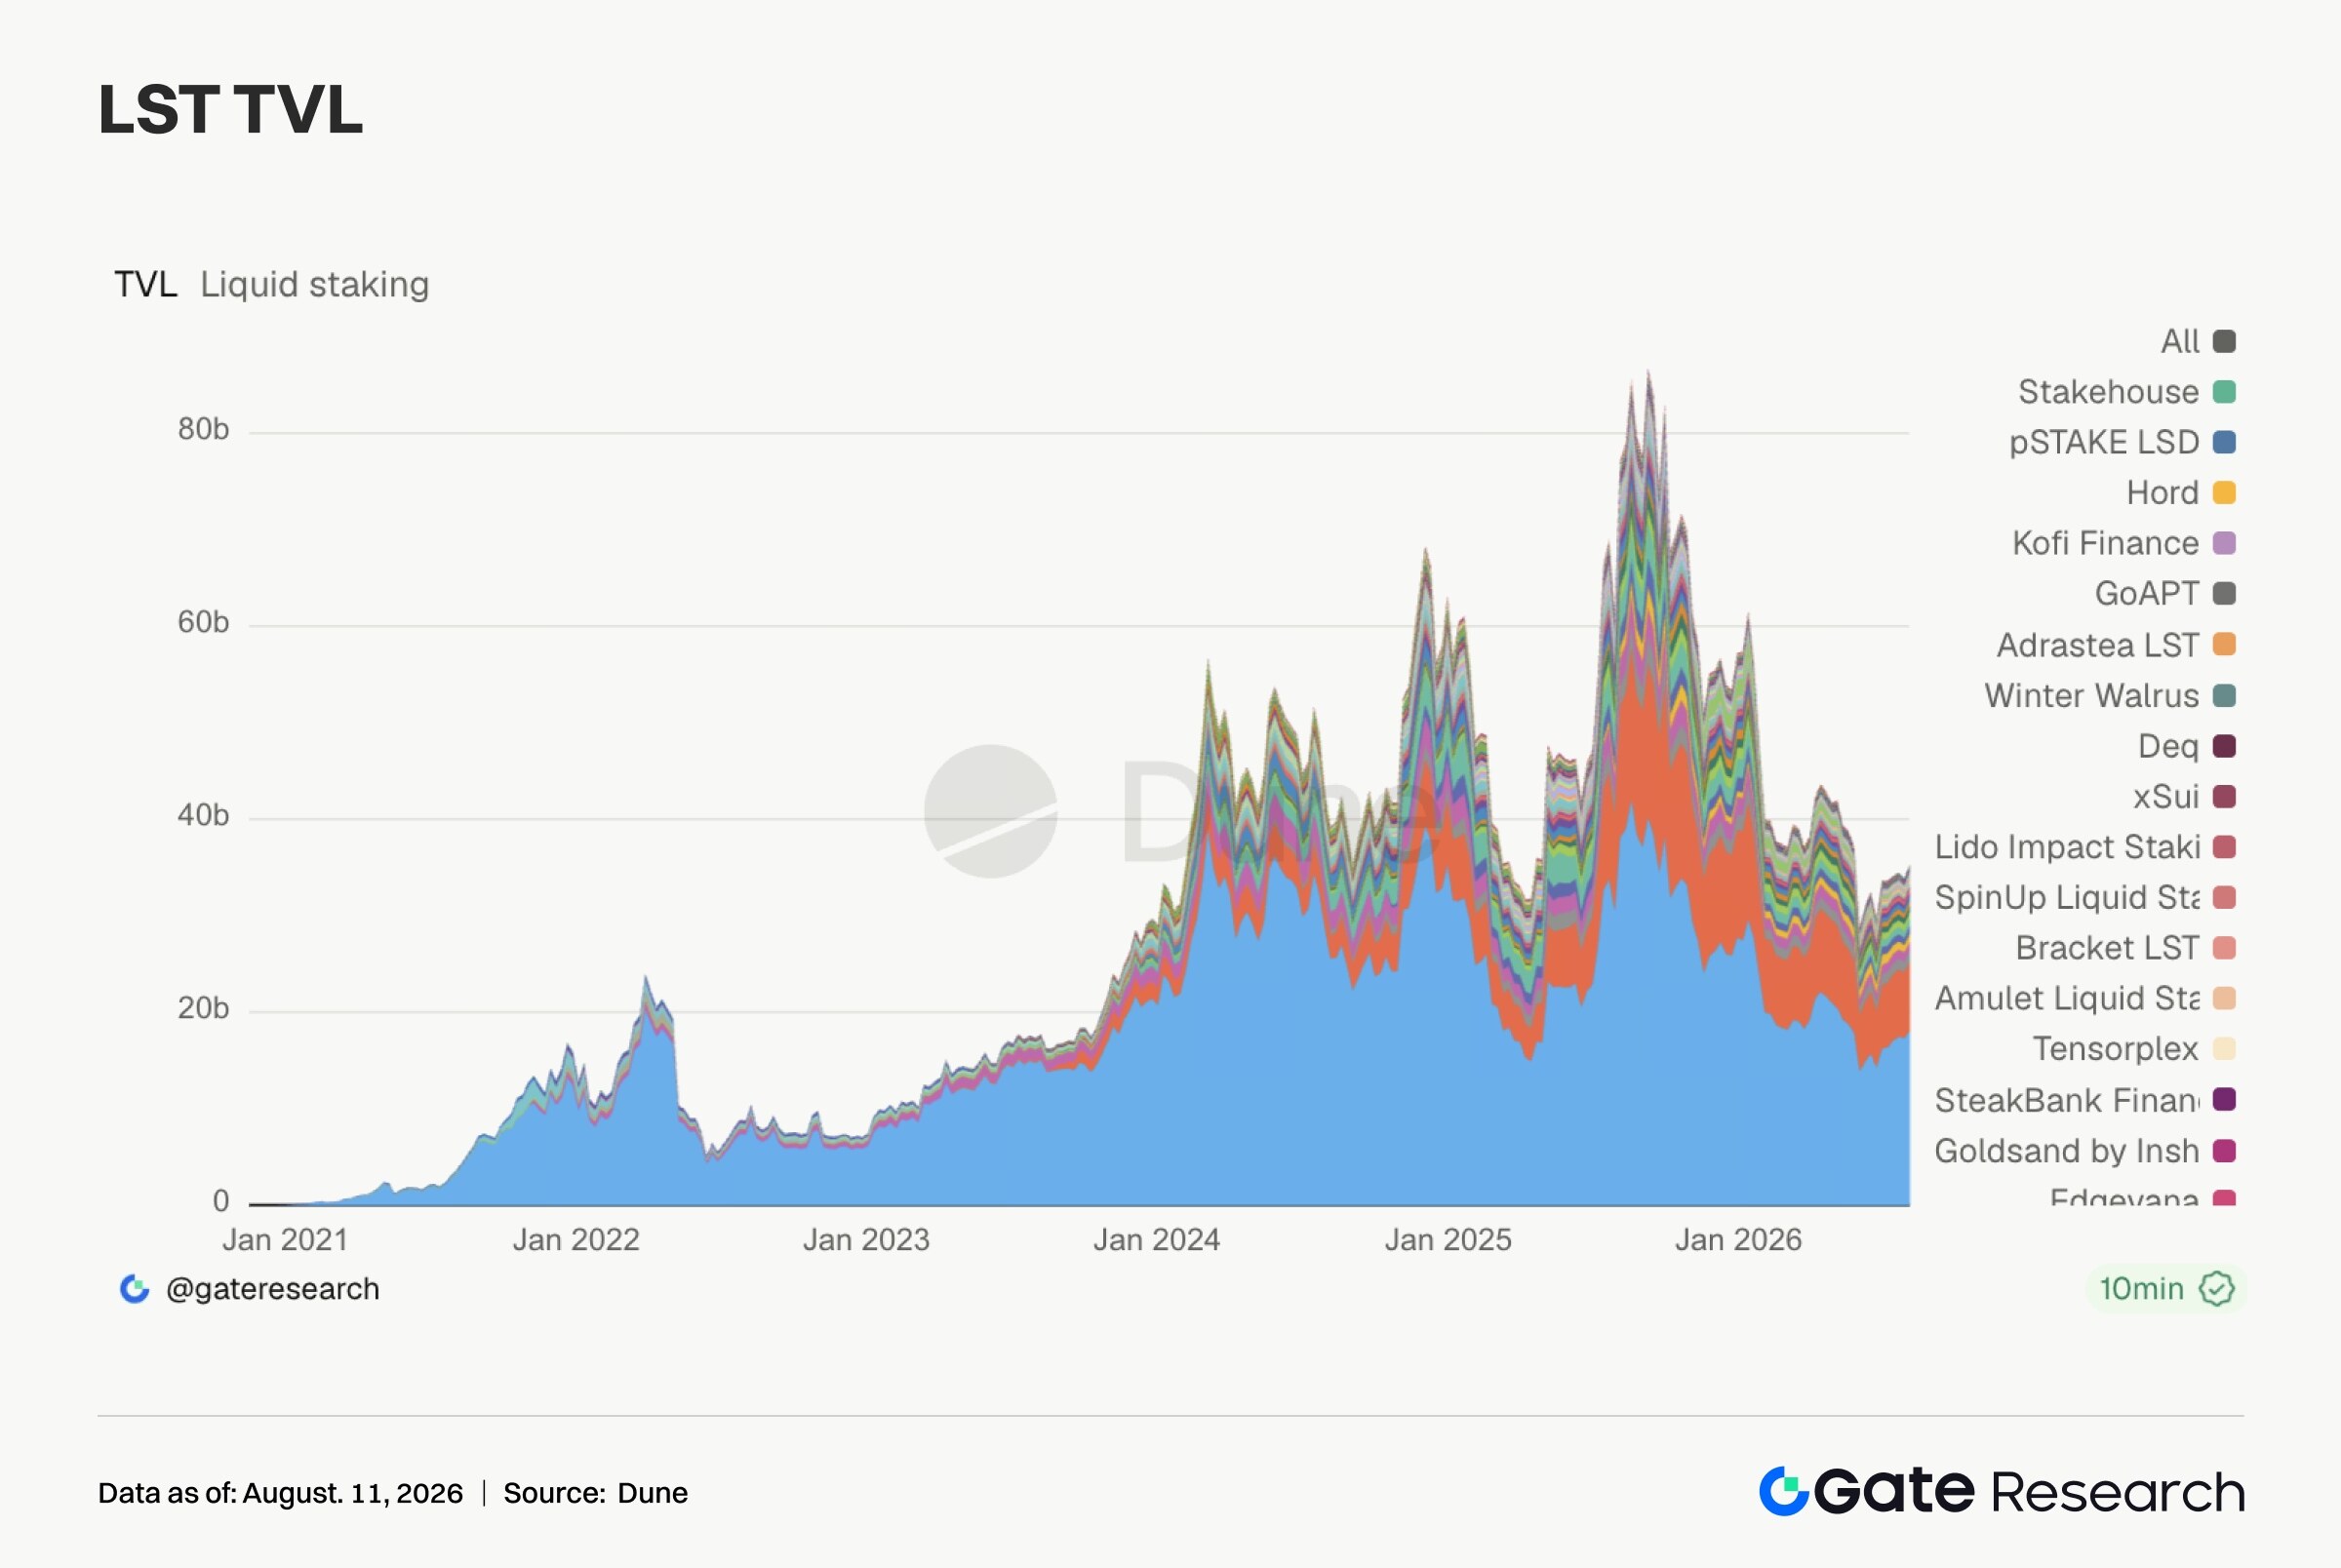
LST TVL broadly recovered this week. Lido rose from approximately $17.36 billion to $18.14 billion, up approximately 4.5%. ETH staking assets such as Rocket Pool and StakeWise recovered in tandem. The SOL side showed slightly stronger elasticity, with both Jito and Jupiter Staked SOL recording weekly growth of approximately 5%–6%, while Sanctum Validator LSTs rose to approximately $1.12 billion. HYPE-related staking assets also warmed up, with Kinetiq kHYPE and stHYPE both recording approximately 5% growth. This recovery represents TVL revaluation driven by price rebounds and improved risk appetite. From an institutional perspective, risk stratification remains among standard LSTs, restaking wrapper assets, and new-chain staking assets, but the market has shifted from prior caution to moderate position-building this week.
3.4 Aave Lending Supported by Ethereum Primary Market; Monad Emerges as the Week's Most Prominent Incremental Source
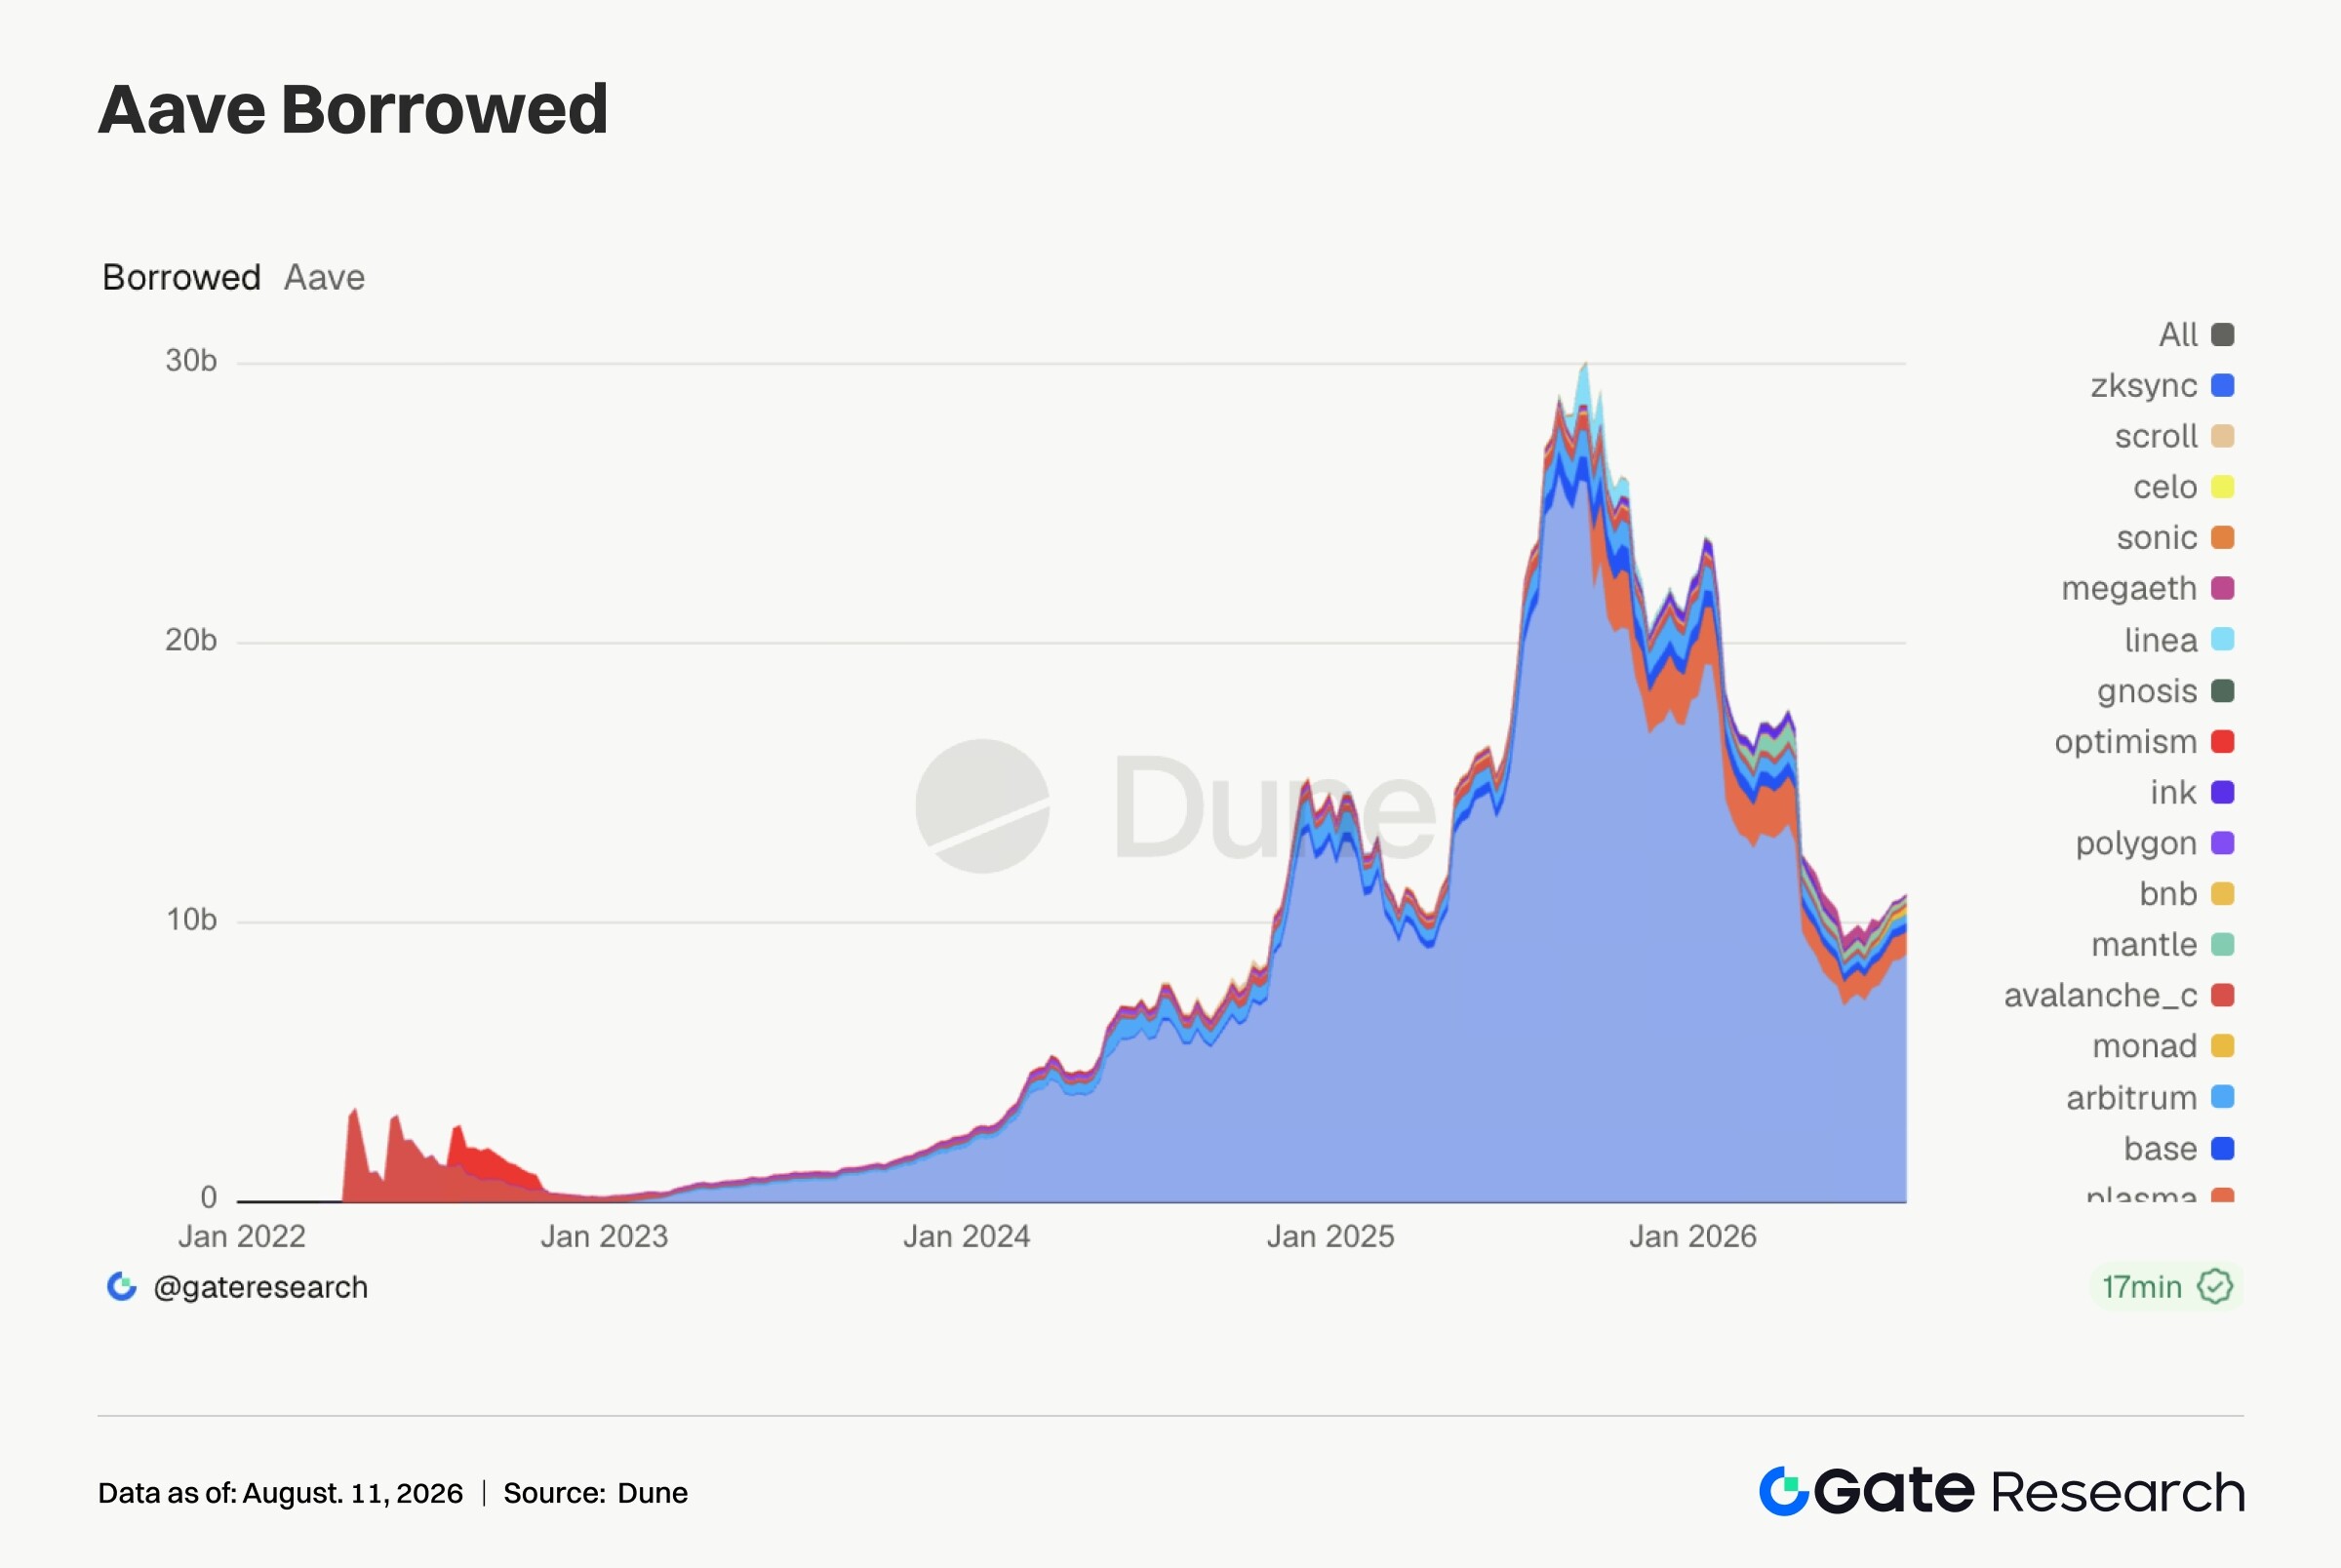
Aave's lending scale continued to stabilize this week, with Ethereum market borrow balances rising from approximately $8.7 billion to $8.89 billion, serving as the core support for the protocol's total scale. Base grew modestly to approximately $311 million, Mantle increased approximately 9.7%, and BNB Chain and Polygon also showed slight improvement. The most notable change came from Monad, where borrow balances rose from approximately $215 million to $293 million, a weekly increase of approximately 35.9%, indicating that some risk capital is re-testing lending opportunities on emerging chains. However, multi-chain expansion remains uneven. Plasma borrow balances declined approximately 7%, Ink fell approximately 11.6%, while Arbitrum and Optimism remained largely flat or slightly weaker. Current capital preferences exhibit a two-tier structure: on one hand, the Ethereum primary market continues to absorb large borrowings thanks to collateral depth, liquidation liquidity, and parameter predictability; on the other, new chains like Monad attract higher-elasticity capital driven by incentives, ecosystem expectations, and early-stage yield opportunities.
3.5 Aave Rates Stable at Low Levels; Borrow Balance Recovery Has Not Yet Become Leveraged Chasing
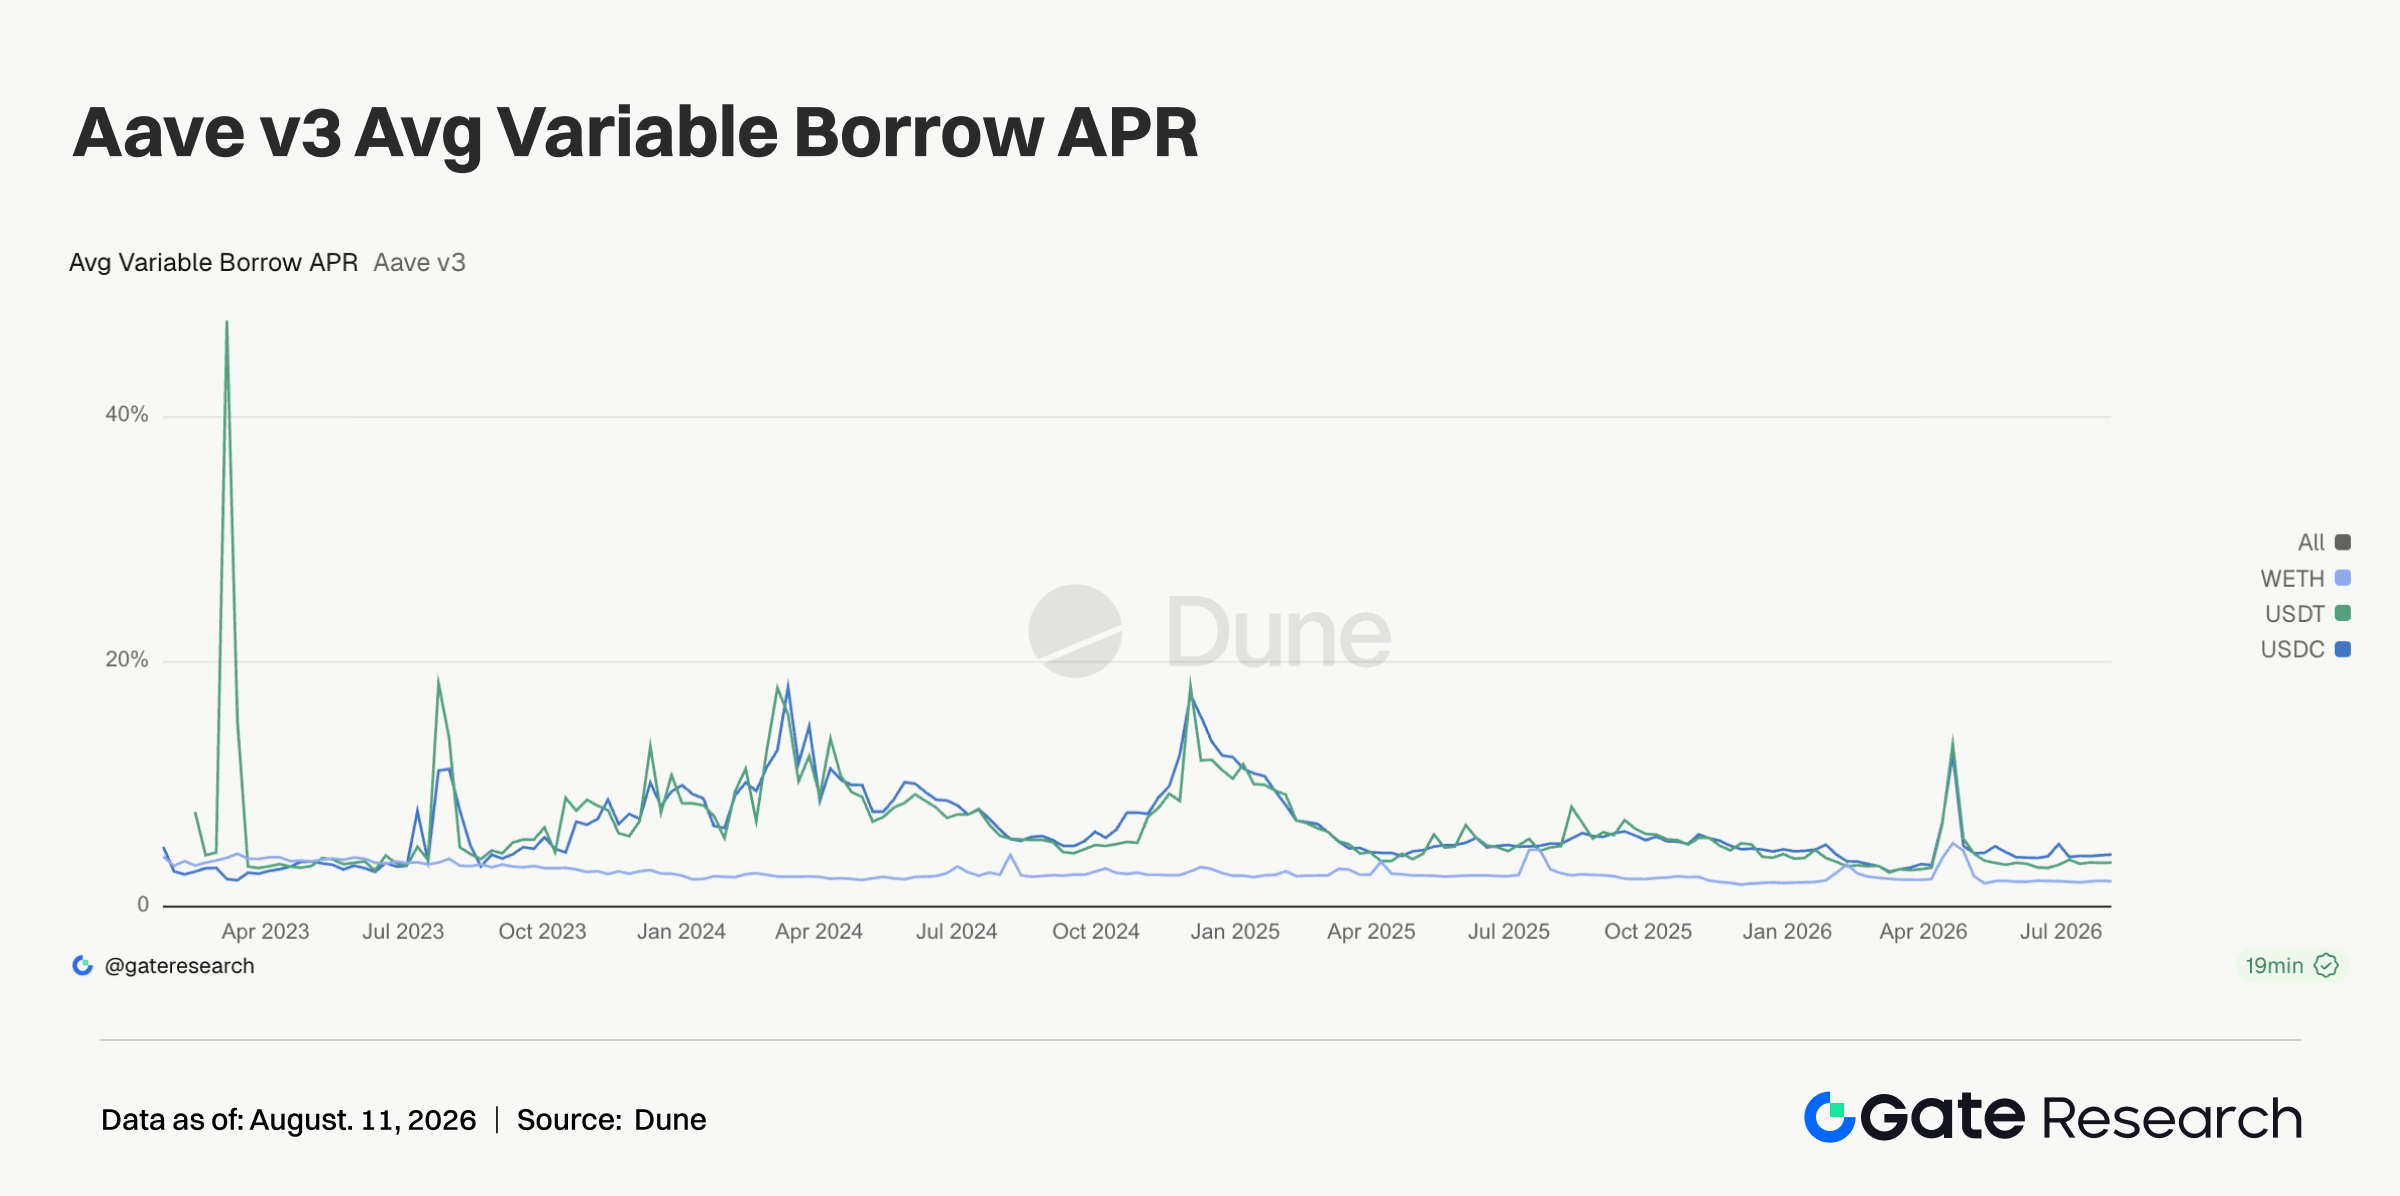
Aave's borrowing rates across major assets remained broadly stable. USDC average borrow rate was approximately 4.3%, USDT approximately 3.64%, and WETH approximately 2.11%. USDC's peak intra-week rate approached 14%, but the average did not spike significantly, with localized short-term funding tightness still present. WETH rates declined slightly WoW, and the borrow balance recovery did not trigger a rapid escalation in directional ETH leverage. Combining rate and balance data, on-chain lending is undergoing working capital turnover, carry trades, and strategic position rebuilding following the risk appetite recovery. USDC costs continue to exceed USDT, reflecting institutional and high-frequency strategies' ongoing preference for dollar assets with greater liquidity, compliance acceptance, and settlement convenience.
3.6 Protocol Revenues Broadly Cool; Meme and Wallet Gateways Show Relative Resilience
Protocol revenues retreated from the prior week's hotspot-driven spikes. Tether generated approximately $96.16 million in revenue, down approximately 14.6% WoW. Circle remained roughly flat at approximately $44.42 million. Hyperliquid's revenue fell from approximately $8.34 million to $6.44 million, as the derivatives trading heat driven by equity indices, commodities, and on-chain stock perps cooled. Aave's revenue also declined from approximately $935,000 to $682,000, as the rebound in borrow balances did not immediately translate into higher protocol revenue, primarily due to persistently low rates and moderate overall utilization. Meme platforms and front-end gateways showed relative resilience. Pump generated approximately $8.74 million in revenue—lower WoW but still above Hyperliquid. GMGN and Axiom Pro maintained elevated revenue ranges, while Phantom's revenue actually increased approximately 25%, and Jupiter recorded approximately 10% growth. Combined with Pump.fun's social trading upgrade and Robinhood Chain launchpad competition, this week's revenue structure demonstrates that the market lacks no speculative gateways—but speculation is rotating toward front-ends, wallets, launchpads, and aggregators competing for user pathways.
4. Derivatives Tracking
4.1 BTC Recovers to Near $65,000; OI Grows Moderately, Positive Funding Rates Show Longs Still Prevail
Over the past week, BTC stabilized from the $63,000 level, trading mostly within the $62,000–$65,000 range before returning to approximately $64,800 over the weekend. Cross-exchange funding rate samples show observable BTC contract OI fluctuating roughly between $10.7 billion and $11.4 billion, dipping mid-week before recovering—indicating new leveraged participation during the rebound, but without rapid





