






Gate Institutional Monthly Report | Global Asset Market Growth Slows, Tokenized Stock Trading Volume Surges


- Key Takeaways: In July 2026, the crypto market underwent structural repairs, with ETF capital shifting toward relative ETH allocation. Tokenized stocks, Robinhood Chain, and prediction markets emerged as core tracks, while security focus shifted from smart contract vulnerabilities to infrastructure issues such as private key and permission management.
- Key Elements:
- Macro: CPI rose 3.5% YoY; the Fed maintained rates at 3.50%-3.75%, with three committee members advocating for hikes and risk appetite remaining cautious.
- ETF: BTC spot ETFs saw net inflows of $172 million, while ETH spot ETFs recorded net inflows of $365 million (approximately 2.1x that of BTC). Signs of profit-taking appeared in capital flows at month-end.
- Tokenized Stocks: bStocks and Robinhood collectively contributed at least 47.6% of trading volume; xStocks retreated from $6.6 billion to the $1 billion range, intensifying competition for liquidity hubs.
- Robinhood Chain: Post-mainnet launch, daily transaction volume peaked at 4.69 million; RWA asset size grew 3.2x in a single month to $28.39 million, with meme trading driving user cold-start adoption.
- Prediction Markets: Total market taker volume reached $18.57 billion, with Kalshi's market share rising to 66.2%; weekly trading volume fell 19.1% after the World Cup final week.
- ETH Staking: Staking ratio surpassed 33.5% of total supply; Lido migrated over 8 million ETH, compressing validator counts by approximately one-third, shifting risk toward staking concentration and validator rights distribution.
- Security Incidents: AFX Trade ($24.15 million USDC), B² Network ($3.86 million), and Verus–Ethereum Bridge ($7.54 million) were attacked within 24 hours, all pointing to private key, upgrade permission, and cross-chain verification vulnerabilities.
Executive Summary
• In July 2026, global markets continued their structural recovery amid moderating growth, persistent inflation, and high interest rate constraints. Risk appetite in the crypto market ticked up, though institutional capital remained cautious in its allocation approach.
• ETF flows improved notably compared to June, with Ethereum spot ETFs recording significantly higher net inflows than Bitcoin. This reflects a shift in institutional capital from purely defensive positioning toward relative value allocation across major assets, though profit-taking signals re-emerged toward month-end.
• Global equity markets continued to follow the AI narrative, with large-cap tech platforms leading gains while high-beta growth stocks showed mixed performance. Gold and energy faced headwinds, copper remained relatively strong, and risk assets exhibited distinctly structural market movements.
• Tokenized stocks, Robinhood Chain, and prediction markets emerged as the most active sectors this month. On-chain stock liquidity increasingly concentrated toward CEXs and brokerage platforms, Meme trading accelerated Robinhood Chain's cold start, and World Cup events drove prediction market trading volumes to record highs.
• The launch of Robinhood Chain's mainnet and ETH staking ratio surpassing one-third of total supply for the first time mark a deepening convergence of traditional financial institutions with on-chain finance, ushering Ethereum into a new phase of rebalancing security, yield, and liquidity.
• AFX Trade, B² Network, and the Verus–Ethereum Bridge experienced consecutive security incidents, shifting industry focus from smart contract vulnerabilities toward infrastructure security issues including private key management, upgrade permissions, and cross-chain verification.
1. Macro Market Trends
1.1 Monetary Policy Remains Tight: Growth Slowing, but Inflation Constraints Persist
In July 2026, the core macro narrative shifted from "growth resilience coexisting with policy constraints" to "moderating growth with sticky inflation." US June CPI declined 0.4% month-over-month and rose 3.5% year-over-year, while core CPI increased 2.6% year-over-year. Q2 real GDP growth came in at an annualized 1.5%, slowing from Q1's 2.1%. The data suggests that falling energy prices are improving headline inflation, but private demand has not stalled, and core price pressures have yet to fully dissipate.
Late in the month, the Federal Reserve held the federal funds rate target range at 3.50%–3.75%, with three committee members advocating for a 25-basis-point hike—a distinctly hawkish voting pattern. Meanwhile, Middle East tensions and energy prices continued to intermittently disrupt inflation expectations, preventing markets from sustaining any easing narrative. For the crypto market, July saw some recovery, but interest rate constraints remained in place. Institutional capital continued to favor major assets with higher liquidity and clearer fundamentals, keeping overall risk appetite cautious.
1.2 ETF Flows: ETH Allocation Stronger Than BTC, Flows Weaken Again at Month-End
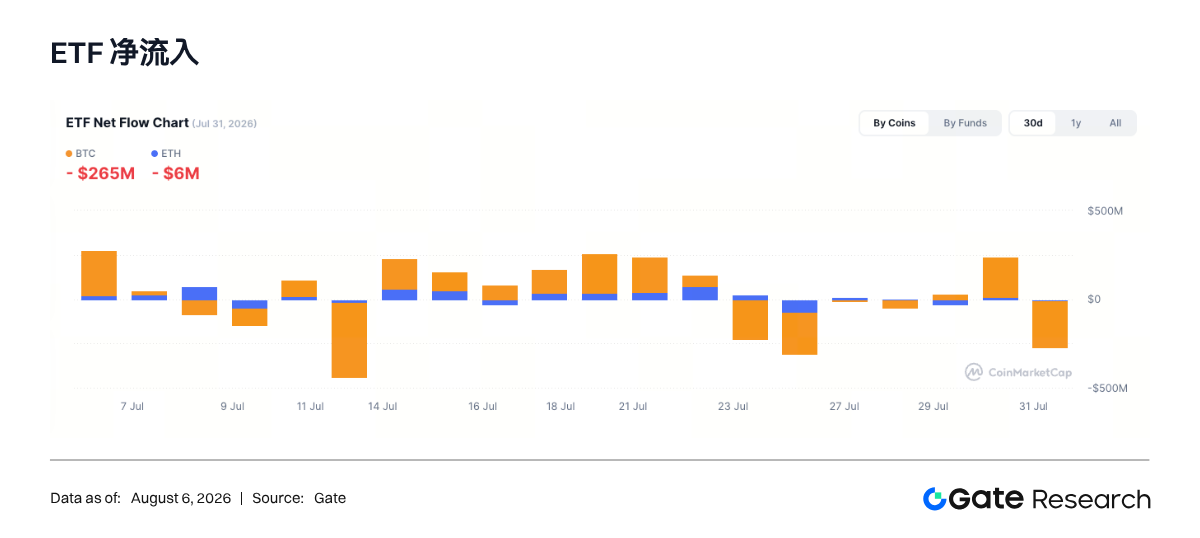
ETF capital flows improved notably in July 2026 compared to June. Based on the 22 trading days covered by Gate's institutional indicators, BTC spot ETFs recorded cumulative net inflows of approximately $172 million for the month, while ETH spot ETFs saw cumulative net inflows of approximately $365 million. ETH's net inflows were roughly 2.1 times those of BTC, reflecting a shift in institutional capital from purely defensive positioning toward relative value allocation across major assets.
Structurally, BTC ETF flows were highly volatile during the month, with multiple days of net inflows in mid-July but a single-day net outflow of approximately $265 million near month-end, indicating profit-taking following the price rebound. ETH ETF flows showed greater consistency, with positive contributions on most trading days. Total ETF assets also rose from approximately $8.563 billion at the start of the month to approximately $10.229 billion by month-end, corroborating ETH's clear outperformance versus BTC during the period.
Notably, the CoinMarketCap chart provided by the user aligns with Gate's data regarding BTC's month-end flow direction, though single-day ETH data shows discrepancies in source or update timing. Therefore, this report uses Gate's complete trading-day sequence to calculate monthly cumulative values, using screenshots only for observing month-end flow direction. Overall, July saw institutional capital shift from June's broad withdrawal to selective replenishment, though flows cooled again toward month-end without forming a comprehensive accumulation trend.
1.3 Global Capital Market Trends
1.3.1 Global Risk Assets: Tech Stocks Lead, but Returns Highly Concentrated
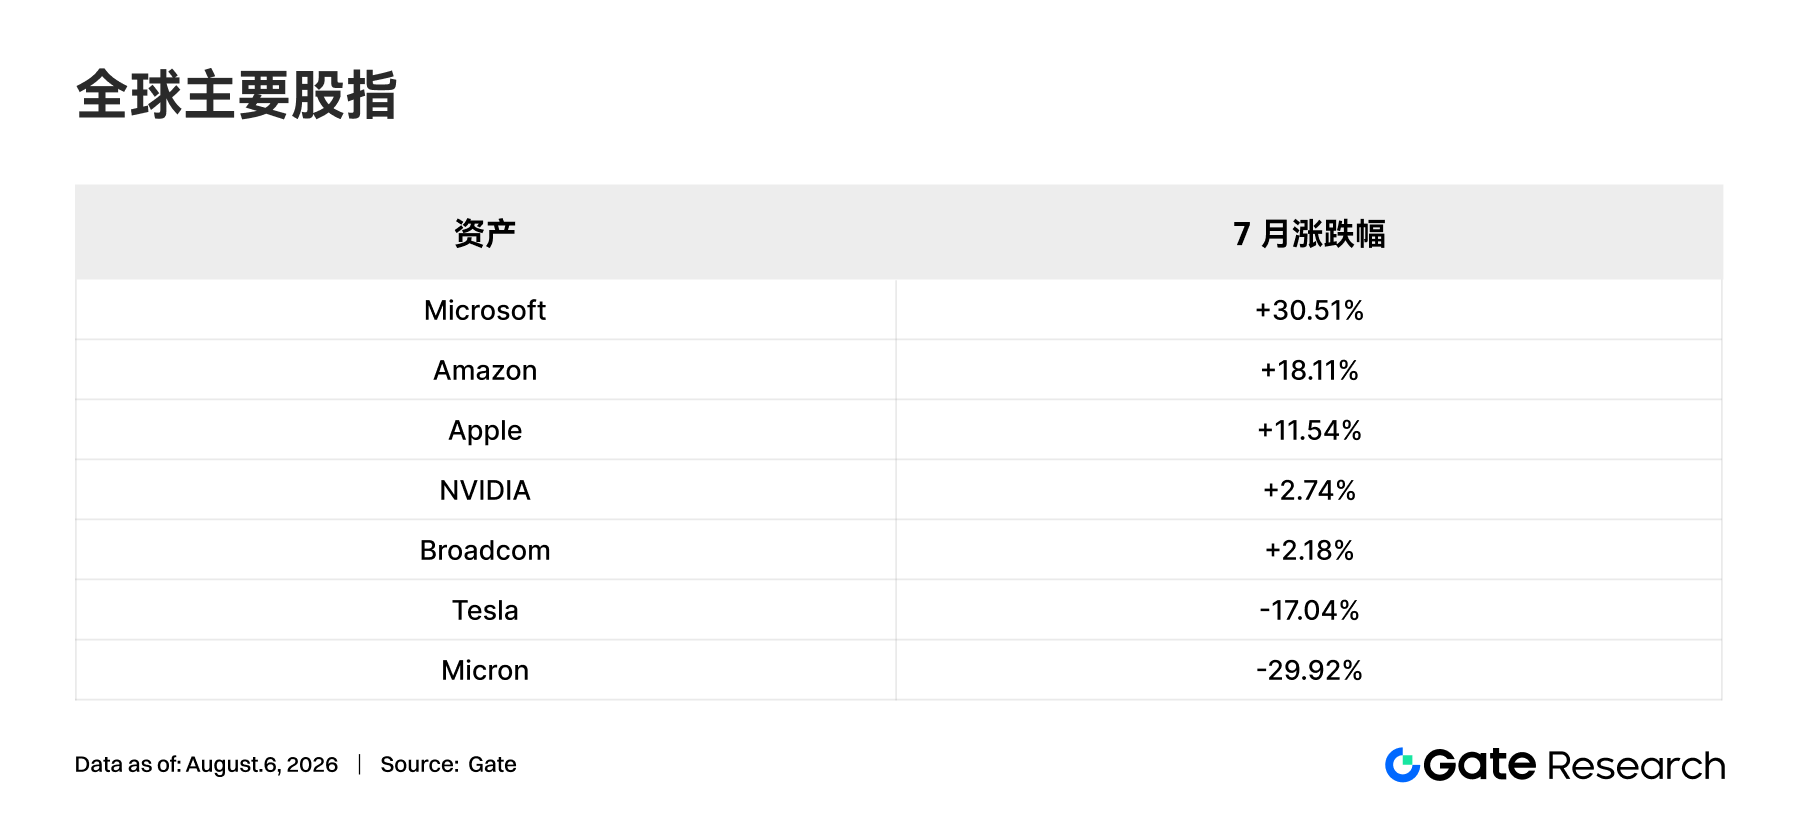
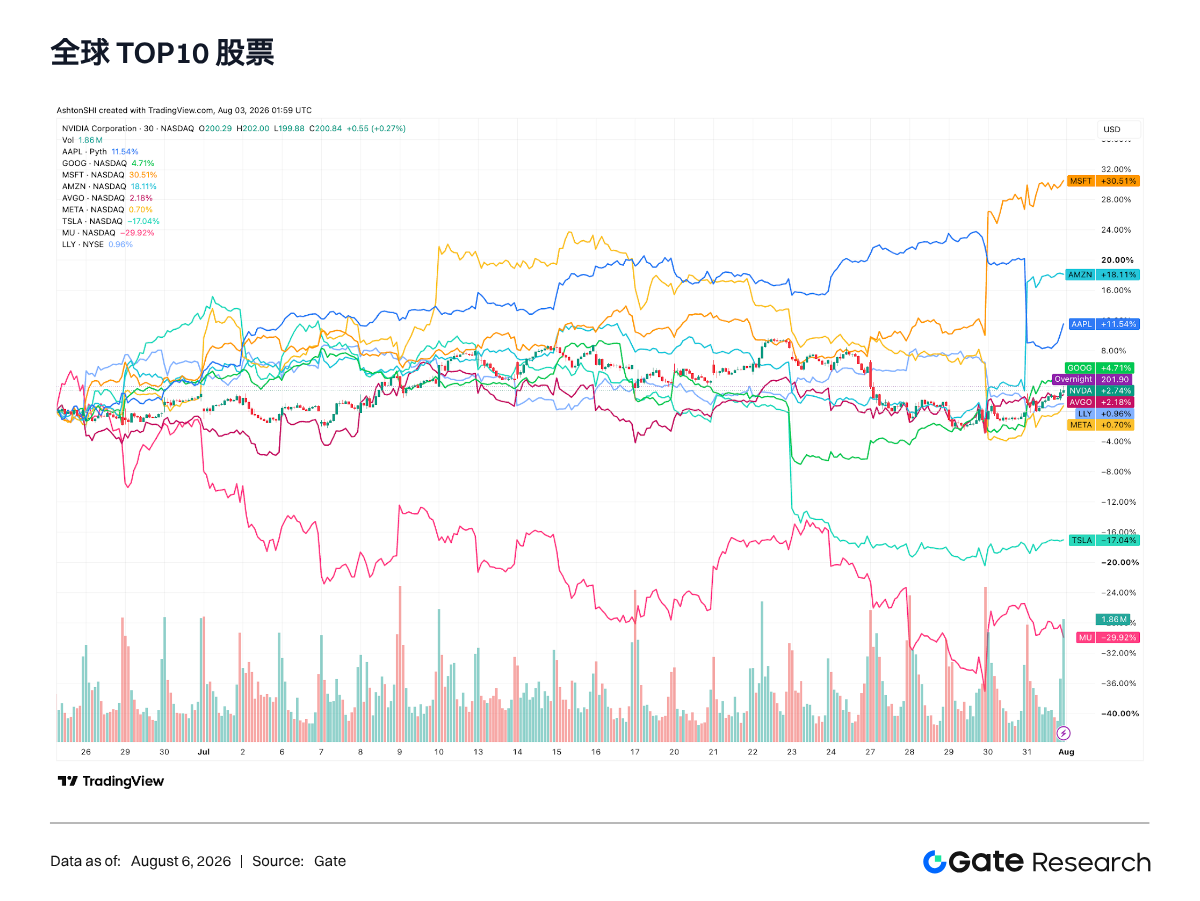
In global equity markets, July 2026 was not a broad rally but rather a pattern of large-cap platform companies leading gains while semiconductors and high-beta assets diverged. TradingView interval comparisons provided by the user show Microsoft, Amazon, and Apple rising 30.51%, 18.11%, and 11.54% respectively, becoming the month's primary return drivers. Alphabet, NVIDIA, and Broadcom posted moderate gains.
On the other hand, Tesla and Micron fell 17.04% and 29.92% respectively, forming a stark contrast with the leaders. Meta and Eli Lilly were roughly flat, indicating that the market did not simply price assets by "tech" or "defensive" labels. Instead, it re-filtered between earnings delivery, AI capex returns, valuation levels, and cash flow certainty. July's defining characteristic was superficially stable indices and sectors masking significantly elevated return concentration at the individual stock level.
Overall, risk appetite improved somewhat in July, but capital favored large-cap companies with strong earnings delivery capabilities and ample liquidity. For institutional allocation, this environment is more suited to participating in structural opportunities through balanced positioning, rather than extrapolating a few leaders' gains into a broad market risk-on reversal.
1.3.2 Equities: AI Theme Continues, Earnings and Valuation Drive Divergence
At the individual stock level, July's most distinctive feature was the persistence of the AI theme, but with capital shifting from indiscriminate pursuit of the compute chain toward strict screening of commercial delivery capability. Microsoft rose 30.51%, Amazon 18.11%, and Apple 11.54%, showing large-cap platforms commanding higher valuation premiums through cloud businesses, enterprise software, advertising, and end-device ecosystems. NVIDIA and Broadcom rose 2.74% and 2.18% respectively, posting relatively steady performance.
Meanwhile, Micron fell 29.92% and Tesla fell 17.04%, demonstrating that high-beta assets face significant drawdowns when earnings, guidance, or valuations disappoint. Alphabet rose 4.71% and Meta rose 0.70%, performing between the leading platforms and the under-pressure names. The market has not abandoned tech growth; rather, it is distinguishing between assets with "high capex but verifiable returns" and those with "high expectations and longer delivery cycles."
The defensive advantage of the healthcare sector was not prominent in July, with Eli Lilly rising only 0.96%. Overall, institutional trading logic has shifted from simply chasing the AI narrative toward greater emphasis on earnings quality, cash flow, and valuation alignment. The tech theme retains momentum, but internal volatility and stock-picking difficulty have risen notably.
1.3.3 Gold: Weak Within Monthly Range, Safe-Haven Trading Lacks Sustained Catalysts
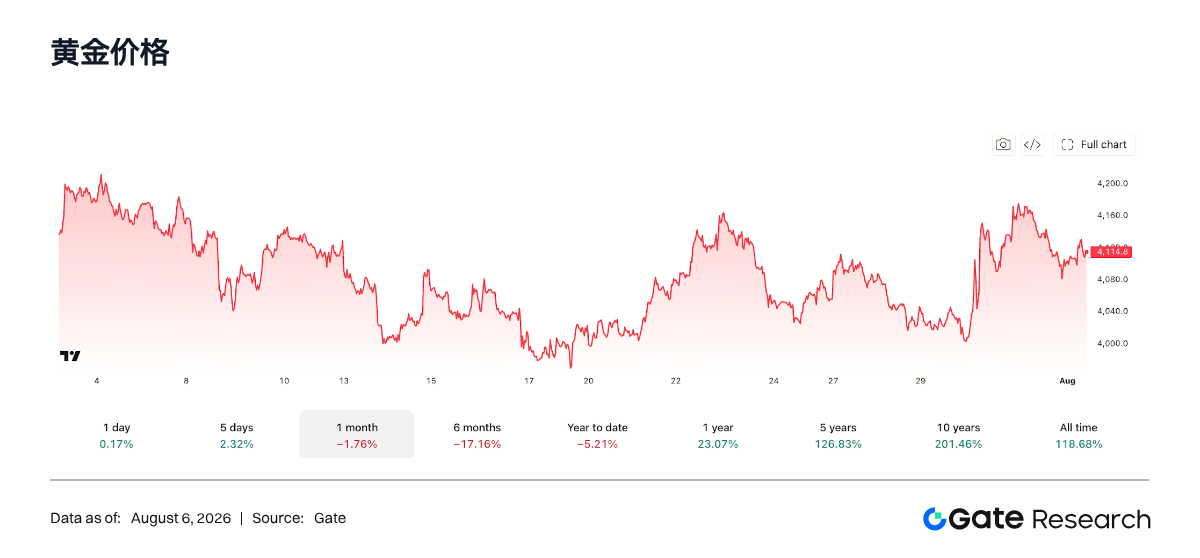
Gold edged lower in July. According to the monthly chart provided by the user, gold declined approximately 1.76% during the month, ending around $4,114.8 per ounce. In terms of price action, gold trended down from early to mid-month before staging a recovery, but failed to establish an effective breakout, indicating continued tug-of-war between safe-haven demand and the high-rate environment.
This reflects not a breakdown in gold's long-term hedging logic but rather a shortage of short-term catalysts. On one hand, while global risk assets showed divergence, this did not evolve into sustained systemic risk-off. On the other hand, the Federal Reserve's persistently hawkish stance, combined with real rates and dollar constraints, makes it difficult for gold to replicate its previous one-way rally.
Therefore, July gold was closer to high-level range consolidation rather than a trend reversal. For institutional allocation, gold retains portfolio hedging value, but at the tactical trading level, it requires clearer directional changes in inflation, geopolitical risk, or monetary policy.
1.3.4 Commodities: Copper Relatively Strong, Energy and Precious Metals Remain Under Pressure
Commodities continued to show pronounced divergence in July. The medium-term relative return chart provided by the user covers approximately early May through early August, which is not strictly a single-month window, but it clearly shows copper maintaining relative strength of approximately 11.82% while light crude oil, silver, platinum, and gold faced overall headwinds during the period. The market has shifted from broadly betting on resource price increases toward more granular, commodity-specific pricing based on demand, inventories, and supply disruptions.
Copper's strength indicates that industrial demand and capex expectations have not fully weakened. Crude oil's sustained pullback has eased energy inflation pressures, consistent with the decline in energy prices within July's CPI. Overall, commodity markets remain structurally driven, with industrial metals relatively favored while energy and precious metals await new supply-demand or policy catalysts. Institutional allocation is better served by maintaining commodity diversification rather than making single-direction bets.
2. Trending Sector Analysis
2.1 Tokenized Stock Liquidity Restructured: CEXs and Brokerage Platforms Reshape the Market Landscape
Tokenized stocks underwent a watershed market structure shift in July. On-chain transfer volume exceeded $9 billion for the second consecutive month, demonstrating that tokenized equities on-chain have established a stable and substantial capital carrying capacity. Market attention has shifted toward liquidity organization, user onboarding channels, and where assets settle after trading. This evolution is transforming tokenized stocks from a single RWA vertical into a comprehensive financial infrastructure connecting traditional securities, centralized exchanges, brokerage accounts, public chain wallets, and stablecoin settlement networks.
Looking back at June, the market structure was highly concentrated. xStocks and Ondo together accounted for over 95% of on-chain transfer volume, with xStocks alone reaching $6.6 billion in monthly volume, establishing itself as the primary liquidity venue for on-chain stocks. Market growth was built on first-mover supply, asset coverage, and on-chain tradability. xStocks' high trading volume generated significant liquidity aggregation effects, with market-making resources, capital turnover, user trading habits, and asset awareness accumulating around a few platforms—a classic early-stage winner-take-most pattern in tokenized stock markets.
July's data offers a new answer. bStocks' monthly volume rapidly rose to $3.28 billion; Robinhood's on-chain stocks exceeded $1 billion in monthly volume following mainnet launch; Ondo maintained modest growth; and xStocks fell back to the $1 billion range. Using $9 billion as the monthly baseline, bStocks and Robinhood together now contribute at least 47.6% of total market volume. Such share migration within a single month demonstrates that tokenized stock liquidity is not entrenched in any single first-mover protocol—the market remains in a phase of rapid rearrangement of user gateways, market-making networks, and distribution capabilities.
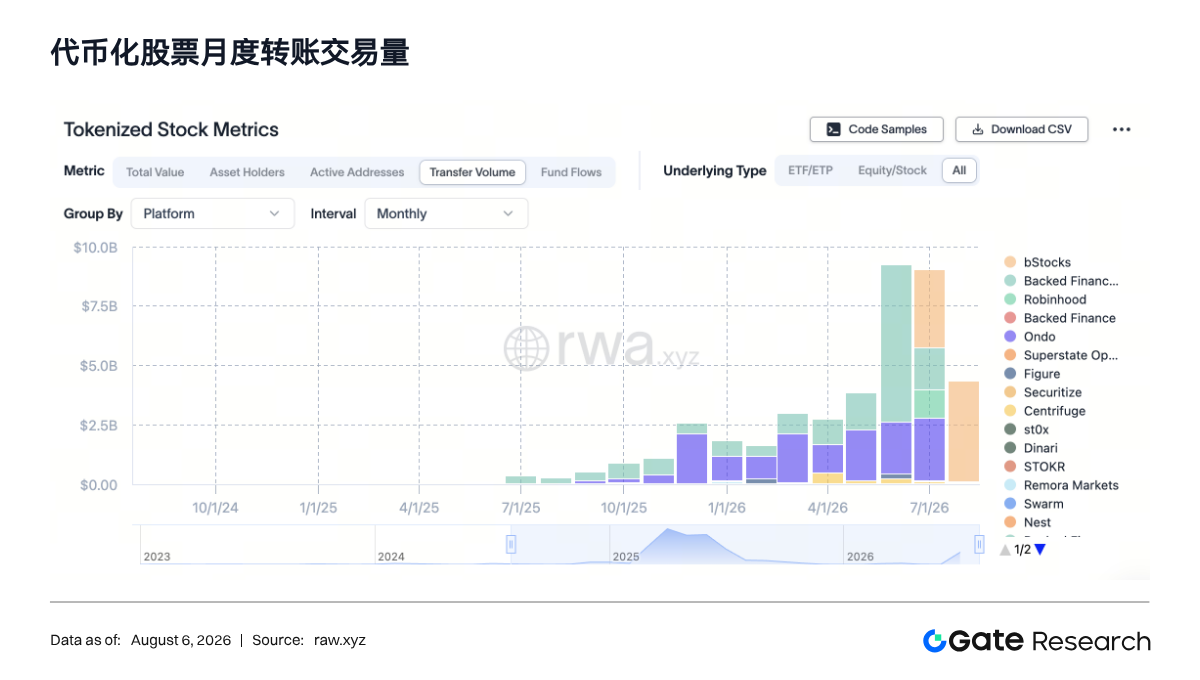
bStocks' rise is fundamentally driven by CEX capabilities in asset distribution and trading organization now directly applying to the on-chain stock market. Centralized exchanges possess mature user account systems, stablecoin liquidity pools, trading interfaces, quote networks, market-making relationships, and risk control processes. Once tokenized stocks integrate into this ecosystem, users do not need to rebuild complete on-chain operating habits, and platforms can channel existing trading demand, risk preferences, and capital management capabilities into the stock token market. Conversely, the on-chain settlement layer has become a critical tool for CEXs to expand into traditional asset trading, with platform capital entry points and liquidity organization capabilities becoming the core variables determining product growth velocity.
This round of growth has also enhanced the trading attributes of tokenized stocks. Early markets emphasized the 24/7 transferability, on-chain transparency, and composability of tokenized equities. As the market has evolved, another layer of value has come to the fore: tokenized stocks can be embedded within existing trading ecosystems, serving as a new allocation corridor between stablecoins and traditional equity assets. What users gain from tokenized stocks extends beyond an on-chain asset code to include lower capital switching costs, shorter settlement paths, more flexible trading hours, and a broader range of asset allocation choices. Trading platforms can incorporate this product into spot trading, collateral, wealth management, margin management, and capital allocation scenarios, giving tokenized stocks the foundation for continued trading volume expansion.
Robinhood's mainnet launch demonstrated another pathway for brokerage platforms to participate in this sector. Its monthly volume quickly surpassed $1 billion, showing that platforms with mature retail financial entry points can also form independent on-chain liquidity centers. Robinhood's value lies in connecting traditional brokerage services, user accounts, stock trading familiarity, and mainnet infrastructure. Following mainnet launch, the circulation range of stock tokens has expanded, allowing assets to flow into a broader array of on-chain wallets and application environments. The entry of brokerage platforms introduces a new competitive dimension to the tokenized stock market: CEXs emphasize trading efficiency and global liquidity, brokerage systems emphasize account relationships, brand trust, and conversion of traditional finance users, while public chain ecosystems provide open circulation and application composition space.
Ondo's sustained growth reflects the strategic position of RWA-native platforms in the market. Ondo's competitive focus centers on asset structures, compliance pathways, institutional-grade product capabilities, and on-chain financial composability. Its trading volume growth lags bStocks' explosive expansion, but this does not diminish its value in institutional capital and on-chain asset allocation. Tokenized stocks will form a multi-layered market going forward. CEX platforms will handle high-frequency trading and broad user traffic, brokerage platforms will accommodate the on-chain migration of traditional stock investors, and RWA-native platforms will serve asset issuance, on-chain collateralization, and cross-protocol composition needs. Different platforms serve different user structures and capital use cases. Beyond trading volume share, asset retention, position sizes, collateral utilization rates, and cross-protocol circulation efficiency all constitute long-term competitiveness.
xStocks' decline from $6.6 billion in June to the $1 billion range in July demonstrates that first-mover liquidity requires re-consolidation once new distribution channels emerge. Its June performance proved strong market demand for on-chain stock products, while July's share shift indicates that product supply, chain deployments, and asset coverage were insufficient to lock in liquidity. Tokenized stock users typically migrate toward platforms offering tighter quotes, more convenient capital conversion, and deeper trading liquidity. Platforms must continuously build a complete closed loop from issuance, market-making, trading, and asset transfer to redemption and position management to convert short-term trading volume into long-term asset accumulation.
With four platforms now dominating the market, competition in tokenized stocks has entered a liquidity center contest, and leading trading platforms may be best positioned to expand share further. Liquidity concentration generates higher quote efficiency, lower trading friction, and stronger market-making appeal, creating network effects where capital, users, and asset supply reinforce one another. The market may ultimately settle into a structure where a few high-liquidity centers coexist with several specialized platforms—head platforms handling large-scale trading and capital deployment, while specialized platforms build differentiated capabilities around specific assets, institutional services, on-chain collateralization, and cross-protocol applications.
The valuation framework for tokenized stocks must extend to financial infrastructure control. The first layer is asset rights arrangements, including custody of underlying stocks, economic rights of token holders, redemption mechanisms, and regional access rules. The second layer is liquidity quality, including trading depth, market-making participation, quote continuity, stablecoin conversion efficiency, and cross-platform capital migration speed. The third layer is distribution capability, including platform user bases, account systems, on-chain wallet penetration, and product synergies. The four platforms exhibit clear differences in their capability combinations across these dimensions; on-chain volume changes represent only the first-level reflection of the competitive landscape.
2.2 Robinhood Chain Mainnet Launch: Meme Trading as the Traffic Engine
Robinhood Chain launched its public testnet mainnet on July 1, positioned as an Arbitrum Layer 2 serving financial applications and tokenized real-world assets. Robinhood introduced Uniswap as the public AMM at launch and enabled stock tokens to circulate across wallets, DEXs, collateral, and lending scenarios. While the product design targets tokenized stocks, the actual growth engine during the on-chain launch phase came from Meme trading, launchpads, and trading bots. This trajectory closely follows public chain cold-start dynamics: high-frequency, low-barrier, socially viral assets first generate trading density, then provide the liquidity foundation for stablecoins, RWAs, and on-chain financial applications.
On-chain activity rapidly crossed the cold-start threshold in early July. Robinhood Chain's daily transaction count rose from 170,000 on July 1 to 2.76 million on July 8, peaking at 4.69 million on July 11; daily transactions in the second half of July generally remained in the 2.2 million to 4.05 million range. By the end of July, cumulative active addresses approached 3 million, with total cumulative transactions exceeding 85 million.
Address structure offers an even more valuable signal. After July 8, new addresses increased rapidly, reaching 153,000 on July 10; on July 13, new addresses hit 150,000 while returning-trader





