






Gate Institutional Weekly: Rising Rate Hike Expectations, Crypto Market Shows Relative Resilience (July 20–26, 2026)


- Key Takeaways: Last week (July 20–26, 2026), the crypto market demonstrated resilience amid surging oil prices and rising rate hike expectations, with BTC consolidating at highs and ETH posting positive returns driven by fund preference. Capital flows showed structural divergence, as institutions shifted from broad-based position rebuilding to selective allocation, while DEX activity and protocol revenues further concentrated toward top-tier applications.
- Key Factors:
- Middle East energy risks pushed Brent crude above $100 intraweek, the probability of a Fed rate hike rose to 36%, and the 10-year Treasury yield reached 4.679%, pressuring risk-asset valuations—yet the crypto market remained relatively resilient.
- Combined net inflows into BTC and ETH spot ETFs totaled approximately $138 million, down 23.9% week-over-week; capital showed a clear preference for ETH given its stronger price elasticity and lower institutional allocation base, while BTC ETFs flipped to outflows of $465 million on Thursday and Friday.
- Shifting DEX landscape: PancakeSwap's weekly volume reached $14.27 billion, overtaking Uniswap ($13.69 billion); Robinhood Chain drove rapid growth in tokenized equities and RWA trading; PumpSwap's volume climbed to $3.86 billion, fueled by social media meme momentum.
- Protocol revenues concentrated toward stablecoin issuers (Tether earning $114 million weekly, Circle approximately $45.77 million) and meme launchpads (Pump earning $7.78 million weekly), while Hyperliquid's revenue fell to $7.37 million—industry profitability is consolidating into top-tier infrastructure.
- BTC derivatives show a combination of "high-level consolidation + OI spiking then retreating + moderately positive funding rates," indicating bullish positioning but restrained leverage chasing; DVOL remains at a low of 36–38, and 25D Skew has significantly recovered, with the options market pricing range-bound consolidation rather than a directional trend.
Summary
• Middle East energy supply risks pushed oil prices higher, with Fed rate hike expectations rising to 36% and the 10-year U.S. Treasury yield briefly reaching 4.70%. The crypto market showed considerable resilience, with BTC roughly flat and ETH maintaining positive returns.
• Combined net inflows into BTC and ETH spot ETFs reached approximately $138 million. Gate TradFi platform trading volumes remained elevated, with U.S. equities re-emerging as the core allocation focus.
• PancakeSwap's trading volume surpassed Uniswap's, PumpSwap rebounded alongside social media Meme热度, and Robinhood Chain drove rapid growth in tokenized stocks and RWA trading, further dispersing DEX liquidity.
• ETH LST, Aave lending, and the Ethereum ecosystem's capital flows continued to recover, while emerging chains like Monad sustained growth. Protocol revenues continued to concentrate in high-frequency applications such as stablecoin issuance, Meme launchpads, and trading platforms, with industry profitability increasingly consolidating among top-tier infrastructure.
• BTC maintained an upward trajectory amid high-level consolidation. OI spiked before retreating, and funding rates remained positive but gradually declined, indicating continued bullish dominance. Options volumes surged in pulses around price breakouts, while 25D Skew continued to recover, showing a marked decrease in demand for short-dated downside protection.
• DVOL remained subdued within the 36–38 range, with market pricing for future volatility still restrained. The options market is leaning toward trading high-level consolidation rather than betting on directional trends.
1. Market Focus Analysis
Last week (July 20, 2026 – July 26, 2026), market narratives were jointly driven by Middle East energy supply risks, U.S. tariff policies, and major tech earnings. Attacks on tankers in the Red Sea and restricted shipping through the Strait of Hormuz pushed Brent crude above $100 intraday, closing Thursday at $100.69, up 7% on the day. Although it retreated 3.88% to $96.78 on Friday, the energy price shock re-elevated inflation and rate hike expectations. Market pricing implied the probability of a Fed rate hike at the next meeting rose from approximately 12% a week prior to around 36%. The U.S. 10-year Treasury yield briefly touched ~4.70%, settling at 4.679% on Friday, while the 30-year yield reached 5.163%, near levels not seen since 2007.
High interest rates and concerns over AI investment returns weighed on growth stocks. Alphabet raised its full-year capex guidance, with Q2 AI-related investment nearly doubling YoY to ~$45 billion. Tesla and Alphabet fell 14.5% and 7.1%, respectively, on Thursday. For the week, the S&P 500 declined 0.6%, the Dow fell 0.4%, and the Nasdaq dropped 2.1%. Risk assets faced valuation and liquidity pressures, but crypto proved relatively resilient: BTC gave back most of its gains after an initial spike, while ETH posted positive returns due to capital rotation. Overall, the oil price shock and rising long-end yields limited crypto valuation expansion, though lower oil prices over the weekend and improved risk sentiment provided some market support.

2. Liquidity Analysis
2.1 Institutions Quickly Shifted to Profit-Taking After Increased Oil and Tech Stock Volatility
Last week, U.S. BTC spot ETFs recorded total net inflows of approximately $34 million, a 55.10% decrease from the previous week's $76 million. Cumulative inflows from Monday to Wednesday reached $499 million, but outflows over Thursday and Friday totaled $465 million, indicating institutions quickly pivoted to profit-taking following heightened volatility in oil, rates, and tech stocks. By product, Grayscale Bitcoin Mini Trust (BTC) saw the largest net inflows at approximately $86 million, while IBIT recorded the largest net outflows at roughly $96 million. Total BTC ETF AUM, adjusted from the prior base of approximately $77.7 billion with price and net flow changes, is estimated at around $78.3 billion as of July 24, an increase of ~0.8% WoW.
ETH spot ETFs saw combined net inflows of approximately $104 million, down only 1.61% from the previous week's $106 million, marking a third consecutive week of net inflows. ETHA led with ~$96 million in inflows, while FETH was the weakest performer with net outflows of ~$6 million. Total ETH ETF AUM, also using proxy estimates, rose from ~$9.94 billion to ~$10.1 billion, an increase of ~1.6%. Overall, combined net inflows for BTC and ETH ETFs were approximately $138 million, down ~23.9% WoW. Capital has not fully exited crypto assets but is clearly rotating toward ETH, which offers greater price elasticity and a lower institutional allocation base, shifting institutional sentiment from broad replenishment to structural selection.
2.2 TradFi Liquidity
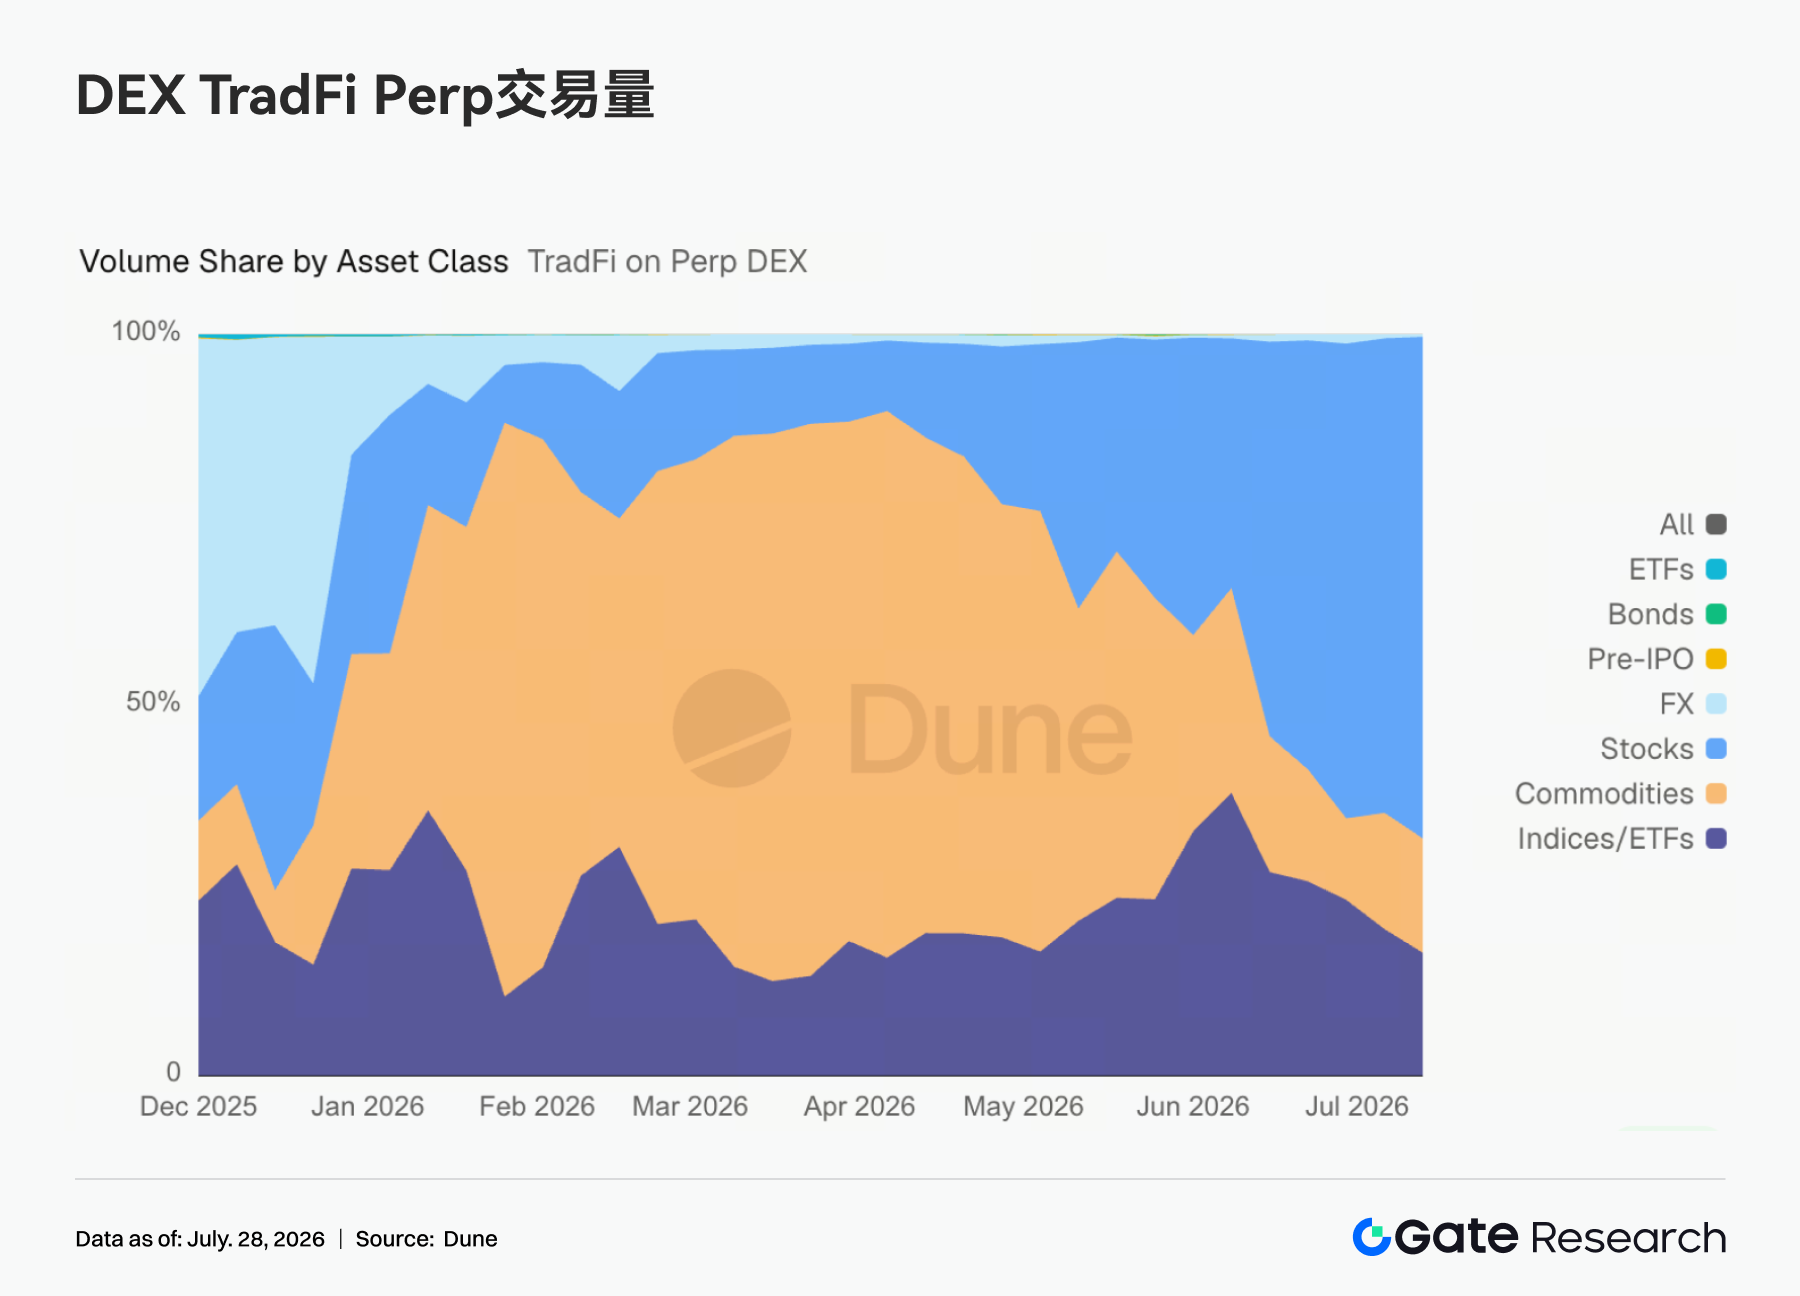
• TradFi Perp DEX: Over the past week, Gate's platform-wide TradFi trading structure continued to concentrate toward equity assets. The share of stock trading volume climbed steadily from ~55% to nearly 70%, re-establishing itself as the platform's dominant TradFi product category. Commodities' share declined from ~35% to ~15%, cooling significantly after being a previous hotspot. Index/ETF products maintained a stable share of ~15%–20%, forming the second-tier trading category. Other asset classes such as FX, bonds, Pre-IPO, and ETFs maintained consistently low trading shares. Overall, capital is flowing back from cyclical commodities trading to the stock market, with the platform's TradFi trading focus once again centered on equities and a more concentrated trading structure.
• Gate TradFi Trading Volume: Over the past week, Gate's stock trading volume remained elevated and stable, with weekly turnover maintaining a range of approximately $85 billion to $100 billion, showing significantly reduced fluctuations compared to before. CFD remained the dominant source of trading volume, while perpetual product volumes saw a slight uptick. Overall, with relatively stable market risk appetite, trading activity in equities on the platform remained robust.

• Gate Stock Asset Trading Volume: Over the past week, Gate's equity asset allocation structure saw notable adjustments. U.S. stocks remained the primary allocation but its share rebounded sharply from ~52% to ~71%, re-establishing itself as the absolute core market. Korean stocks' share dropped significantly from ~28% to ~7%, unwinding the previous concentrated allocation. Meanwhile, the shares of ETFs and Hong Kong stocks both increased slightly to ~14% and 8%, respectively, indicating users are maintaining their core U.S. equity positions while adding diversification into ETFs and HK stocks. The overall asset structure has shifted from a Korea-centric tilt back to a diversified allocation anchored in U.S. equities.

• TradFi Order Book Depth: We selected XAUT, the highest TradFi volume asset, to analyze its order book depth (Delta). Over the past week, XAUT order book liquidity remained generally strong. On July 21-22, bid-side depth briefly turned negative, widening the liquidity gap and corresponding to a temporary price dip to ~$4,000. Buy-side depth quickly recovered, with net liquidity turning positive from July 22-24, accompanied by a price rebound to ~$4,150. From July 25-27, order book depth remained positive with converging fluctuations. Though brief selling pressure appeared, it was absorbed by new buy orders. Overall, XAUT showed strong bid-side absorption capacity over the past week, with continuously improving liquidity conditions. The price consolidated at highs and ultimately stabilized around the $4,080–$4,100 range, reflecting persistently bullish market sentiment.
3. On-Chain Data Insights
3.1 Uniswap Declines from Highs, PancakeSwap Takes the Lead, RWA and Social Meme Trading Create Clear Diversion
This week, PancakeSwap processed approximately $14.27 billion in trading volume, surpassing Uniswap's $13.69 billion. Uniswap declined notably from the previous week, but its trader count continued rising to approximately 1.01 million. Meme attention driven by Robinhood Chain persists, but large-ticket volume is being diverted. Over the past week, RWA scale on Robinhood Chain grew rapidly, with tokenized stocks beginning to generate real trading volume, although mainstream on-chain trading remains dominated by Memes and stablecoins. Meanwhile, Native volume surged from approximately $447 million to $3.47 billion, related to routing demand from its RWA/stock trading pairs like QQQB and NVDAon. PumpSwap volume rose to approximately $3.86 billion, with trader count increasing to ~1.64 million, signaling renewed activity in short-cycle Meme trading driven by social media. However, Meteora, Raydium, and Whirlpool continued to decline, indicating no comprehensive recovery on the Solana side.

3.2 Stablecoin Supply Largely Sideways, Competition Shifts to Distribution Channels and Yield Allocation
This week, USDT was roughly flat, while USDC dipped slightly from ~$75.29 billion to $74.44 billion. Top stablecoins saw no significant growth. USDe, USD1, and PYUSD declined, suggesting yield-bearing and brand-driven stablecoins did not continue expanding in the short term. In contrast, USDG, USDGO, RLUSD, and GHO maintained growth, indicating new demand emerging from specific ecosystems and use cases. The hot topic in the stablecoin market this past week was distribution rights competition: Visa's Stablecoin Platform integrated Open USD, packaging stablecoin issuance, wallets, payments, and corporate treasury operations into institutional products. Meanwhile, the U.S. GENIUS Act's detailed rules failed to be fully implemented on schedule, leaving compliant stablecoin issuers in a waiting period for regulatory clarity. Without significant new USD entering the market, payment companies, brokerages, and DeFi yield gateways are redistributing the channel value of stablecoins.

3.3 ETH LST Continues Recovery, SOL and HYPE Staking Assets Extend Cooling Trend
The LST sector continues to show divergence. Lido's TVL rose to approximately $17.5 billion, with Rocket Pool, StakeWise, Liquid Collective, and mETH Protocol all posting modest gains. ETH staking assets remain the core focus of capital preference. Catalysts include ETH ETF inflows, Robinhood Chain using ETH as gas and settlement asset, and RWA/stablecoin infrastructure increasingly building around Ethereum. Conversely, SOL LSTs such as Sanctum, Jito, Jupiter Staked SOL, and Binance Staked SOL continued their gradual decline; Kinetiq kHYPE and stHYPE also retreated.

3.4 Aave Lending Driven by Ethereum and Monad, Divergence Among Emerging Chains Widens
Aave lending balances continue to concentrate on Ethereum, with Ethereum market borrow volume rising to approximately $8.65 billion, up ~5.7% WoW. Monad borrow balances increased to approximately $192 million, maintaining rapid growth, tied to the Aave V3 launch on Monad, early deposit/lending incentives, and liquidity expectations for the new chain. Base saw a modest rebound while Arbitrum remained broadly stable. Markets like Plasma, Mantle, and MegaETH continued to decline, with capital exiting emerging chains that offer weaker incentives or higher uncertainty. Given competition from Robinhood Earn, Morpho, and Aave Stable Vaults, the current lending market's focus is on who can become the credit layer behind brokerages, wallets, and stablecoin yield products. Aave's primary market remains stable, but consumer-grade yield distribution is being captured by lighter vault models like Morpho in terms of narrative.

3.5 Aave Rates Remain Restrained, Tail-End USDC Funding Pressure Not Fully Resolved
Aave's Ethereum main market rates remained broadly stable overall. The average USDC borrow rate stood at approximately 4.17%, similar to the previous week, but the peak rate still reached ~13.7%, indicating that USDC can still experience short-term tightness during periods of concentrated hot trading. The average USDT rate was ~3.64%, with tail-end volatility notably lower than previous highs. The average WETH rate rose to ~2.10%, though still at low levels. The increase in lending balances has not led to systemic rises in funding costs, suggesting leverage in the ETH direction is not aggressive. This appears more like institutional and arbitrage capital rotating within core markets.

3.6 Protocol Revenue Structure Diverges, Pump Rebounds While Hyperliquid Cools Off
Tether and Circle generated weekly revenues of approximately $114 million and $45.77 million, respectively, with stablecoin issuance serving as the industry's revenue foundation. Pump's revenue rose to approximately $7.78 million, surpassing Hyperliquid, corroborated by the synchronous recovery in PumpSwap volume and trader counts. This indicates Meme trading is not dead but has shifted from large caps to shorter-cycle launchpads and social media hotspots. Hyperliquid's revenue fell to ~$7.37 million; on-chain TradFi perpetuals remain active, but revenue elasticity from crypto-native perps has declined. Axiom Pro, EdgeX, and Aave saw revenue growth, while Base, Aerodrome, and Titan Builder declined. Overall, the sectors truly capable of generating sustainable revenue remain stablecoin issuance, Meme launch/trading, and a select few high-frequency derivatives gateways.

4. Derivatives Tracking
4.1 BTC Price Consolidates at Highs, OI Retreat After Spike Signals Restrained Leveraged Chasing
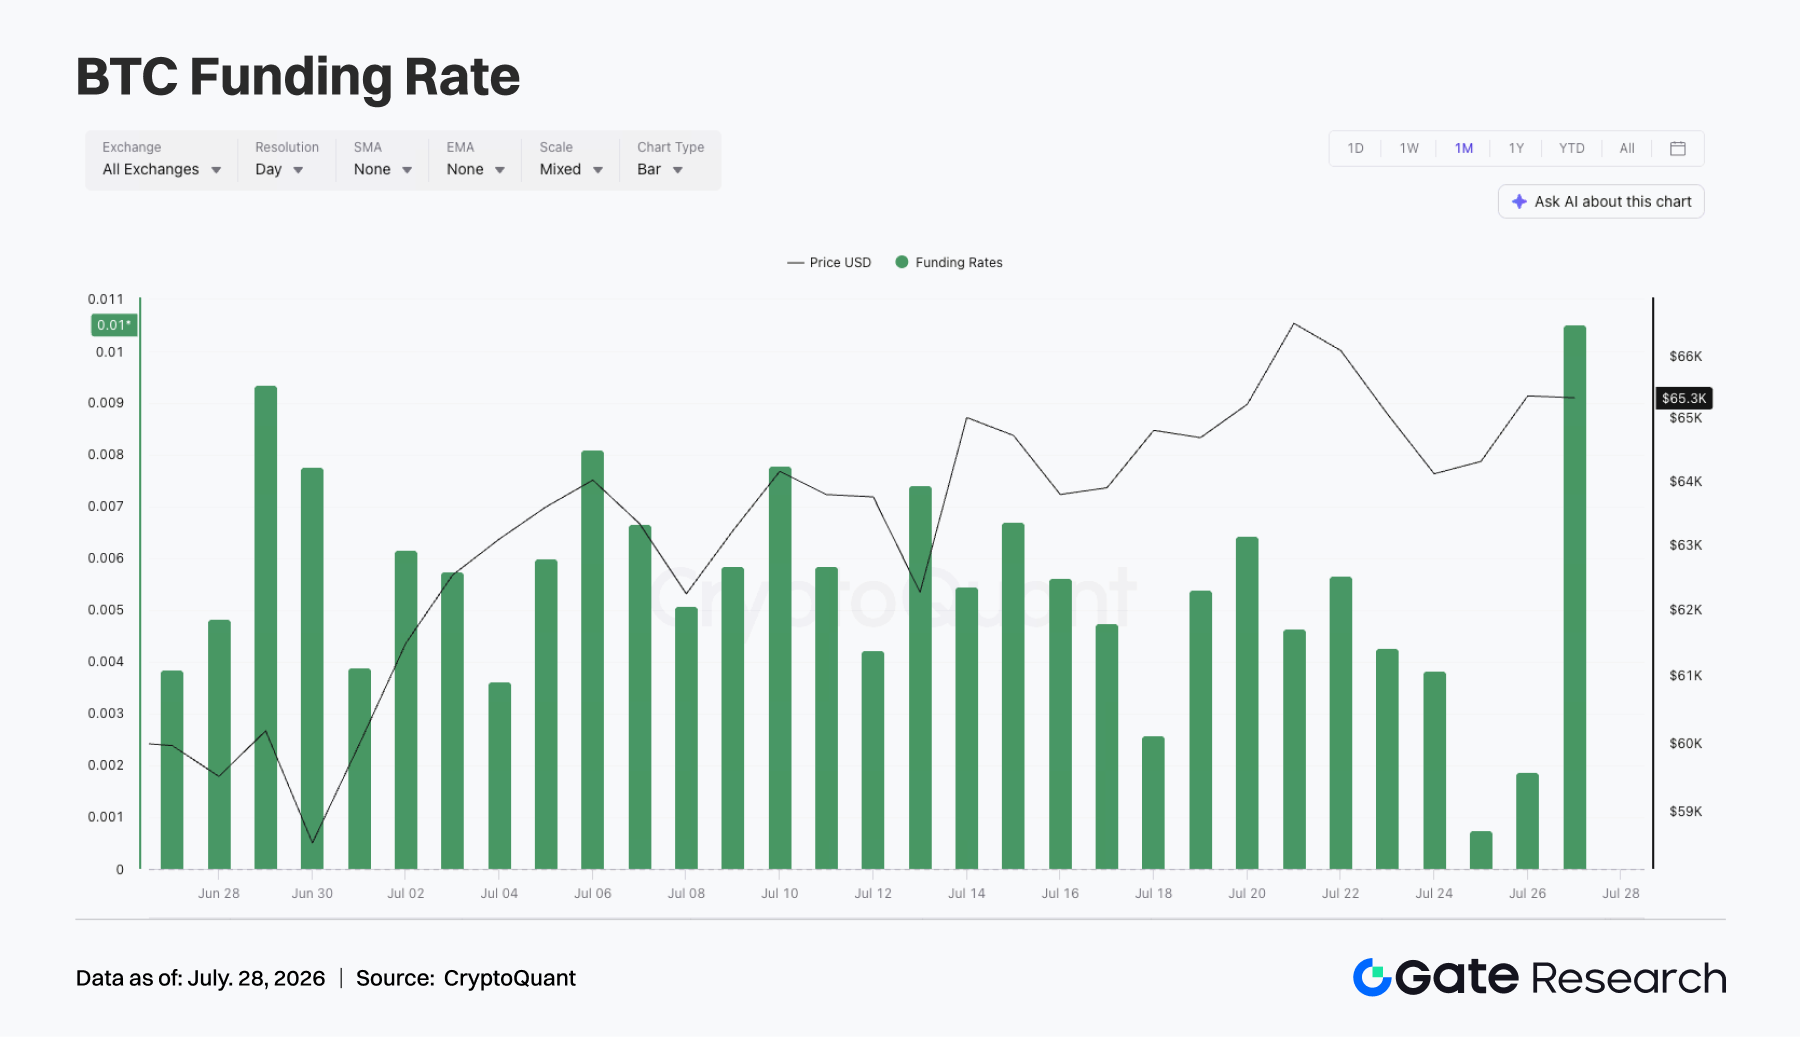
Last week, BTC prices maintained a high-level consolidation structure overall. Early in the week, prices traded around $64,000–$65,000, briefly testing ~$66,000 on July 21-22 before pulling back to ~$64,000 and recovering above $65,000 over the weekend. Overall, the price center has moved higher than previous weeks, but a sustained breakout has not yet formed. On OI, this week saw a phase-specific spike. Around July 20, OI stood at approximately $21.6 billion, then quickly rose to ~$23.1 billion on July 21 alongside the price uptick, marking recent highs. OI subsequently retreated to ~$22 billion and remained in the $22.2–$22.5 billion range through the latter half of the week. High-level price consolidation combined with an OI spike-and-retreat suggests leveraged capital briefly participated in breakout trades, but the momentum for chasing higher was not sustained. Funding rates stayed positive all week but trended from higher to lower levels. Early in the week, funding rates remained around 0.005–0.006, then gradually declined, briefly approaching neutral around July 25, indicating that long-side crowding had eased somewhat. Nonetheless, funding rates did not turn negative, showing that the market structure remains predominantly long-biased.
In summary, this week's BTC derivatives market exhibited a combination of "high-level price consolidation + elevated OI volatility + moderately positive funding rates." Longs currently hold the advantage, but leveraged chasing appetite has moderated. If BTC holds above $66,000, OI could expand again; if prices fall back below $64,000, attention should be paid to unwinding pressure from recently added long positions.
4.2 Options Volume Spikes Periodically, Short-Term Volatility Trading Demand Released Intensively
The options market saw clear pulse-style volume expansion last week. On July 20, volume was approximately 18,000 contracts, quickly rising to ~45,000 contracts on July 21, marking the weekly high. From July 22-24, volume retreated to the 20,000–24,000 contract range, then further declined to ~4,000





