






Gate Institutional Weekly: Market Defensive Sentiment Clearly Eases, ETH LST Continues Recovery Trend (July 13 – July 19, 2026)


- Key Takeaways: Last week, the crypto market moved higher amid a tug-of-war between easing inflation and geopolitical oil price shocks. BTC and ETH rose 1.48% and 3.62% respectively, with ETF flows returning to net inflows and ETH seeing more pronounced capital inflows. Market attention shifted from Solana Meme to Robinhood Chain's "RWA + Tokenized Stocks + Meme" narrative, though protocol revenue growth remained limited and leverage capital stayed restrained.
- Key Factors:
- U.S. June CPI fell 3.5% year-over-year, with core CPI dropping to 2.6%. However, Middle East tensions pushed oil prices up 15% weekly, keeping Treasury yields elevated and limiting the rebound in risk assets.
- BTC spot ETFs recorded net inflows of $76 million (down 61.75% QoQ), while ETH ETFs saw net inflows of $106 million (up 25.15% QoQ). Capital was clearly concentrated in low-fee products from major issuers like BlackRock.
- Gate TradFi weekly trading volume rebounded to approximately $90 billion, with stock contract trading volume rising to 65%–70% of total. U.S. equity allocation recovered to 50%, reflecting more diversified asset allocation.
- Uniswap active traders rose to approximately 988,000. Meme assets on Robinhood Chain (such as CASHCAT) drove on-chain trading activity, benefiting the ETH ecosystem, with Lido TVL climbing to $17.09 billion.
- Stablecoin competition has shifted toward compliance and distribution channels. Visa launched a stablecoin platform integrated with Open USD, putting pressure on USDC's reserve yield model. USDe and PYUSD supply saw modest increases.
- The derivatives market indicates weakening defensive sentiment: BTC funding rates remain positive without notable OI expansion, the 25D Skew has recovered to the -3 to -6 range, and DVOL holds at a low of 35.5–37, with volatility risk of rapid expansion after a breakout.
Executive Summary
• Cooling US inflation data improved market risk appetite, but rising oil prices amid Middle East tensions kept Treasury yields elevated and limited risk asset rebounds. BTC and ETH rose 1.48% and 3.62% respectively, with ETF flows returning to net inflows overall, particularly driven by stronger capital reflows into ETH.
• TradFi trading focus shifted back toward equity assets, with stock contract volume share rising to approximately 65%–70%. Gate TradFi weekly turnover recovered to around $90 billion, with allocation to US equities and ETFs increasing in tandem.
• Robinhood Chain shifted market attention from Solana Meme coins to the "RWA + Tokenized Stocks + Meme" narrative. Uniswap user numbers continued to grow, benefiting the ETH ecosystem, while Lido TVL and Aave Ethereum lending scale kept expanding.
• Stablecoin competition is shifting from scale toward compliance and distribution channels, with Open USD and the GENIUS Act becoming market focal points. Meanwhile, protocol revenue did not grow in tandem with the hotspots; only stablecoins, lending, and top-tier derivatives protocols maintained strong profitability.
• BTC continued to oscillate within the $63,000–$65,000 range. Funding rates remained positive, but OI did not expand significantly, indicating bullish sentiment alongside restrained leverage participation.
• The options market was dominated by monthly contract rollovers and risk management. The 25D Skew continued to recover while DVOL stayed range-bound at lows, reflecting diminished defensive sentiment, though volatility still carries the risk of rapid expansion upon a breakout from the current range.
1. Market Focus Interpretation
Last week (July 13–19, 2026), global asset markets were pulled between "easing inflation" and "geopolitical oil price shocks." The US June CPI fell 0.4% month-over-month, with the year-over-year rate dropping from 4.2% in May to 3.5%, and core CPI declining to 2.6% year-over-year. June PPI also fell 0.3% month-over-month, indicating that lower energy prices temporarily alleviated inflationary pressures. Following the data release, markets initially priced down the probability of further Fed rate hikes, risk appetite improved, and BTC moved back toward the $65,000 USDT level. However, this rally didn't sustain through the week as Middle East tensions pushed oil prices higher again. According to LPL, crude oil rose 15.01% last week, and AP noted Brent crude gained another 4.6% on Friday amid war concerns related to Iran. The oil price rebound re-elevated inflation expectations, preventing a clear downward trend in Treasury yields despite some softening; the 10-year yield held around 4.55%.
In US equities, AI and chip trades experienced significant crowding unwinds. The S&P 500 fell 1.6% last week, the Dow declined 0.9%, and the Nasdaq dropped 2.9%. Capital rotated out of high-valuation tech stocks, and combined with imported inflation concerns from higher oil prices, the crypto market ended up in a mixed state of "macro tailwinds providing support, while risk asset valuations face headwinds." BTC rose 1.48% for the week and ETH gained 3.62%, outperforming the Nasdaq, indicating that the crypto market remains supported by cooling inflation, regulatory expectations, and some capital catch-up buying. However, multiple intraweek rallies faded, showing that oil prices and geopolitical risks are still capping leverage expansion appetite.

2. Liquidity Analysis
2.1 Institutional Sentiment Shifts from Defensive to Cautious Repair, ETF Inflows Return
Last week, US spot BTC ETFs recorded total net inflows of $76 million, down 61.75% from the prior week's $197 million. Monday saw net outflows of $425 million, followed by four consecutive days of inflows, indicating that institutional demand is recovering, albeit with weaker intensity and stability. IBIT saw the largest inflows at $204 million, while FBTC recorded the largest outflows at $181 million, with GBTC also seeing $53 million in outflows. Capital clearly concentrated into leading low-fee products. Total BTC ETF AUM rose from approximately $77.42 billion to roughly $77.6–$77.72 billion, an increase of about 0.3% week-over-week.
ETH ETFs recorded total net inflows of $106 million, up 25.15% from the prior week's $84 million. ETHA led with $135 million in inflows, while FETH was the weakest with $22 million in outflows; capital again concentrated in BlackRock products. Due to the lack of a unified, precise public total AUM snapshot for July 17, estimated based on the prior week's ~$9.59 billion AUM, Friday's ETH price movement, and net subscriptions/redemptions, period-end AUM is estimated at approximately $9.94 billion, up roughly 3.6% week-over-week. Overall, institutional sentiment is shifting from defensive to cautiously repairing: ETH's flow and asset base improvement are more solid, while BTC remains weighed down by significant redemptions in certain products and cannot yet be seen as a full return of risk appetite.
2.2 TradFi Liquidity
• TradFi Perp DEX: Over the past week, the trading structure on TradFi Perp DEX continued to concentrate toward equity assets. Stock contract volume share rose to approximately 65%–70%, hitting a recent period high, indicating sustained capital flows into equity trading such as US, Hong Kong, and Korean stocks. Meanwhile, commodity trading share further declined to around 10%, significantly cooling from Q2 highs. Index/ETF maintained a stable share of around 20%. Overall, the market's trading focus has shifted back from oil-driven commodities to equity assets, reflecting improved risk appetite and continued recovery in equity trading demand.

• Gate TradFi Volume: Over the past week, total Gate TradFi turnover reached approximately $90 billion, up modestly by about 4%–5% from the previous week, ending two consecutive weeks of decline and maintaining a high level of trading activity. CFD remains the absolute core business with turnover of approximately $86 billion, accounting for about 95% of total volume. Perp turnover held within the $4–5 billion range, representing about 5% of total volume and showing stable performance. With the start of the US earnings season and improving market risk appetite, stock-related TradFi products saw sustained active trading, driving a moderate recovery in platform volume and demonstrating resilient demand for equity allocation.

• Gate Stock Asset Trading Volume: Over the past week, the structure of Gate's stock assets adjusted again. US stocks' share rebounded to approximately 50%, Korean stocks fell to around 28%, ETF share rose to about 13%, and Hong Kong stocks increased to roughly 8%. This indicates that capital is reallocating to US equities ahead of the US tech earnings season and amid improved market risk appetite, while some funds are flowing back into Hong Kong stocks and ETF products. Asset allocation is transitioning from the previously heavy concentration in Korean stocks toward a more diversified balance across US stocks, Korean stocks, and ETFs, resulting in a more distributed overall investment structure.

• TradFi Order Book Depth: We selected XAUT, the highest-volume TradFi asset, to analyze its order book depth (Delta). Over the past week, XAUT's order book depth shifted from bullish to bearish, indicating a significant change in market liquidity structure. From July 15–17, order book Delta recorded large positive values, occasionally exceeding $2 million per hour, showing significantly strengthened bid-side depth as market makers continuously added liquidity on the buy side. XAUT price held steady around $4,000–$4,020. However, after July 18, order book depth noticeably declined, with positive Delta rapidly decreasing. On July 20, multiple negative Delta readings of -$800K to -$1 million occurred, indicating significantly increased ask-side depth and a shift in market liquidity toward the sell side. Although XAUT price remained stable around $4,000 without a notable decline, bid-side absorption capacity weakened considerably compared to earlier in the period.
3. On-Chain Data Insights
3.1 Uniswap Pulls Back from Highs but Users Continue to Grow; Robinhood Chain Meme Trading is the Attention Core
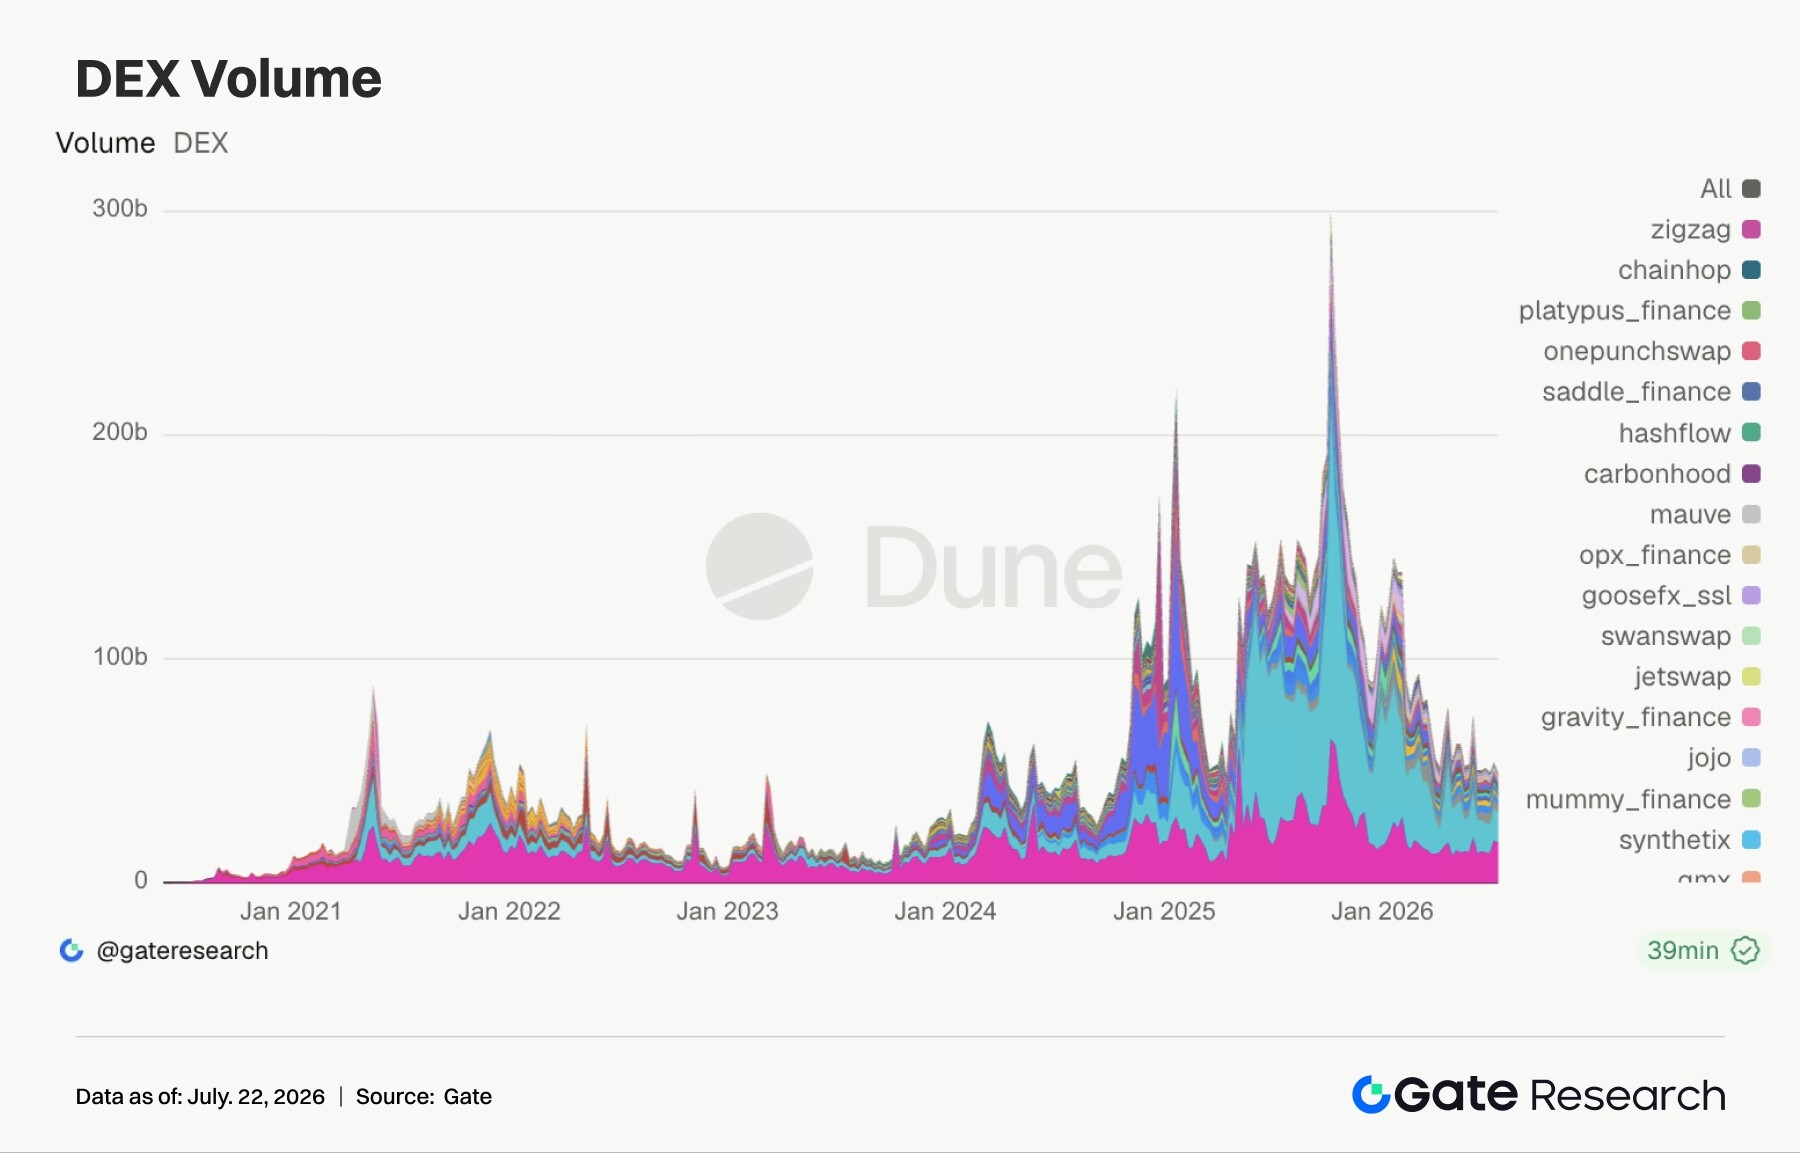
Last week, Uniswap's volume declined slightly from the prior week, but trader counts rose to approximately 988,000, indicating that while capital scale cooled, participating addresses continued to expand. Over the past week, Robinhood Chain's core narrative continued to develop: it was originally positioned around tokenized stocks and RWA, but actual early activity was primarily driven by meme assets like CASHCAT, with on-chain DEX trading briefly surging to the forefront among major L2s. As Uniswap is Robinhood Chain's launch AMM and a primary Ethereum-family trading gateway, it absorbed this hybrid "brokerage chain + Meme + RWA" narrative. PancakeSwap, PumpSwap, Aerodrome, Raydium, and Whirlpool all declined from the prior week, as high-frequency speculation on BNB Chain and Solana did not sustain momentum. Market attention shifted from Solana launchpad-style small caps toward Robinhood Chain and the narrative of mainstream assets being tokenized on-chain.
3.2 Stablecoin Supply Enters a Layering Phase; Open USD and GENIUS Act Shift Competition from Scale to Distribution and Compliance
Last week, USDT remained roughly flat while USDC declined slightly, with no significant expansion among the top stablecoins. The notable structural change was USDe's modest recovery to approximately $5.26 billion, PYUSD rising to around $2.2 billion, GHO increasing from roughly $600 million to $700 million, and USDGO also continuing to expand. Meanwhile, USDS, USD1, USDG, and RLUSD declined. US stablecoin regulation remained a market focus last week, with GENIUS Act implementation rules progressing slower than expected. Concurrently, Visa launched a stablecoin platform integrating Open USD, and the distribution network behind Open USD—including Visa, Stripe, Mastercard, Coinbase, and BlackRock—began pressuring USDC's reserve yield model. Stablecoin competition has shifted toward who can secure real distribution channels with payment companies, brokerages, wallets, and DeFi protocols. Institutional capital will continue to favor compliant dollar-denominated assets, but yield distribution and channel control are being repriced.

3.3 ETH LST Continues to Recover While SOL and HYPE Staking Assets Face Pressure
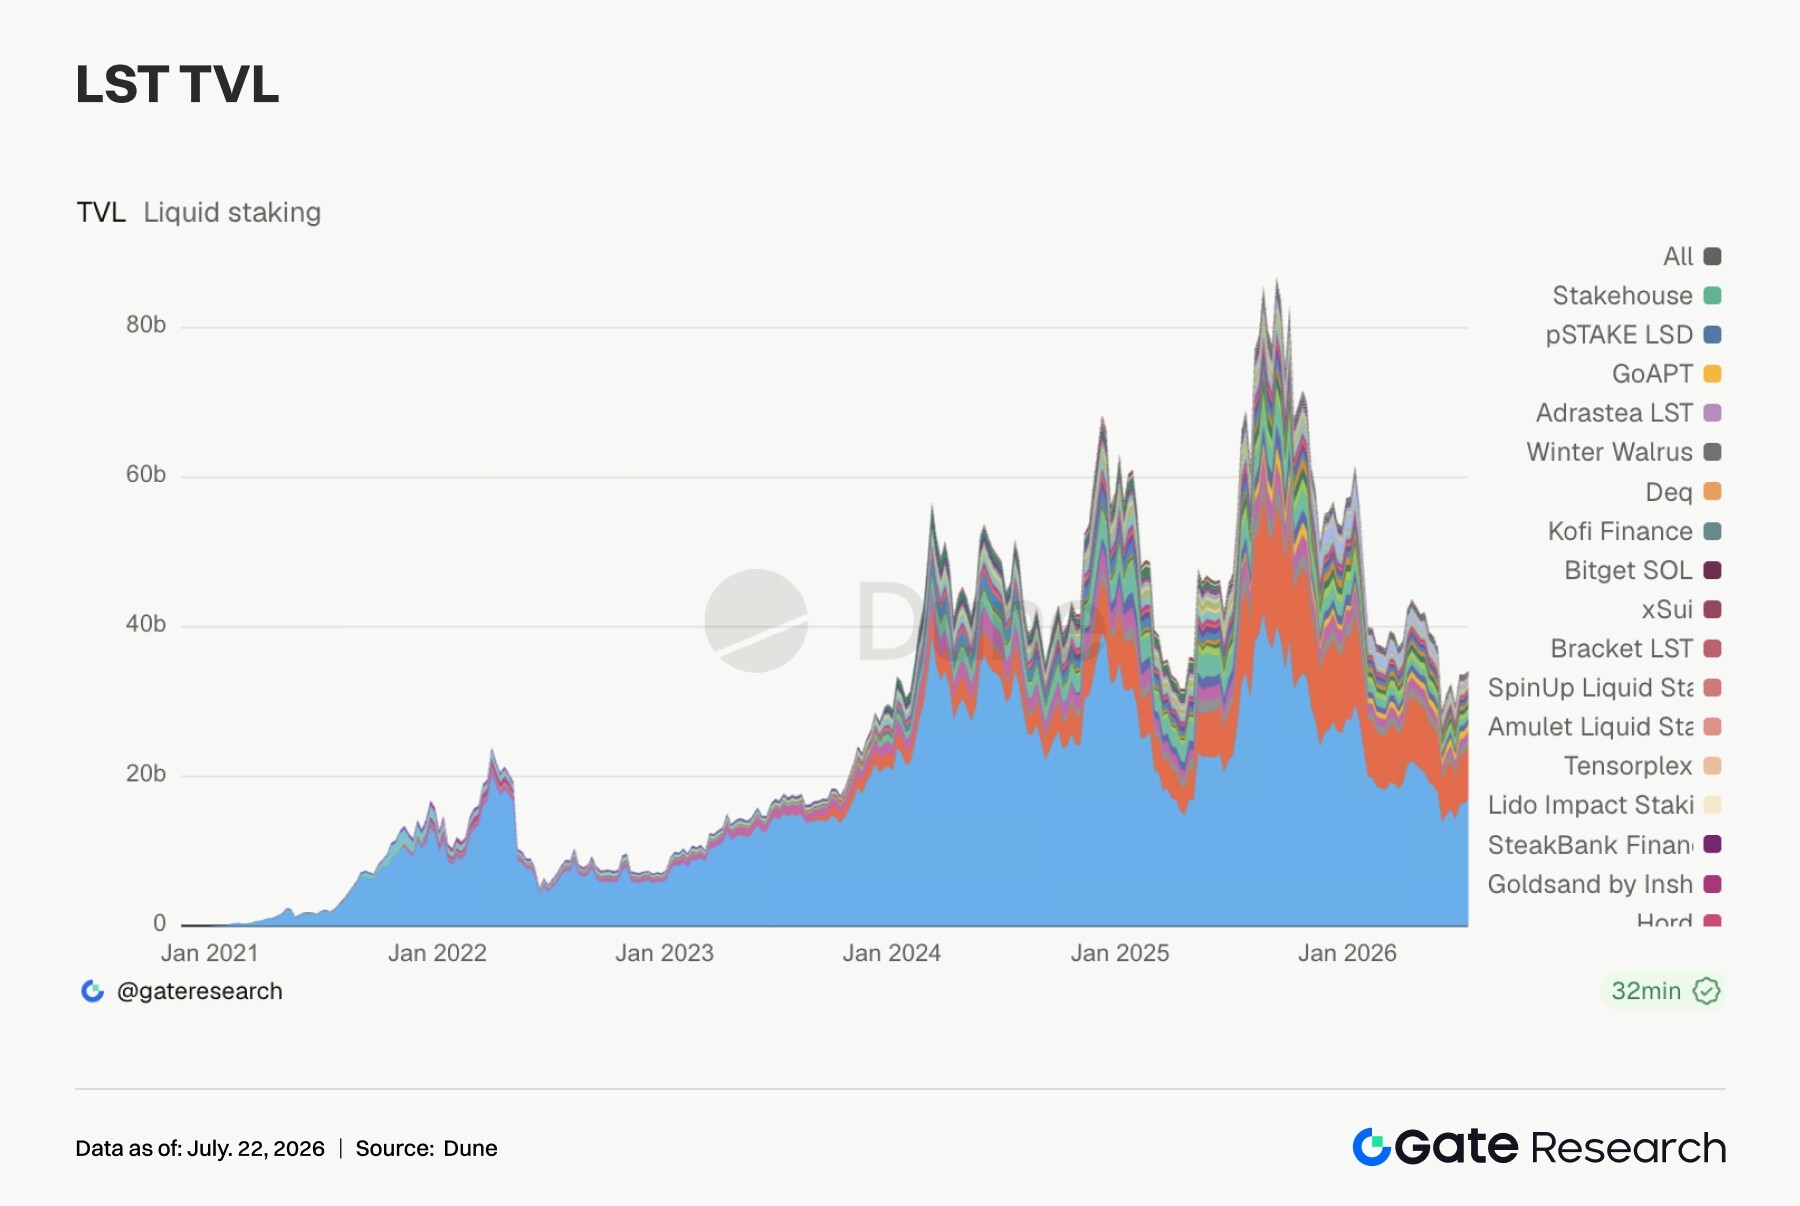
Last week, the LST sector showed clear divergence. Major Ethereum-side protocols continued to expand, with Lido TVL rising to approximately $17.09 billion. Rocket Pool, StakeWise, Liquid Collective, and mETH Protocol all recorded growth. Over the past week, ETH clearly outperformed most major crypto assets, with the core catalyst being spot ETH ETF inflows, particularly BlackRock products absorbing the majority of incremental capital. Robinhood Chain also added to the narrative demand for ETH as settlement and gas asset. Conversely, SOL-side staking assets performed weakly, with Jito, Jupiter Staked SOL, and several Solana LSTs declining, reflecting the retreat of high-beta assets following the cooling of Solana meme trading. Kinetiq kHYPE and stHYPE also moved lower, as Hyperliquid/HYPE-related staking assets did not follow ETH into a new expansion phase.
3.4 Aave Lending Driven by Ethereum Main Market; Monad Grows Fast but Emerging Chains Show Sharp Divergence
Aave's lending scale continues to concentrate toward Ethereum, with the Ethereum market's borrow balance rising to approximately $8.18 billion, up about 5% from the prior week. This aligns with ETH ETF inflows, ETH price strength, and the Ethereum-family risk appetite driven by Robinhood Chain/RWA narratives. Arbitrum grew slightly, Base remained broadly stable, and Plasma declined modestly but still maintained a scale of around $850 million. Emerging chains showed more pronounced divergence. Monad's borrow balance surged from approximately $92.05 million to about $170 million, showing capital willingness to explore early opportunities on new narrative chains. However, MegaETH dropped sharply from roughly $118 million to about $11.02 million, with Avalanche, Mantle, and Ink also declining. Lending capital is rotating toward only those markets with clear liquidity and incentive expectations.

3.5 Aave Rates Show Financing Conditions Remain Restrained; USDC Tail Pressure Not Fully Resolved
Last week, Aave Ethereum main market rates remained broadly stable. The average USDC borrow rate was approximately 4.19%, slightly up from the prior week, with intraweek peak rates still near 14%, indicating that USDC experiences temporary tightness when hot trades concentrate. The average USDT rate declined from approximately 3.87% to 3.54%, with peak rates falling from 9.37% to 3.74%, showing significant easing of tail pressure. The average WETH rate edged down to approximately 2.02%, and ETH borrow balance growth did not translate into aggressive leveraged long positioning. ETH price and ETF flows provided directional guidance, but traders remain disciplined with leverage; stablecoin financing demand is primarily driven by short-term hotspots and arbitrage.

3.6 Protocol Revenue Does Not Expand Broadly with Hotspots; Meme Trading Cooling Suppresses Application-Layer Revenue
Last week's protocol revenue structure showed many hotspots but limited profit diffusion. Tether generated approximately $112 million in revenue, roughly flat. Circle's revenue fell to about $38.5 million, impacted both by a slight supply contraction and by competitive narratives from new entrants like Open USD. Hyperliquid's revenue edged up to approximately $8.62 million, remaining the core of on-chain derivatives revenue, though growth was modest. Pump's revenue declined from roughly $6.32 million to about $5.28 million, with GMGN, Jupiter, Axiom Pro, Phantom, and EdgeX all declining notably, indicating that Meme and trading application heat is cooling from the prior week's highs. Aave revenue rebounded slightly, while Base revenue grew significantly, reflecting that Ethereum/L2 infrastructure continues to benefit from mainstream narrative reflows. Robinhood Chain, RWA, ETH ETFs, and stablecoin policy can generate attention, but only stablecoin issuance, core lending, and top derivatives protocols can consistently accrue revenue.

4. Derivatives Tracking
4.1 BTC Funding Rates Remain Positive; Price Oscillates at Highs but Leverage Expansion is Limited
Last week, BTC price maintained an overall oscillating recovery pattern. At the start of the week, price traded around $64,000, briefly testing near $65,000 on July 14, pulling back to around $63,000 around July 16, and recovering to the $64,000–$65,000 range by the weekend. Overall, the price center of gravity moved higher than the prior week, but no one-sided breakout occurred. In terms of OI, the range-bound oscillation continued through the week. OI was approximately $21.4 billion around July 13, briefly rising above $22 billion on July 14 during the price uptick, subsequently falling back to around $21.2 billion, before recovering to approximately $21.6 billion by the weekend. The price holding at highs without sustained OI expansion suggests that leverage participation has recovered somewhat but has not formed a crowded chase higher.
Funding rates remained positive throughout the week, mostly oscillating between 0.005% and 0.008%, indicating that long sentiment still dominates. Notably, funding rates rose again around July 20, suggesting strong market expectations for further upside. However, given the price action, positive funding did not push BTC into a rapid breakout, reflecting cost pressure on long positions. In summary, last week's BTC derivatives market showed a structure of "price oscillating at highs + positive funding rates + range-bound OI." This is not a typical deleveraging state, but long sentiment is already





