






Gate Institutional Monthly Report | High Interest Rates Suppress Risk Appetite, Gate Becomes Core Distribution Gateway for Polymarket


- Core View: In June 2026, the global crypto market exhibited a pattern of volatility and divergence driven by easing geopolitical tensions and high interest rate constraints, with institutional capital showing a strong risk-off sentiment; the reshaping of prediction market distribution channels and the on-chain evolution of physical trading cards emerged as structural highlights, while macro developments such as the Fed's hawkish pivot, Japanese banks' stablecoin initiatives, and the SEC's tokenized securities pilot are profoundly shaping the industry's trajectory.
- Key Factors:
- Bitcoin and Ethereum spot ETFs saw sustained net outflows in late June, with institutional investors systematically reducing crypto exposure, reflecting a "de-risk first, observe later" behavioral pattern.
- A pronounced global style rotation occurred in June, with AI leaders (NVIDIA down 14.30%, Broadcom down 25.12%) correcting from highs while healthcare showed defensive strength (Eli Lilly up 14.94%); gold and crude oil weakened as markets shifted from crowded trades to valuation rebalancing.
- The Polymarket Builders channel ecosystem expanded, with Gate becoming the largest distribution gateway by ranking first in weekly trading volume — exchanges are reshaping the traffic structure of prediction markets; the Physical TCG protocol generated over $25 million in fees in June, with Solana accounting for approximately 69% and leading sector growth.
- Kevin Warsh chaired his first FOMC meeting, with the Fed's statement removing language on rate cuts for the remainder of the year; the dot plot suggested nine officials anticipate further hikes, shifting the policy narrative from "waiting for cuts" to "wary of additional hikes," suppressing valuations of longer-duration risk assets.
- Japan's three major banks (MUFG, Sumitomo Mitsui, and Mizuho) plan to jointly issue a yen-pegged stablecoin by March 2027, while the Japanese government is also promoting its use in Asian settlement — stablecoin competition is entering a phase dominated by sovereign currencies and major banks.
- The SEC is considering allowing crypto firms to pilot tokenized stock trading under an "innovation exemption"; if implemented, this would extend RWA from tokenized Treasuries (approximately $15 billion in scale) to stock infrastructure experiments, though shareholder rights, clearing, and custody loops remain unresolved.
Executive Summary
• In June 2026, global markets remained range-bound amid easing geopolitical risks and persistent high interest rate constraints. The cryptocurrency market continued its structural divergence, with institutional capital maintaining a cautious stance.
• ETF capital flows recorded sustained net outflows in late June, with both Bitcoin and Ethereum spot ETFs under pressure, reflecting institutions reducing overall crypto asset exposure.
• Global equity markets saw a style rotation, with AI leaders undergoing high-level pullbacks, defensive sectors like healthcare outperforming, while gold and crude oil weakened amid structural differentiation across commodities.
• Prediction markets and consumer-facing RWA continued to heat up, with the Polymarket builder ecosystem expanding steadily. Physical TCG drove the on-chain tokenization of physical collectibles into a phase of rapid growth.
• Global regulators and traditional financial institutions accelerated blockchain adoption, with Japan's three major banks advancing a yen stablecoin initiative and the U.S. SEC launching a regulatory pilot for tokenized stock trading.
• Gate emerged as the largest weekly distribution channel for Polymarket Builders, with exchanges progressively becoming critical gateways for prediction market user growth and liquidity expansion.
1. Market Macro Trends
1.1 Middle East Situation Disrupts Global Capital Markets, Institutions Favor Volatility Control
The Middle East situation remained a major source of external disruption in June, but as ceasefire and negotiation expectations grew toward month-end, oil prices retreated notably from highs and the risk premium marginally narrowed. At the macro level, this created a combination of "easing geopolitical disruption, persistent rate constraints, and valuation pressure on growth assets." For the crypto market, this environment does not constitute a trend-level positive catalyst. Institutional capital prefers to control volatility exposure and wait for further clarity on policy and risk appetite, so June remained predominantly range-bound with structural divergence.
1.2 ETF Flows: Sustained Net Outflows in Late June, Institutional Risk Appetite Clearly Cooling
From an ETF flow perspective, the dominant theme of June 2026 was sustained cooling. The 30-day flow window shows that most trading days from June 9 to July 3, 2026 recorded net outflows, with particularly large consecutive outflows between June 24 and June 26, indicating institutional investors significantly reduced crypto asset exposure in the month-end period.
Structurally, Bitcoin spot ETFs remained the primary driver of capital flow changes, with orange bars dominating almost all net outflow magnitude. Ethereum ETFs, while smaller in size, also contributed negatively through most of the period as indicated by the blue segments. This suggests institutions were not merely making minor position adjustments in a single asset but adopting a more conservative allocation stance across the entire mainstream crypto asset complex.
Notably, a clear rebound appeared at the end of the chart on July 3, indicating extreme pessimism eased somewhat in the short term. However, looking solely at the sustained capital exodus in late June, the ETF market reflected an institutional behavioral pattern of "de-risk first, observe later." Overall, the weak June ETF flows were one of the key variables suppressing crypto market risk appetite.

1.3 Global Capital Market Trends
1.3.1 Global Major Indices: Intensified Volatility, Recovery from Month-End to Early July
In global equity markets, June 2026 was not a one-way rally but rather a phase of high-level consolidation combined with regional divergence. The three major U.S. indices showed mixed performance within the month: the Dow Jones Industrial Average rose 2.52%, the S&P 500 fell 1.06%, and the Nasdaq Composite declined 2.81%. This indicates that the market's primary trading narrative shifted from concentrated pursuit of high-valuation growth toward a rebalancing between value and growth.
Overall, global indices experienced a process of "valuation compression first, sentiment repair later" in June. Risk appetite did not completely disappear, but pricing was no longer concentrated on a single growth narrative as in the earlier period. For institutional capital, this environment is more suited to balanced allocation and sector rotation rather than high-conviction bets on highly volatile assets.

1.3.2 Equities: AI Leaders Correct from Highs, Healthcare Defensive Characteristics Highlighted
At the individual stock level, the most distinctive feature of June was the collective pullback of AI leaders, with semiconductors and compute chains that had previously surged significantly cooling down. From the relative return window of June 2 to July 6, 2026, NVIDIA (NVDA) fell 14.30%, Microsoft (MSFT) declined 12.42%, Broadcom (AVGO) dropped 25.12%, and Micron (MU) fell 7.44%, indicating significantly increased profit-taking pressure on high-valuation AI assets.
Meanwhile, Apple (AAPL) declined only 0.17%, Google (GOOG) fell 1.18%, Meta dropped 3.65%, and Amazon (AMZN) declined 5.17%, showing relatively stable performance. This suggests the market was not broadly dumping tech but rather re-distinguishing between "high-expectation, high-beta" names versus large platform companies with "more stable cash flows and more controllable valuations." The AI narrative remains intact, but the valuation premium the market is willing to pay is declining.
The healthcare sector continued to provide defensive outperformance. Eli Lilly (LLY) rose 14.94% during the same period, significantly outperforming most tech leaders, reflecting capital rotation toward assets combining growth potential with defensive attributes. Overall, the style rotation in June's equity markets was pronounced, with institutions moving away from crowded trades toward more balanced valuations and higher earnings certainty.

1.3.3 Gold: Haven Premium Declines, Precious Metals Weaken Overall
Precious metals notably weakened in June. From the commodities relative return window, gold returned -10.24% in the corresponding early July period, silver -13.46%, and platinum -15.87%. Looking solely at June trends, all three exhibited a consistent downward slope, indicating that the precious metals trade previously supported by haven sentiment and easing expectations was cooling.
This reflects not a breakdown in gold's long-term thesis but rather phase-based profit-taking on haven assets by short-term capital. On one hand, global risk assets experienced volatility but did not exhibit sustained systemic panic. On the other hand, market judgments on inflation, growth, and policy paths became more divergent, temporarily depriving gold's one-way rally narrative of momentum in June.
Therefore, June gold looks more like high-level consolidation extending downward rather than a trend collapse. For institutional allocation, gold's long-term hedging value remains intact, but at the short-term trading level, the precious metals sector has shifted from this year's strongest asset class to an observation zone awaiting new catalysts.

1.3.4 Commodities: Crude Oil Plunge Drags the Complex, Copper and Natural Gas Relatively Outperform
Commodity divergence became more extreme in June. The weakest segment was energy, with light crude oil returns falling to -38.99% over the relevant window, and sustained declines through mid-to-late June, indicating that the oil narrative previously driven by supply concerns and geopolitical premiums had clearly receded. Crude's sharp pullback directly suppressed risk appetite and inflation expectations across the entire commodities complex.
However, not all commodities weakened in tandem. Natural gas still posted a positive 12.49% return during the same period, and copper maintained relative strength at 11.58%, indicating that industrial demand expectations have not completely collapsed—the market simply shifted from "broadly betting on resource price increases" to more selective, granular commodity selection. Overall, June 2026 commodity markets shifted from broad-based rally logic to structural pricing, with energy pullbacks and relatively resilient industrial metals becoming the most important trading characteristics.
2. Hot Sector Analysis
2.1 CEX Channel Penetration and On-Chain Gateway Redistribution: Gate Becomes the Largest Weekly Polymarket Distribution Channel
The channel structure of Polymarket Builders is undergoing significant changes. According to official Polymarket Builders data, Gate has become one of the most prominent external gateways by trading volume, ranking first in weekly trading volume, second in monthly volume, and among the top Builders channels in cumulative volume. Prediction market traffic sources are expanding from the early crypto-native communities, trading frontends, and bot tools to a multi-gateway landscape involving exchanges, wallets, aggregators, and on-chain trading tools. Polymarket is no longer just a standalone prediction market frontend; it is being redistributed by different types of crypto infrastructure.
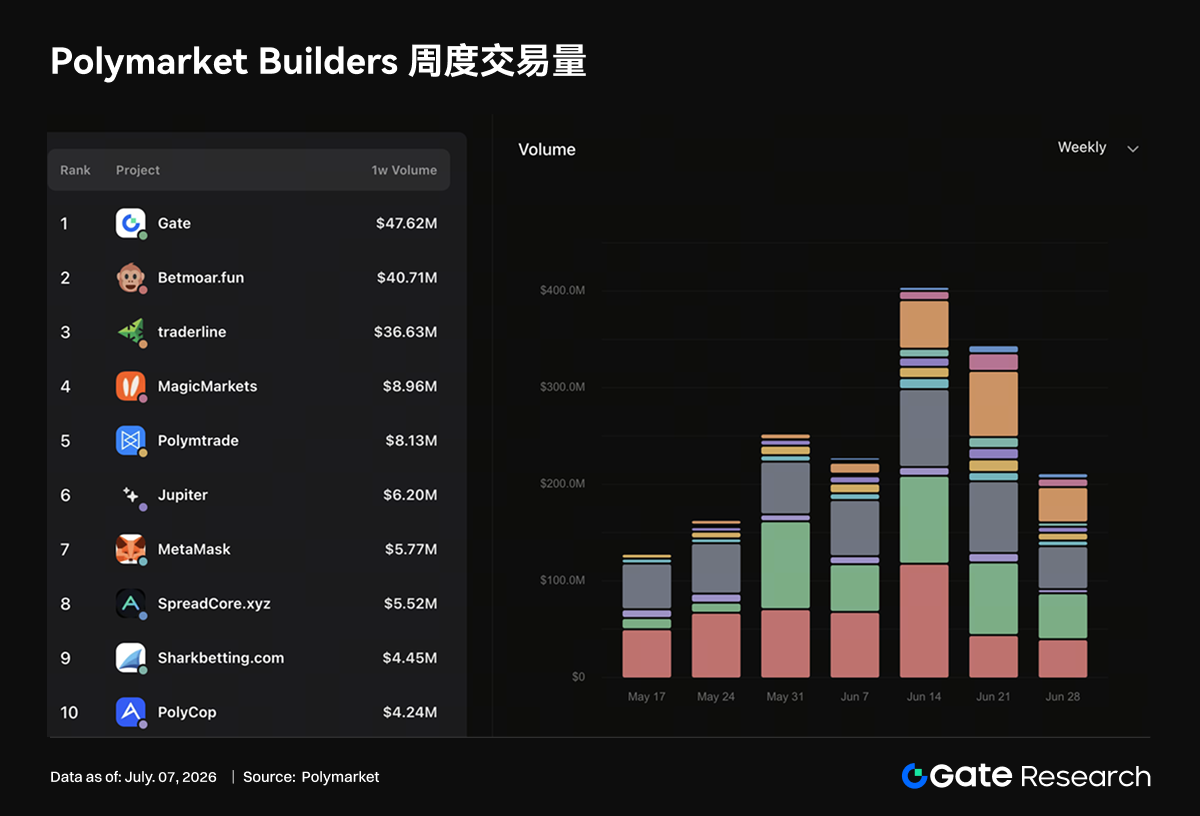
Gate's growth represents CEX penetration of Polymarket entering a more substantive phase. Exchanges have ready-made account systems, asset balances, trading education, market pages, and campaign reach capabilities. Users do not need to re-learn on-chain interactions or go through the full wallet, cross-chain, deposit, and authorization processes before being guided into prediction market trading scenarios. Exchange channels like Gate are well-suited to packaging prediction markets as an "event trading category," displayed alongside existing exchange products such as spot, derivatives, wealth management, Alpha, and new listings.
Another CEX-affiliated wallet provides a different sample. Its trading volume ranking is not as high as Gate's, but it contributes nearly 40% of weekly active address counts, indicating that exchange-affiliated wallet channels are also undertaking large-scale reach and gateway distribution functions. Wallet users naturally possess on-chain operation capabilities, making them suitable for small-ticket, high-frequency, campaign-driven markets, and they are more easily mobilized by airdrops, points, tasks, and tournament incentives. For Polymarket, CEXs like Gate provide retail capital growth, while wallet channels like this other CEX wallet provide on-chain address growth—corresponding respectively to the two growth dimensions of trading volume and user count.
Prominent on-chain tools such as Jupiter, MetaMask, and Axiom are also gradually gaining traction. Jupiter represents aggregator traffic, MetaMask represents the foundational wallet gateway, and Axiom represents users more oriented toward trading frontends and on-chain tooling. These channels primarily cover deep DeFi users who are more familiar with on-chain assets, signing, arbitrage, cross-application flows, and are more likely to engage in strategy-based trading around probability differentials, odds changes, information gaps, and liquidity. Compared to CEX users, this segment may not grow the fastest, but they are particularly important for market depth, price discovery, and long-tail trading scenarios.
Large events such as the World Cup further amplify this channel competition. Sports events are naturally suited to prediction market distribution—clear outcomes, concentrated timelines, broad audiences—attracting crypto users, sports fans, and general traders simultaneously. CEXs rapidly onboard retail through campaign pages, trading tasks, leaderboards, and reward pools; wallets expand address participation through task systems and on-chain identity accumulation; aggregators and trading frontends enhance their tooling around odds, market depth, capital flows, and portfolio trading. Traffic peaks from major events effectively serve as concentrated tests of each gateway's conversion capability.
In summary, the changes in Polymarket Builders demonstrate that prediction markets are entering a phase of channel financialization. The platform itself provides the event market and settlement infrastructure, while external Builders connect different user types. Gate's #1 weekly and #2 monthly rankings prove CEXs can directly influence Polymarket's volume structure; the wallet's address contribution demonstrates that exchange-affiliated wallets have become critical gateways for on-chain user diffusion; and the growth of Jupiter, MetaMask, and Axiom preserves the influence of DeFi-native users on market depth and tool-based trading.
2.2 Physical Trading Card On-Chain Tokenization: A New Template for Consumer-Facing RWA
Physical TCG is emerging as one of the most representative sub-sectors bridging RWA and on-chain consumer applications. According to DeFiLlama data, the Physical TCG protocol generated over $25 million in fees in June. Its fee revenue derives from physical card sales, pack openings, custody, redemptions, secondary market trading, and platform commissions—closely resembling a revenue model combining on-chain consumption, e-commerce, and collectibles trading.

Looking at fee trends, Physical TCG has experienced significant volume expansion over the past year. In July 2025, the category's monthly fees were approximately $3.08 million, rising to approximately $5.79 million in August, reaching approximately $13.06 million in September, then pulling back and stabilizing in the $6-9 million range from October through December. Entering 2026, the growth slope re-accelerated: approximately $8.69 million in January, $8.41 million in February, rising to approximately $15.10 million in March, $17.85 million in April, $22.49 million in May, and further increasing to approximately $25.34 million in June. The consecutive growth since March indicates this track has entered a sustained category expansion phase.
However, the fee structure is highly concentrated. Collector Crypt generated approximately $15.87 million in June fees, accounting for about 63% of Physical TCG's monthly total, making it the absolute core protocol in the sector. Courtyard contributed approximately $4.36 million (about 17%); Beezie approximately $1.99 million (about 8%); and Phygitals approximately $1.52 million (about 6%). The top four protocols collectively contribute over 90% of fees, with meaningful revenue generation still concentrated among a few leading platforms. This dynamic closely resembles the early NFT market—users and liquidity rapidly concentrate around platforms with the strongest inventory, clearest gameplay, best settlement experience, and highest market awareness.
Collector Crypt's growth is particularly critical. Its May fees were approximately $9.29 million, rising to approximately $15.87 million in June—a single-month increase of approximately $6.58 million—making it the primary source of Physical TCG's new all-time high in June. Its fees and revenue primarily come from gacha pack sales of physical cards like Pokemon, fiat/credit card payment rails, on-chain purchases, and secondary market fees, net of some pack buyback expenditures. Collector Crypt is essentially a combination of physical card pack opening + custody + on-chain trading marketplace, rather than a pure NFT trading platform. Users are not buying an abstract image but rather entitlement to a physical asset with offline collectible value that can be custodied, redeemed, and traded.
Courtyard represents a different path. Its positioning is more oriented toward tokenization and marketplace trading of physical collectibles, with June fees of approximately $4.36 million—lower than May's approximately $6.73 million but still ranking as the second-largest protocol. Courtyard's presence on the Polygon ecosystem also illustrates that Physical TCG's core competition depends on inventory, custody, authentication, trading experience, and user trust. The difficulty of putting physical cards on-chain is not minting NFTs but rather ensuring the cards genuinely exist, can be verified, redemption processes are executable, and the secondary market has sufficient bid-ask depth. These factors determine whether a protocol can evolve from one-time pack-opening campaigns into a continuously traded collectibles financial market.
Protocols such as Beezie, Phygitals, Pull.fun, Monster, and DYLI form the second tier. Beezie runs on Base with 30-day fees of approximately $1.98 million, primarily from claw pull, BidRouter swap fees, and marketplace sale commissions. Phygitals operates on Solana with 30-day fees of approximately $1.51 million, generating revenue from vaulted collectible cards, gacha, royalties, lucky draws, and marketplace activity. Pull.fun's model combines on-chain pack opening, marketplace trading, and physical redemption, with 30-day fees of approximately $0.52 million. Projects like Monster, DYLI, and YourGrails are exploring similar mechanics within ecosystems such as MegaETH, Abstract, and Avalanche respectively. Multiple public chains are attempting to convert physical collectibles into tradable on-chain consumer assets.
By chain distribution, Solana currently holds a clear advantage. Based on rough 30-day fee breakdown, Solana contributes approximately $17.39 million (nearly 69%), driven primarily by Collector Crypt and Phygitals; Polygon contributes approximately $4.36 million (about 17%), almost entirely from Courtyard; Base contributes approximately $2.02 million (about 8%), mainly from Beezie; while Off-chain, MegaETH, Abstract, and Avalanche gateways remain in earlier stages. Which chain can attract Physical TCG projects depends not only on gas fees and TPS but also on wallet experience, fiat on-ramps, social distribution, and NFT/collectibles user bases.
Physical TCG's growth logic differs from traditional NFTs. The core assets of NFTs are primarily on-chain native scarcity and community consensus, whereas Physical TCG's core assets derive from the existing price system of offline physical collectibles. Pokemon, sports cards, One Piece, and trading card games already have mature collectible demand. On-chain protocols provide faster transaction settlement, more transparent ownership records, more flexible fractionalization, and stronger gameplay design. Pack opening/gacha drives consumer impulse, custody and redemption provide physical anchoring, and secondary markets create financialized trading space. When these three elements combine, Physical TCG is closer to a tradable collectibles e-commerce experience than ordinary NFTs





