
### Key Battle Week: BTC Retracement Confirmation and HYPE Support Zone Struggle | Special Analysis
- Core View: This week, the crypto market enters a crucial long-short battle period. Bitcoin is undergoing a retracement confirmation around its short-term channel lower trendline ($64,500). Meanwhile, HYPE faces a directional decision in the $64-$66 range. The strategy maintains a bearish primary stance on Bitcoin while seeking short-term long opportunities within the HYPE support zone.
- Key Elements:
- Bitcoin's 4-hour chart shows the current rally is a retracement after breaking below the channel. If it cannot hold the $64,500-$65,000 lower trendline, it will likely retest the $59,000 support again.
- Bitcoin's medium-term bearish structure is confirmed, with position monitoring models indicating an effective breakdown of the long-short channel. From a medium-term perspective, approximately 20% short positions were established around the $64,500 level last week.
- Bitcoin's core resistance this week lies at $64,500-$65,000 (channel lower trendline) and $69,500-$70,500; the key support zone is the $59,000-$60,000 area.
- HYPE initiated a strong rally from its June 10 low of $52.62, reaching a new high of $76.94. Although it has subsequently corrected, its bullish momentum remains strong.
- HYPE is currently pulling back to the critical support zone of $64-$66. If support holds, the uptrend will likely resume to challenge new highs; if lost, the correction will extend, with support moving down to the $52-$54 area.
- The short-term strategy for HYPE is to buy on dips in the $64-$66 or $52-$54 zones, combining with model bottom signals for light long entries, keeping position size below 30%.
The market has entered a critical phase of competition this week.
On a macro level, marginal changes in Federal Reserve policy expectations continue to dominate the pricing rhythm of risk assets. In the crypto market, after a period of early consolidation, the divergence between bulls and bears is becoming concentrated at key price levels.
This week's review follows our established framework: based on multi-cycle structural analysis and combined with quantitative model signals, we analyze the market trends for BTC and HYPE this week, and formulate specific short-to-medium-term operational plans.
It is important to note that all content herein is a personal technical analysis record, serving only as a reference framework and review basis for my own trading decisions, and does not constitute any form of investment advice. The market is always more complex than predictions; strictly adhering to risk control and stop-loss discipline remains the top priority.
Summary of Core Views for This Week's Trading:
- Analysis of BTC's hourly-level price structure (detailed in Part One)
- BTC's market forecast for this week and medium/short-term trading strategies (detailed in Part Two)
- Analysis of HYPE's hourly-level price structure (detailed in Part Three)
- HYPE's market forecast for this week and short-term trading strategies (detailed in Part Four)
Review of Last Week's Strategy and Core Market Views:
- Verification of BTC market forecast: Last week, we strictly adhered to trading discipline. When the market presented an entry opportunity, we decisively established a short position of approximately 20%. The medium-term trading plan outlined in last week's review was executed.
1. In-Depth Analysis of Bitcoin's Hourly-Level Structure
Bitcoin _ 4-hour K-line chart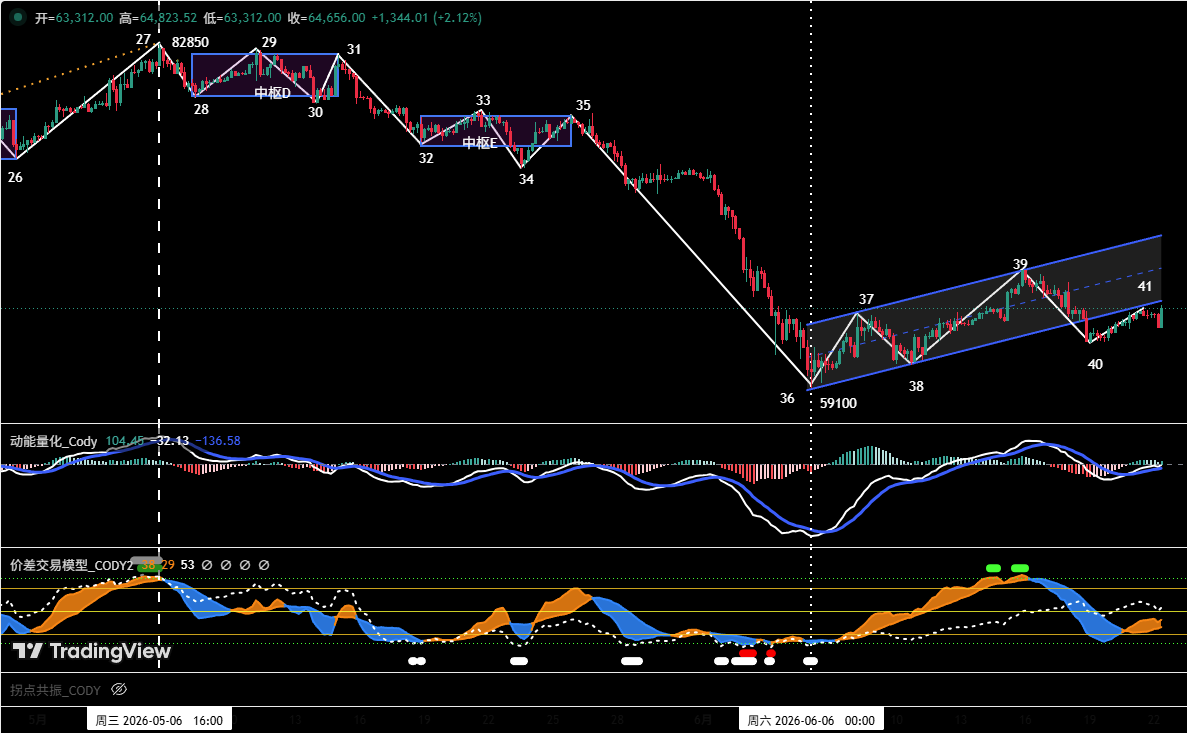
Figure 1
① As shown in (Figure 1): From the 4-hour structure perspective, since the price rebounded from the low of $59,100 on June 5, it can be subdivided into a five-segment structure, corresponding to 36-37, 37-38, 38-39, 39-40, and 40-41.
② The overall trend shows a short-term ascending channel pattern (blue channel in the chart): its upper boundary is formed by connecting the rebound highs (Point 37) and (Point 39), and the lower boundary is established by connecting the correction lows (Point 36) and (Point 38). The chart shows that the price has broken below the lower boundary of the channel at (Point 40). The current rebound segment (40-41) can be seen as a retest confirmation phase of the breakdown. If (Point 41) fails to climb back above the lower boundary of the channel, the probability of the price retesting the previous support level of $59,100 will increase significantly.
2. Bitcoin Market Forecast and Trading Strategy for This Week
1. BTC market forecast for this week:
Core view for this week: Focus on the result of the price's retest of the short-term channel's lower boundary.
- If it holds effectively, the price will likely continue its rebound within the short-term ascending channel, potentially challenging the core resistance zone of $69,500 ~ $70,500.
- If the breakdown is confirmed, the market may retest the core support zone of $59,000 ~ $60,000.
2. Core resistance levels:
- First resistance zone: $64,500 ~ $65,000 area (near the short-term ascending channel's lower boundary)
- Second resistance zone: $69,500 ~ $70,500 area (previous dense trading zone)
3. Core support levels:
- First support level: $59,000 ~ $60,000 area (previous key support)
- Second support level: Around $55,000 (previous key support)
4. Trading strategy for this week (excluding the impact of unexpected news)
① Medium-term strategy:
Bitcoin _ Daily K-line chart (position monitoring model)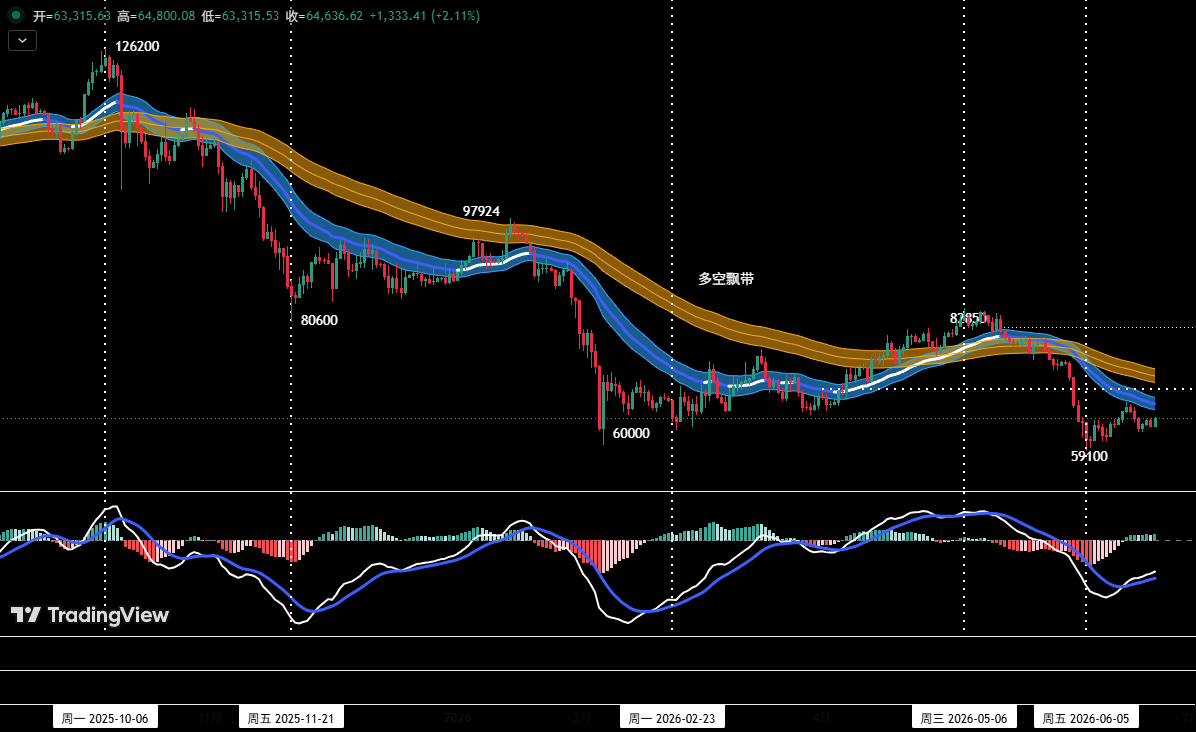
Figure 2
Position Monitoring Model: As shown in (Figure 2), the price has effectively broken below the "Bull-Bear Channel," confirming that the market structure has shifted to a bearish dominance. Last week, following our established plan, we initiated a short position near the $64,500 level, with the initial medium-term position controlled at about 20% of total capital. We will adhere to stop-loss discipline and wait for the next opportunity to add to the position.
② Short-term strategy: Utilize 30% of the position, set a stop-loss, and seek "spread" trading opportunities based on support and resistance levels (using the 30-minute/60-minute chart as the operating cycle).
③ For short-term operations, to dynamically respond to complex market developments, we have prepared three specific action plans (A/B/C) in advance.
Plan A: Tentative positioning at resistance zone
- Entry: If the price rebounds to the $64,500 ~ $65,000 area and shows signs of stalling, combined with a top signal from the quantitative model, an initial short position of around 15% can be established.
- Risk Control: Set an initial stop-loss order.
- Exit: When the price adjusts to a key support level and aligns with model signals, gradually close the position to lock in profits.
Plan B: Adding to position at strong resistance zone
- Add to Position: If the price breaks through the $65,000 resistance and continues to rally to the $69,500 ~ $70,500 area, showing signs of resistance combined with a top signal from the quantitative model, the short position can be increased to within 30%.
- Risk Control: Set an initial stop-loss order.
- Exit: When the price adjusts to a key support level and aligns with model signals, gradually close the position to lock in profits.
Plan C: Effective breakdown of support, follow-through shorting
- Add to Position: If the price effectively breaks below the $65,000 support, continues to decline, and loses the $59,000 ~ $60,000 support zone, consider adding to the short position to within 30% when the retest shows signs of weakness.
- Risk Control: Set an initial stop-loss order.
- Exit: When the price declines to a key support level and aligns with model signals, gradually close the position to lock in profits.
3. Analysis of HYPE's Hourly-Level Structure
HYPE_4-hour K-line chart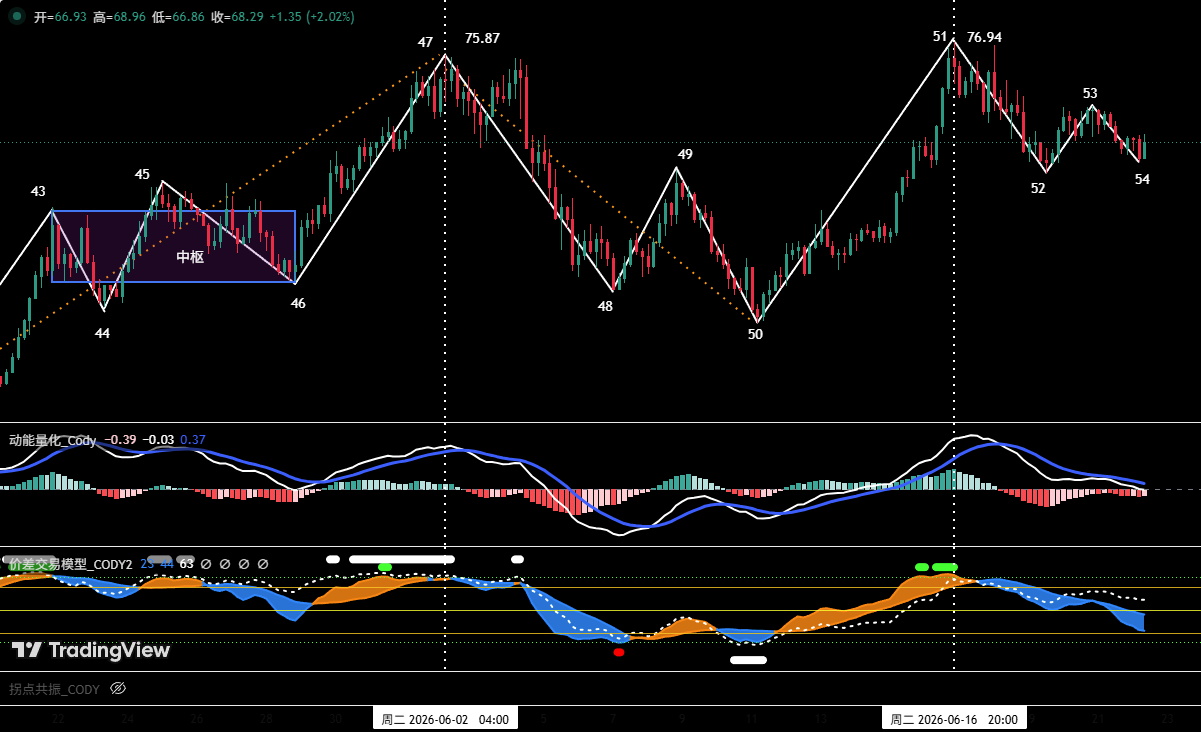
Figure 3
① As shown in (Figure 3), on the 4-hour timeframe, HYPE began a correction from its high of $75.87 on June 2 (Point 47) and found support near $52.62 (Point 50) on June 10, a correction lasting about 9 trading days. Subsequently, a strong upward impulsive segment (50-51) emerged, breaking through the previous high in 6 trading days and reaching a new high of $76.94 since the rally started in January, indicating strong bullish momentum.
② The pullback from the new high displays a clear three-wave corrective structure (51-52, 52-53, 53-54). The price is currently retesting the key support zone of $64 ~ $66.
- Bullish scenario: If the price finds effective support in this zone, the upward trend originating from (Point 50) is likely to continue, and the price will challenge new highs subsequently.
- Bearish scenario: If this level is lost, the correction time will extend, and the price may retest the core support band of $52 ~ $54, which was the starting point of the previous upward trend.
4. HYPE Market Forecast and Short-Term Strategy for This Week
1. HYPE market forecast for this week:
① Core resistance levels:
- First resistance level: Around $77
- Second resistance zone: $80 ~ $82 area
② Core support levels:
- First support zone: $64 ~ $66 area
- Second support zone: $52 ~ $54 area
Core view for HYPE this week:
- Observe the outcome of the battle between bulls and bears over the $64 ~ $66 zone.
2. HYPE short-term trading strategy for this week (going long at support)
Short-term HYPE trading this week should follow the strategy of "buying on dips, avoiding chasing rallies."
Short-term Strategy: Trying longs at support zone stabilization
When HYPE's price retests the key support zone of $64 ~ $66 or the deeper $52 ~ $54 area, and shows signs of stabilizing and bottoming out, combined with bottom signals triggered by the two models, consider lightly trying a long position. Position size must be controlled below 30%, and stop-loss discipline must be strictly observed.
5. Important Notes:
- At entry: Immediately set an initial stop-loss.
- When profit reaches 1%: Move the stop-loss to the entry cost price (break-even point) to ensure capital safety.
- When profit reaches 2%: Move the stop-loss to the 1% profit level.
- Continuous tracking: Thereafter, for every additional 1% profit, the stop-loss level is also moved up by 1% to dynamically protect and lock in profits.
Financial markets change rapidly. All market analysis and trading strategies require dynamic adjustment. All views, analytical models, and operational strategies mentioned herein are based on personal technical analysis, serve only as a personal trading journal, and do not constitute any investment advice or trading basis. Market risk exists; invest wisely. Please do not make decisions solely based on this content.


