
Bitcoin's rebound faces resistance: $78,200 turns into resistance, $71,400 becomes key support
- Core View: Bitcoin's structure remains resilient, having reclaimed key cost average lines. However, weakening spot demand, slowing ETF capital inflows, and crowded long positions indicate that upward momentum is cooling, potentially leading to a short-term consolidation phase.
- Key Factors:
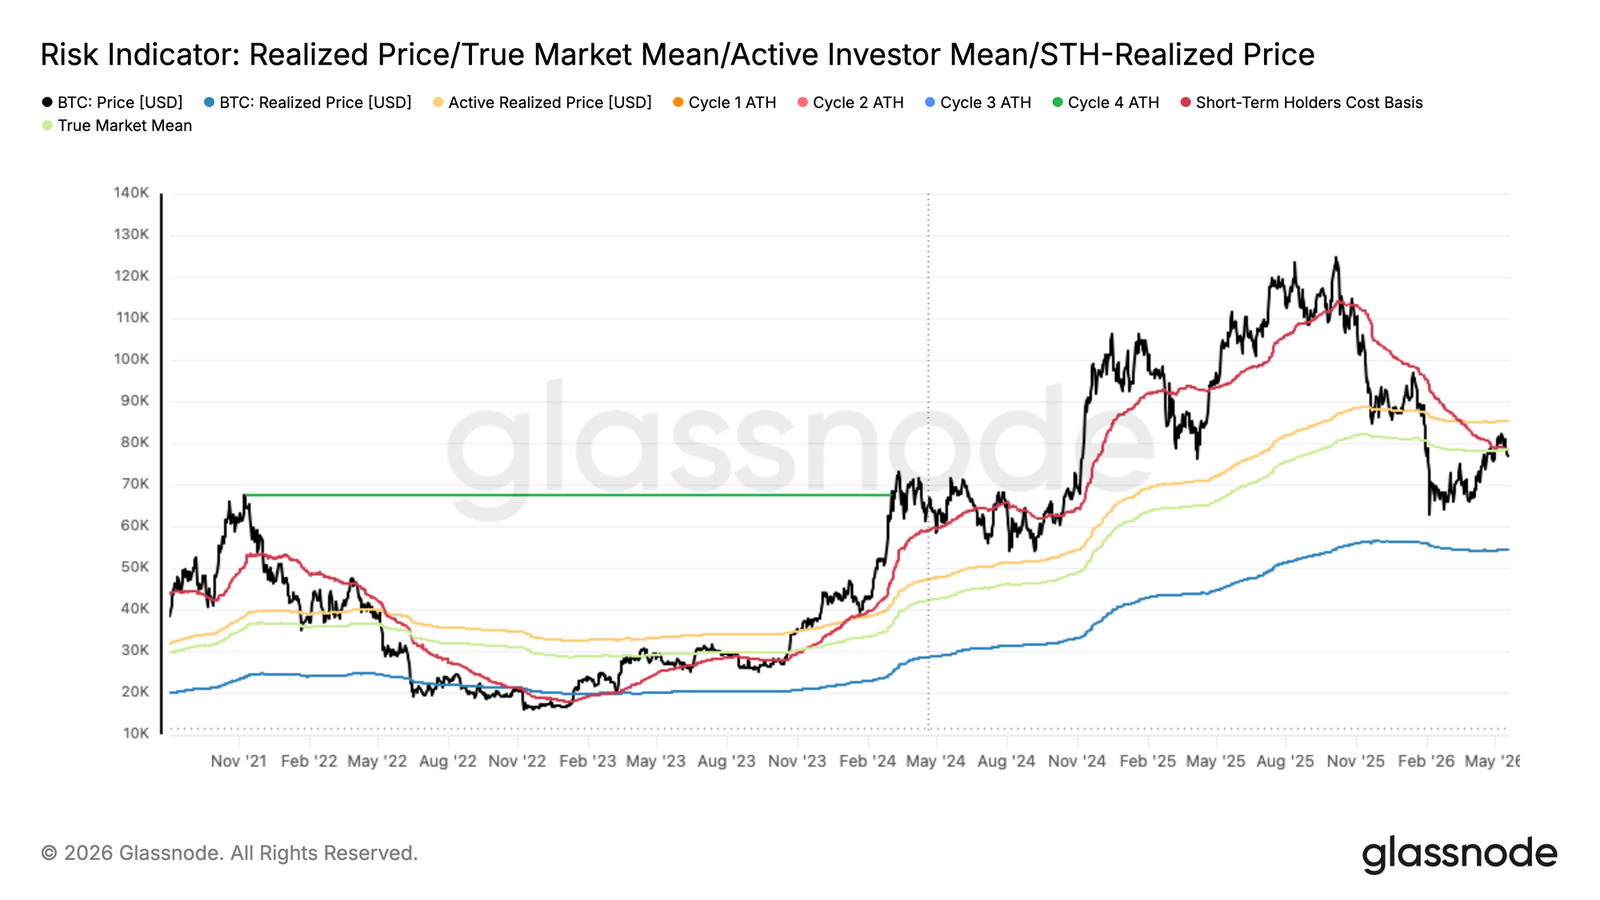
- Bitcoin has reclaimed the Real Market Price ($78,300), but historical cycles suggest it requires weeks to months of consolidation to confirm a bullish transition.
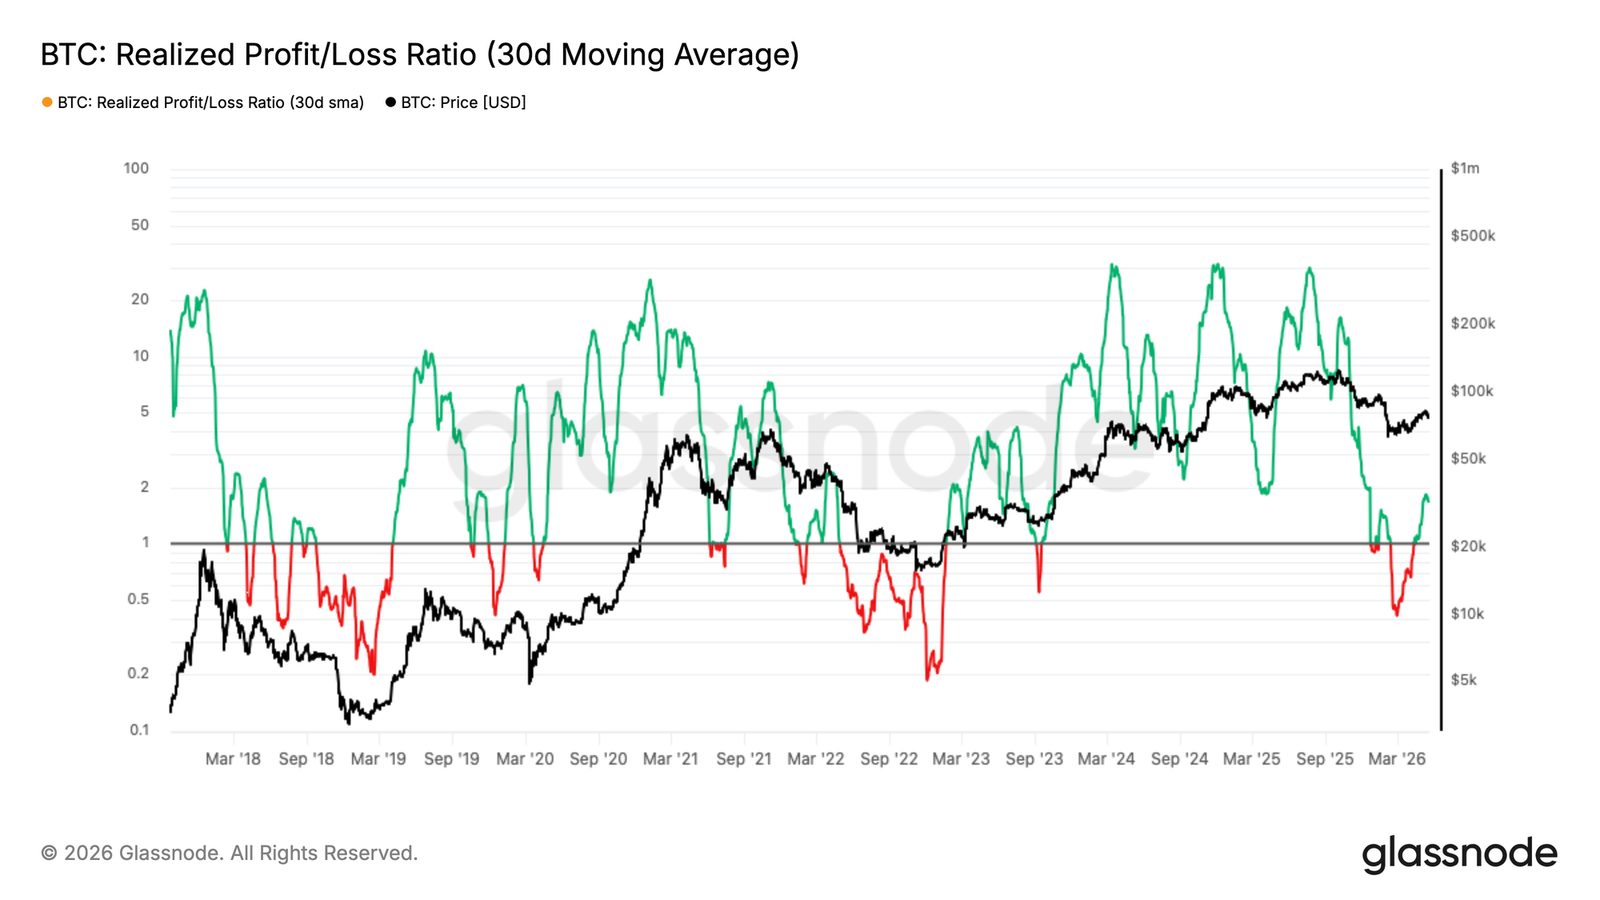
- The 30-day SMA of the Realized Profit/Loss Ratio has surged from 0.4 to 1.8, indicating profit-taking is outpacing demand absorption. It needs to consistently stay above 2 to confirm buyer recovery.
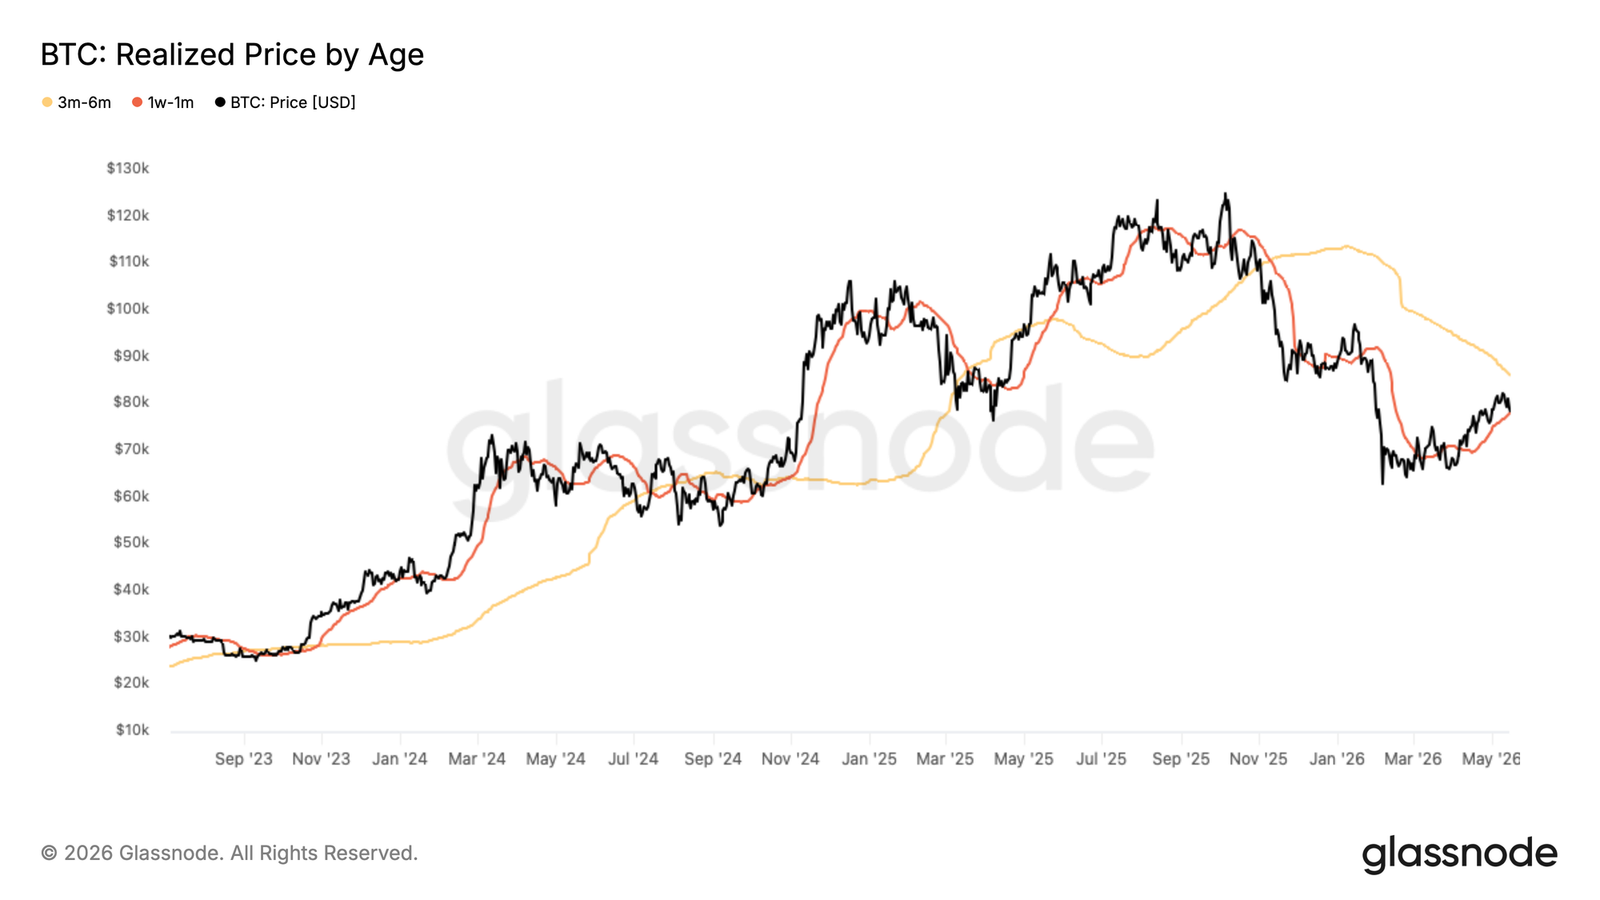
- The recent cost basis of $78,200 has shifted from support to resistance. The cost basis of the accumulation cohort from February to April, $71,400, has become the most immediate support level.
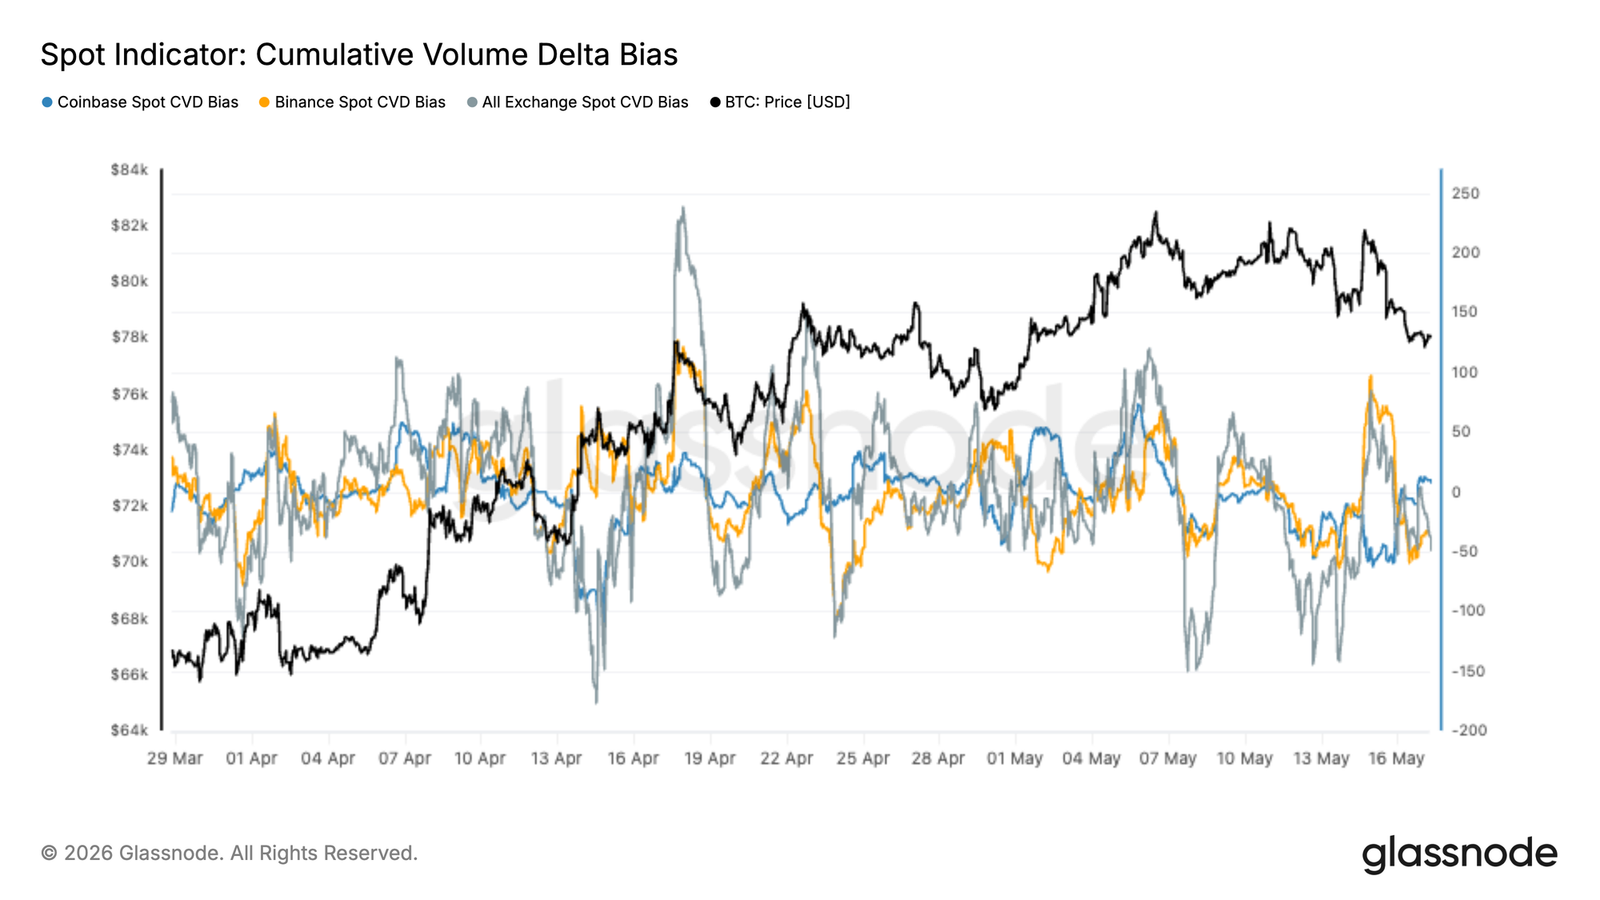
- The spot market is weakening, with Total Spot CVD trending negative. Coinbase activity lags behind Binance, indicating weak institutional spot participation.
- The macro environment is tightening. A strengthening US dollar, rising yields, and energy inflation pressures are limiting risk appetite, although Bitcoin has shown relative resilience.
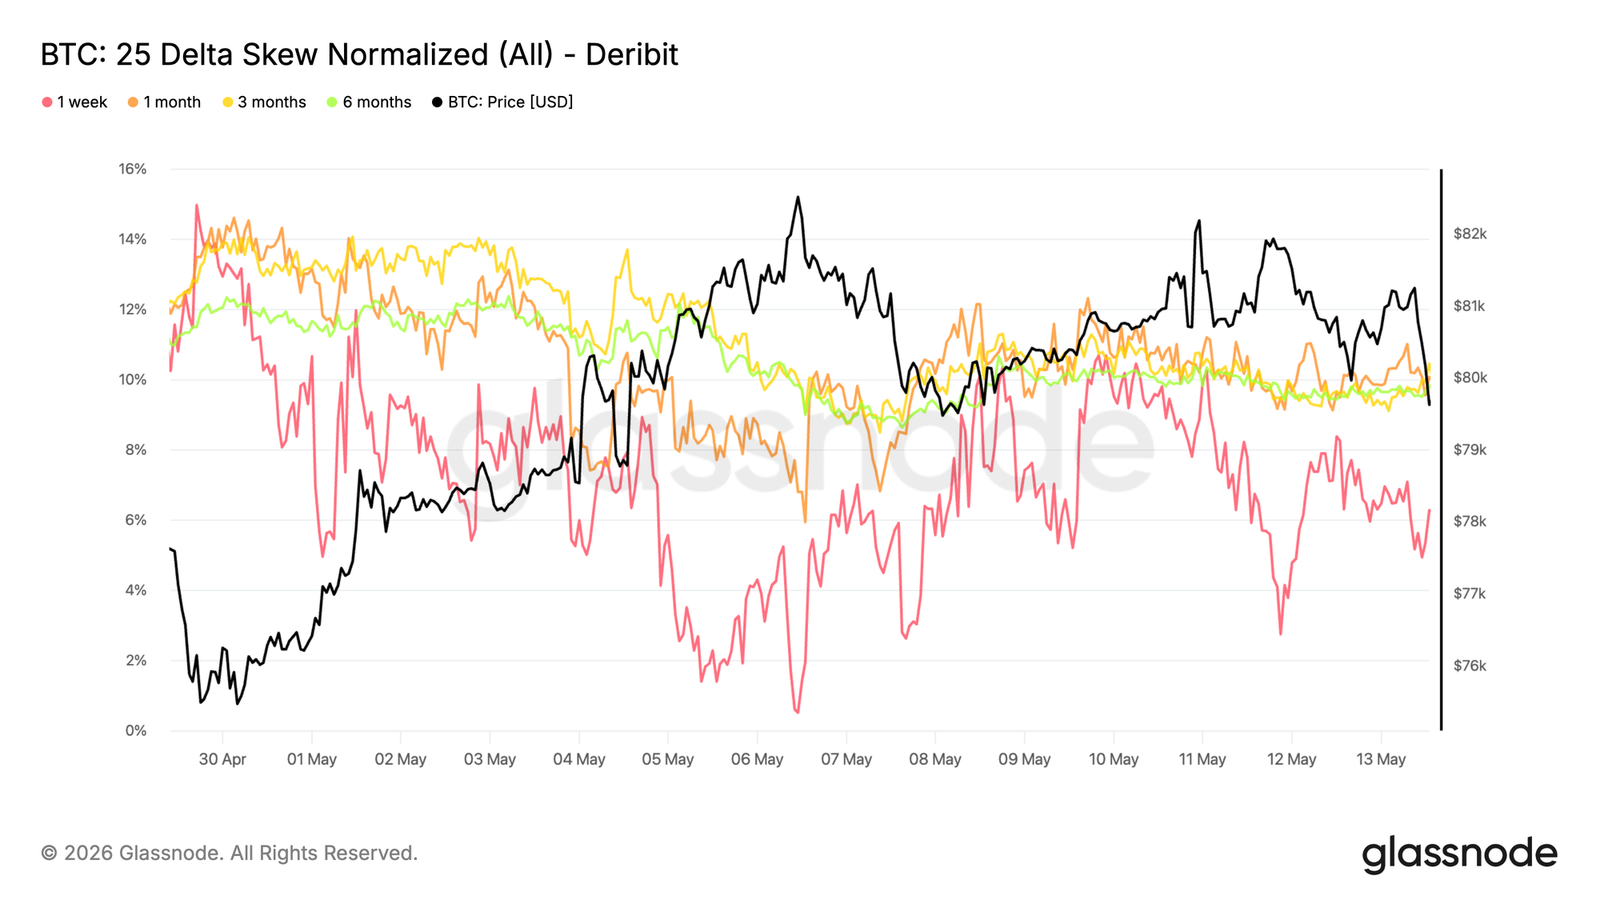
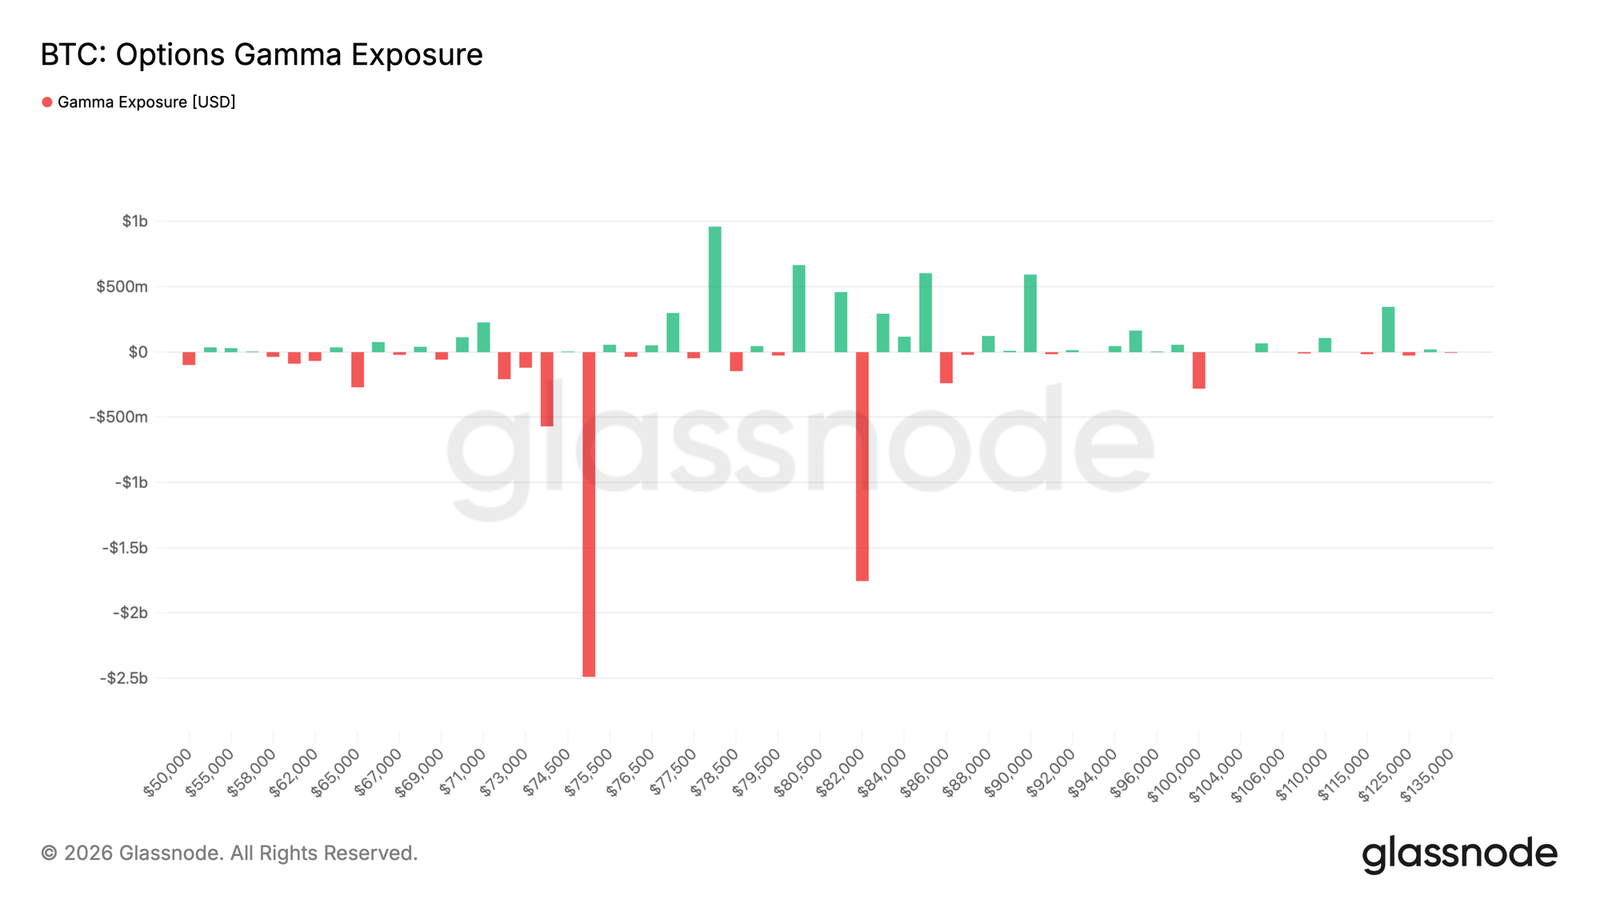
- The options market shows a defensive tilt, with skew indicating renewed demand for downside protection. The short gamma zone near $75,000 is prone to amplifying price volatility.
Original Author: Glassnode
Original Translation: AididiaoJP, Foresight News
Bitcoin remains structurally resilient, but fading spot demand, slowing ETF inflows, and increasingly crowded long positions suggest that upward momentum is cooling beneath the surface.
Summary
- Bitcoin has reclaimed the True Market Mean of $78,300, but failed to hold above it. Based on historical cycles, weeks to months of consolidation around this level are typically required to confirm a credible bullish transition.
- The 30-day SuRF Ratio SMA surged from 0.4 in February to 1.8 during the rebound, indicating demand was insufficient to absorb the wave of profit-taking. A sustained reading above 2 is needed to signal a genuine recovery in buying pressure.
- The 30-day Cost Basis of $78,200 has flipped from support to overhead resistance, while the cost basis of the accumulation cohort from February to April at $71,400 now serves as the most immediate support level for this correction.
- On-chain spot market internals have weakened in recent weeks. The aggregate spot CVD remains predominantly negative, and Coinbase activity continues to lag. This suggests that while occasional speculative demand arises overseas, US institutional spot participation remains lackluster.
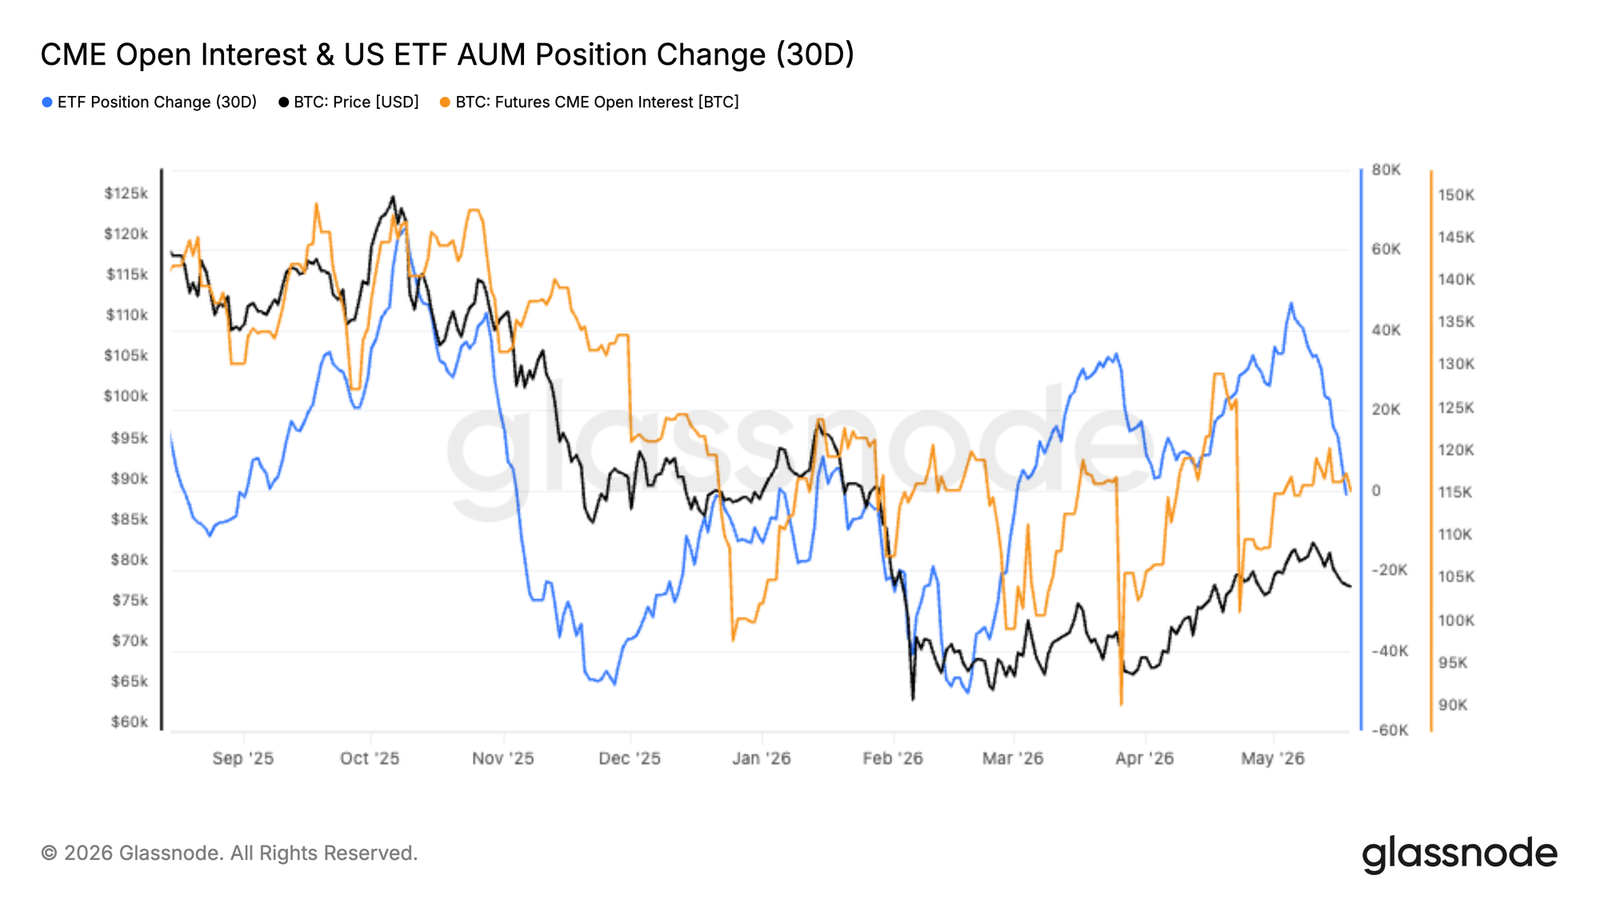
- CME futures open interest continues to recover alongside the price, indicating improving institutional participation in the derivatives market, although spot demand remains indecisive near the upper end of the current range.
- The momentum of US spot ETF accumulation has recently started to slow. The 30-day change in ETF holdings has flattened noticeably after strong buying in April and early May, suggesting that US institutional spot demand has become less aggressive near the upper end of the current price range.
- Implied volatility is rebuilding from low levels, concentrated primarily at the front end, while longer-dated expectations remain stable. Realized volatility continues to decline, widening the volatility risk premium and making protection relatively cheap.
- Options positioning remains defensive. Skew indicates a resurgence in demand for downside protection, while the short gamma zone near $75,000 leaves spot vulnerable to amplified hedging flows and sharper price movements.
Macro Overview
The macro backdrop has tightened noticeably, with markets facing a stronger US dollar, higher yields, and renewed inflationary pressures from the energy market. The DXY has risen to a six-week high, the US 10-year yield has climbed above 4.6%, and the 30-year yield is heading towards multi-year highs, reflecting a sharp repricing of interest rate expectations. Markets are now assigning a higher probability to a Fed rate hike before year-end, reversing previous expectations for easing.
Commodities are reinforcing the tighter macro shock. Oil remains elevated due to Middle Eastern supply risks, keeping inflation expectations active and limiting room for rate cuts. Gold is struggling to rally further amid rising real yields and a stronger dollar, suggesting that safe-haven flows are being challenged by tighter financial conditions.
For digital assets, the landscape remains constructive but more fragile. Bitcoin's resilience in the face of higher yields and a stronger dollar suggests underlying demand persists, but the macro tailwind is no longer unequivocally positive. Sustained upside may require oil stabilization, a pullback in yields, and the DXY losing momentum to allow liquidity conditions to ease and risk appetite to expand once again.
On-Chain Insights
Testing the Bull-Bear Line
The recent rally to $82,000 marked a notable recovery of the True Market Mean at $78,300. This pricing model tracks the average cost basis of the actively traded Bitcoin supply and historically serves as the dividing line between bear and bull markets. Reclaiming this level is necessary but not sufficient for a structural shift. Conventionally, the pre-bull phase requires sustained consolidation around this model for weeks to months to confirm a credible trend change. While a single decisive break above the True Market Mean is constructive, it does not yet meet this requirement.
Therefore, any deeper pullback from current levels would redefine the recent rally as a local high within a continuing bear market. This structure has appeared multiple times in previous cycles and remains a higher probability outcome until price demonstrates sustained follow-through.
Profit-Taking Outpacing Demand
Looking closer at the internal mechanics of the recent rally, the SuRF Ratio provides a precise measure of market health. This metric measures the ratio of realized profit in USD to realized losses on-chain, with values above 1 indicating profit-taking dominance and below 1 reflecting loss realization dominance.
The 30-day SMA of this metric surged from a February low of 0.4 to 1.8, reflecting a logical shift in spending behavior following the price recovery. However, the market's inability to sustain momentum amid this rising wave of profit-taking suggests that demand has not yet recovered sufficiently to absorb sellers capitalizing on the rebound.
A decisive and multi-week stabilization of the 30-day (or 90-day) SMA of the SuRF Ratio above 2 would constitute a more meaningful signal of genuine recovery in buyer conviction and the market's capacity to absorb distribution pressure without rolling over.
Cost Basis Levels Define a New Range
As the price has fallen back below the True Market Mean, the realized price metric broken down by holding period provides a granular framework for mapping the most immediate support and resistance levels. This model tracks the average purchase price of coins by holding period, directly mapping behavioral anchors of different investor cohorts onto the price chart. The cost basis for the most recent 30-day accumulation wave (which fueled the rally) is approximately $78,200. With the price now below this level, this cohort has moved into unrealized loss, transforming the former support floor into an overhead supply zone that adds selling pressure during any attempt to rally.
Beneath the spot price, the cost basis of investors who accumulated during the February-April consolidation (now classified as 1-3 month holders) is near $71,400. As this cohort's profit margin narrows and faces increasing incentive to protect gains before conditions deteriorate further, this represents the most likely near-term support level.
Off-Chain Insights
Return of Spot Selling Pressure
Latest spot flow data continues to show weak aggregate demand beneath the surface. The aggregate spot CVD across exchanges remained biased towards the negative side during the recent pullback to the $77,000 range, indicating that selling pressure continues to outweigh aggressive spot buying on major trading venues.
Recently, Binance spot flows have seen a modest recovery from deeply negative levels, while Coinbase activity remains relatively subdued. This divergence suggests stronger speculative participation overseas, while US institutional spot demand lacks conviction near current price levels.
Despite Bitcoin's relative structural resilience, the latest spot positioning data indicates that broad-based spot accumulation has not yet fully re-emerged.
CME Recovers as ETF Demand Slows
CME futures open interest has continued to rise steadily alongside Bitcoin's recovery to the low $80,000s, indicating that institutional traders are rebuilding exposure after the February sell-off. The recovery in CME activity suggests that institutional participation in the derivatives market is growing even under restrictive macro conditions.
Meanwhile, the momentum of US spot ETF accumulation has begun to slow. The 30-day change in ETF holdings has flattened noticeably after strong buying in April and early May, suggesting that the US institutional cohort has become less aggressive in their spot demand near current price levels.
The result is a market increasingly driven by futures positioning rather than robust spot accumulation. Recent upside continues to attract leveraged participation, but the pace of fresh spot buying has slowed as Bitcoin approaches the upper end of the current range.
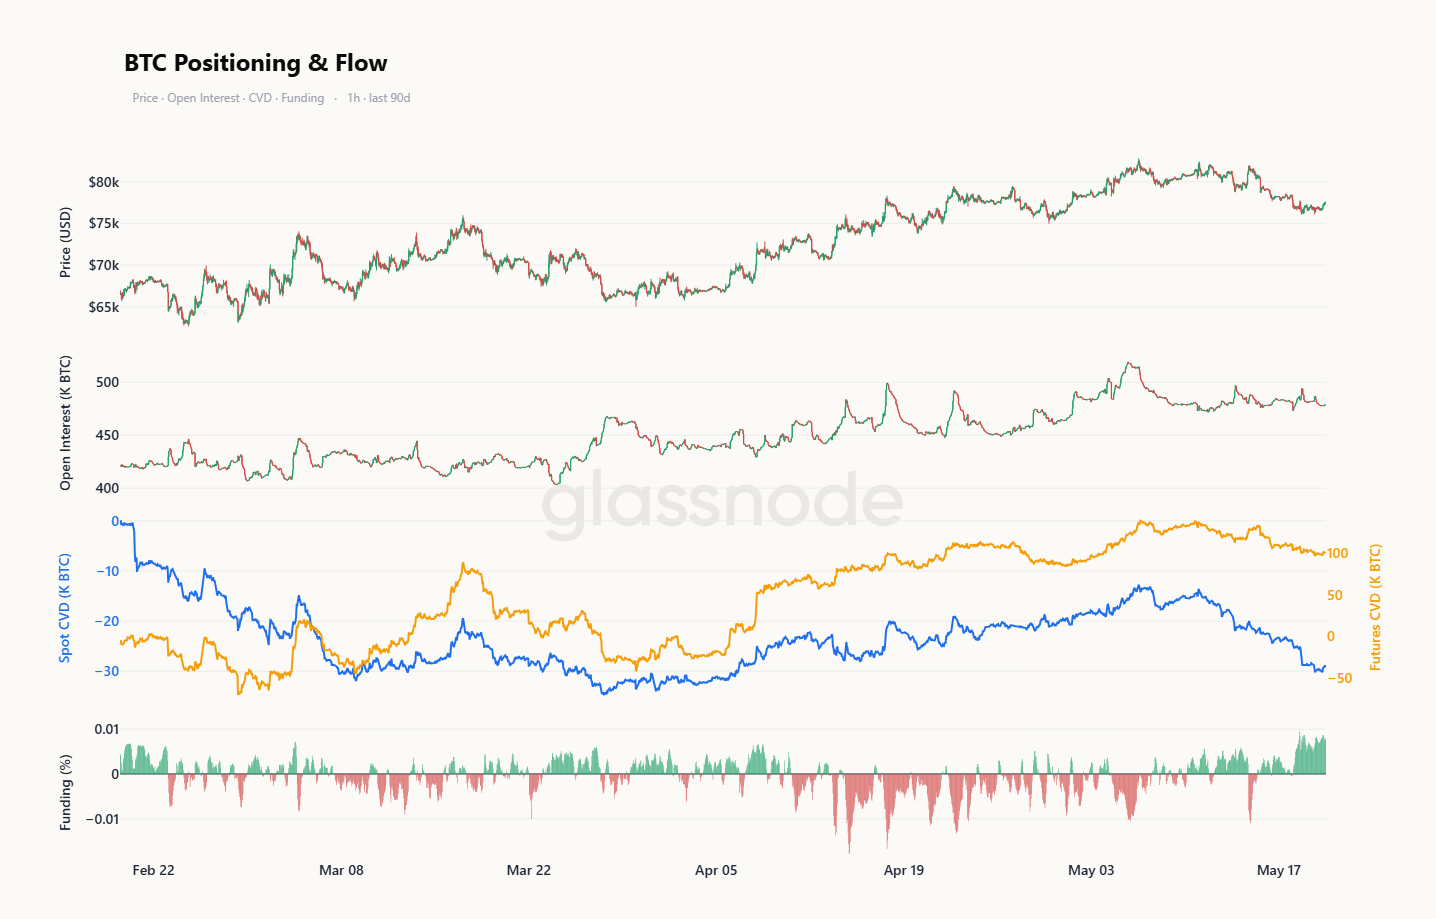
Weak Spot, Crowded Longs
Latest order flow data shows that the recent downturn is predominantly spot-driven beneath the surface. Futures open interest has only modestly declined and remains elevated relative to the last time Bitcoin traded in this range, while the spot CVD is significantly weaker than the futures CVD. This suggests that the recent downside has been driven more by persistent spot selling than by aggressive short positioning.
The funding rate reinforces this picture. Rather than resetting as the price pulled back, the funding rate has remained positive and has recently started to strengthen again, indicating that leveraged longs continue to pay a premium to maintain their exposure during the weakness.
Taken together, the market is sustaining elevated long positions even as spot demand weakens, a configuration typically resolved through either spot buying or a more extensive derivatives reset.
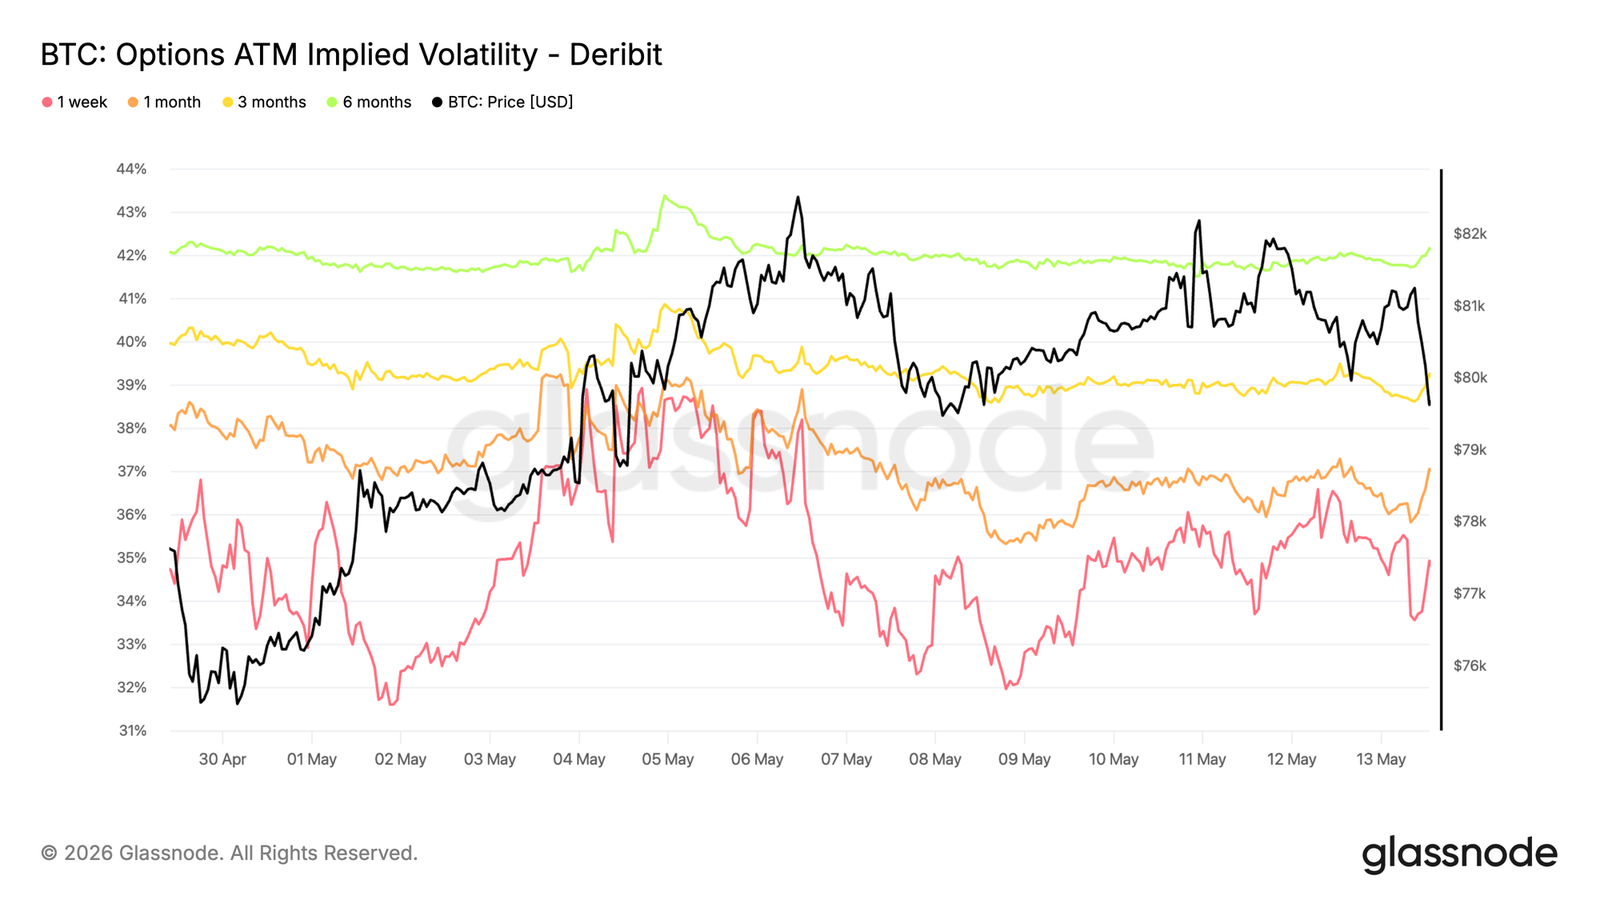
Implied Volatility Rebuilding from Lows
Starting with implied volatility, the market is beginning to price in volatility again, albeit from a low base.
Bitcoin's implied volatility across tenors has risen compared to last week, with the front end moving from 32% to 36%. The 6-month tenor remains relatively stable near 42%, suggesting that despite recent spot price action, longer-dated expectations have changed little.
The chart shows the front end reacting more visibly as spot moves within the range, while the back end remains anchored. This indicates that traders are paying slightly higher premiums for short-term options but are not yet pricing in a broader shift in volatility.
With implied volatility still near recent lows, hedging costs remain relatively cheap, especially for short-term event risk.
The current structure reflects a moderate rebuilding in short-term volatility demand, while longer-dated expectations remain stable and largely unchanged.
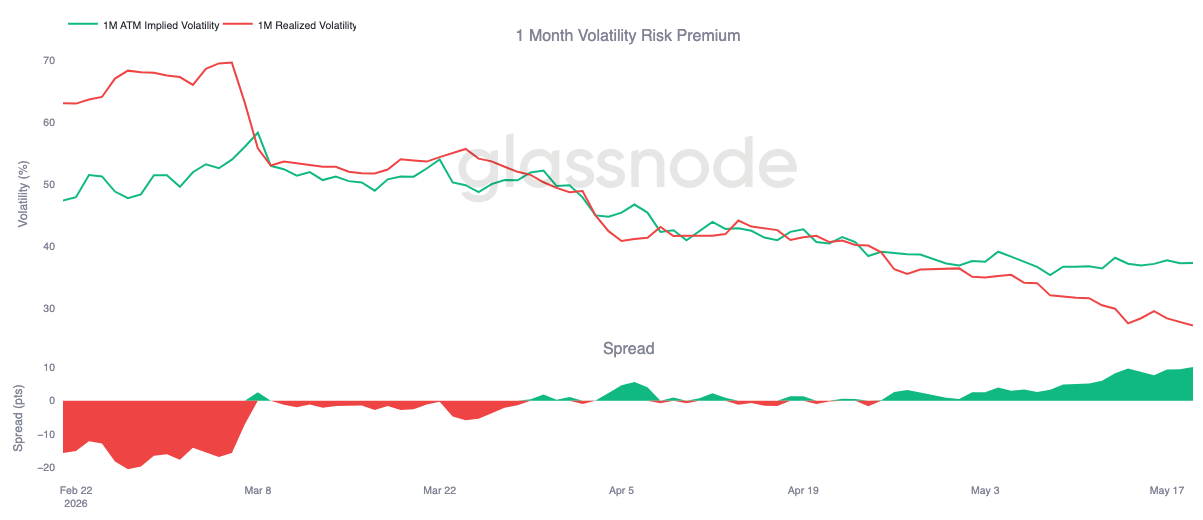
Realized Volatility Falls, Volatility Risk Premium Widens
As implied volatility rebuilds modestly, realized volatility continues its downward trend.
Bitcoin's 30-day realized volatility currently stands at 27%, continuing its overall decline in recent weeks. Meanwhile, 1-month implied volatility remains near 37%, meaning implied volatility is significantly above realized volatility.
This pushes the 1-month volatility risk premium back towards approximately 10 volatility points, the highest level in recent weeks. The right side of the chart shows a steady widening, driven more by the continued compression of realized volatility as spot action stabilizes, rather than aggressive implied buying volume.
For hedgers, the key takeaway is that despite the recent rebuilding of implied volatility, hedging costs remain relatively cheap.
The current structure reflects a market where realized volatility is declining faster than implied volatility is repricing lower, allowing the volatility risk premium to continue expanding.
25 Delta Skew Shows Re-emergence of Downside Demand
While implied volatility has begun to rebuild modestly, skew indicates that traders are still primarily bidding for protection rather than upside exposure.
Bitcoin's 25-delta skew has become more bearish over the past week, with traders paying higher premiums for downside protection across all tenors. This shift is most pronounced at the front end, where skew has risen from 2.7% to 6.2%, indicating a significant increase in short-term put option demand.
Longer tenors also show higher put premiums, though to a lesser extent, with the 6-month tenor remaining near the 10% range. This suggests the market is not only hedging short-term risks but also maintaining a broader preference for downside protection.
The current skew structure reflects a distinctly defensive tilt, with short-term hedging demand rebuilding even as implied volatility remains relatively low.
Gamma Exposure Shows Vulnerable Price Zone
The largest short gamma cluster is located near the $75,000 strike price, with approximately $2.5 billion in negative exposure below the current spot price of $77,500. Another significant short gamma cluster remains near $82,000, with exposure close to $2 billion. However, there is nearly $2 billion in positive gamma spread across three strikes above the spot price, forming resistance before reaching the higher short gamma acceleration zone at $82,000.
This structure makes spot more sensitive to sharp downside moves near the major negative gamma strike of $75,000, where market maker hedging flows could amplify weakness. This accumulation aligns with recent flow activity. Put buying has accounted for 55.5% of taker premium flow over the past 7 days and over 90% in the last 24 hours, demonstrating a clear rotation towards downside hedging.
The current gamma distribution reflects a more vulnerable structure, with concentrated put demand creating a critical zone that could amplify volatility if spot re-enters it.
Conclusion
Bitcoin remains in a structurally constructive position, but the latest positioning and flow data indicate that momentum is becoming increasingly selective beneath the surface. Institutional futures participation continues to recover, and the price remains resilient above key support levels. However, broad spot demand has not yet fully re-accelerated, particularly on US institutional venues.
Meanwhile, options positioning and the volatility market suggest a more cautious environment is forming near the upper end of the current range. The combination of weaker aggregate spot accumulation, softer ETF momentum, and renewed demand for downside hedging indicates that the market is still searching for a stronger catalyst to sustain expansion above the low $80,000s.
In summary, the broader trend remains constructive, but the latest data suggests the market is increasingly driven by positioning and derivatives activity rather than broad-based spot conviction. Until liquidity conditions improve further and stronger spot demand re-emerges, Bitcoin may continue to experience more choppy price action within the current range.


