
Ratio Repair in the Second Half: Gold Steps Aside, When Will Bitcoin Take the Stage?
- Core View: The Bitcoin/Gold ratio bottomed in February 2026 and has since recovered by 46% due to a gold correction. A weekly golden cross is expected to form in June, leading to Bitcoin outperforming gold in the second half. However, the macroeconomic environment is more complex due to high inflation, a hawkish Fed, and geopolitical conflicts.
- Key Factors:
- The Bitcoin/Gold ratio recovered from a February low of 12.5 to 17.6, driven by an 18% pullback in gold from its all-time high of $5,589, rather than a strong rally in Bitcoin.
- The weekly 9/21 EMA bullish golden cross is expected to form in the first week of June 2026. Historical data shows that after a golden cross, the ratio's potential increase can range from 148% to 641%.
- US CPI inflation reached 3.8%, dashing hopes for Fed rate cuts. Newly appointed Chair Warsh took office in May, shifting market pricing towards a hawkish stance, weakening the liquidity support for Bitcoin's rise.
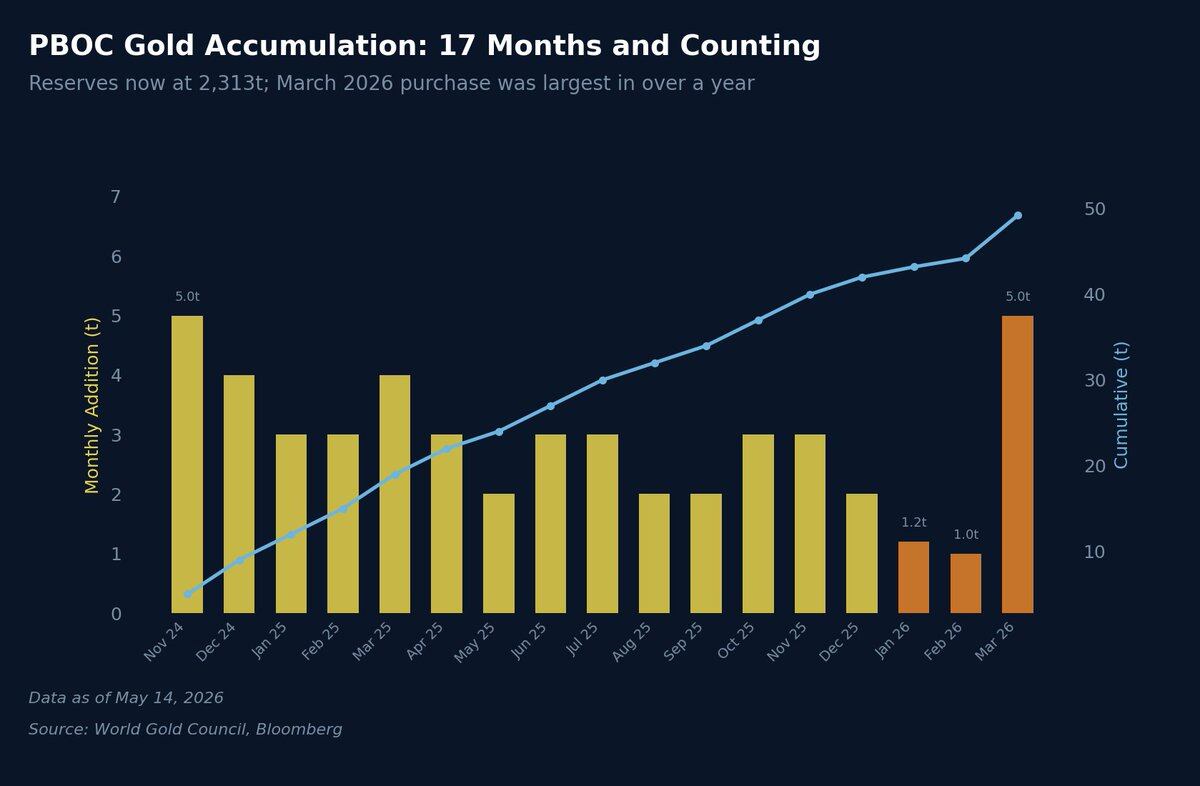
- The People's Bank of China has increased its gold reserves for 17 consecutive months, reaching a total of 2,313 tonnes, expanding its share to 9.6%. The continued gold-buying intent of global central banks provides a floor for gold prices.
- Bitcoin has steadily recovered from $65,000 to around $80,000, with a healthier market positioning structure. However, the recovery still relies on gold weakening and has not yet transitioned to a Bitcoin-led rally phase.
- The core conflict in the second half is the tug-of-war between the Fed's hawkish policy and the necessity of fiscal expansion. A meeting between Chinese and US leaders and a potential easing of US-Iran tensions could serve as catalysts for a resurgence in risk appetite.
- The current ratio still has significant room for recovery from its peak of 31.5 in October 2025. Under a conservative assumption (Bitcoin at $80,000-$100,000, gold at $4,200-$4,700), the ratio could rise to 19-21.3.
Original Author: that1618guy, Analyst at Delphi Digital
Original Translation: Chopper, Foresight News
Three months ago, I published the article "Bitcoin vs Gold: Positioning for the Next Relative Cycle". The core thesis was clear: within the weekly 9/21 Exponential Moving Average (EMA) framework, the Bitcoin/Gold ratio had entered its second-largest retracement in history, and data suggested a bottom was near. (Note: The weekly 9/21 EMA is a common trend-following combination used to identify trend direction and potential reversal signals.)
That thesis has now played out. The ratio has recovered approximately 46% from its February lows, Gold has retraced 18% from its all-time high of $5,589, and Bitcoin has steadily climbed from the $65,000 range back towards $80,000. The key confirmatory signal – a bullish golden cross on the weekly 9/21 EMA – is currently projected to form during the first week of June. Historically, following deep bearish death crosses, subsequent golden crosses have led to ratio gains of 148%, 641%, and 148% respectively.
However, the macro environment has shifted dramatically. With inflation at 3.8%, hopes for a Fed rate cut completely dashed, escalating US-Iran tensions, and Kevin Warsh officially assuming the role of Fed Chair on May 13th, the market landscape for H2 2026 is far more complex than it was in February. Nevertheless, the overarching trend of Bitcoin outperforming Gold remains intact.
This article will review the previous forecast for the Bitcoin/Gold ratio, revisit the Gold and macro market views from "2026 Market Outlook" and assess their performance, and provide an updated analytical framework for H2 2026.
Bitcoin/Gold Ratio Recovery Underway
When the article was published in late February, the Bitcoin/Gold ratio languished between 12.5 and 13, an historically extreme low. At that time, Bitcoin was trading around $65,000, while Gold was near $5,100 following a significant surge.
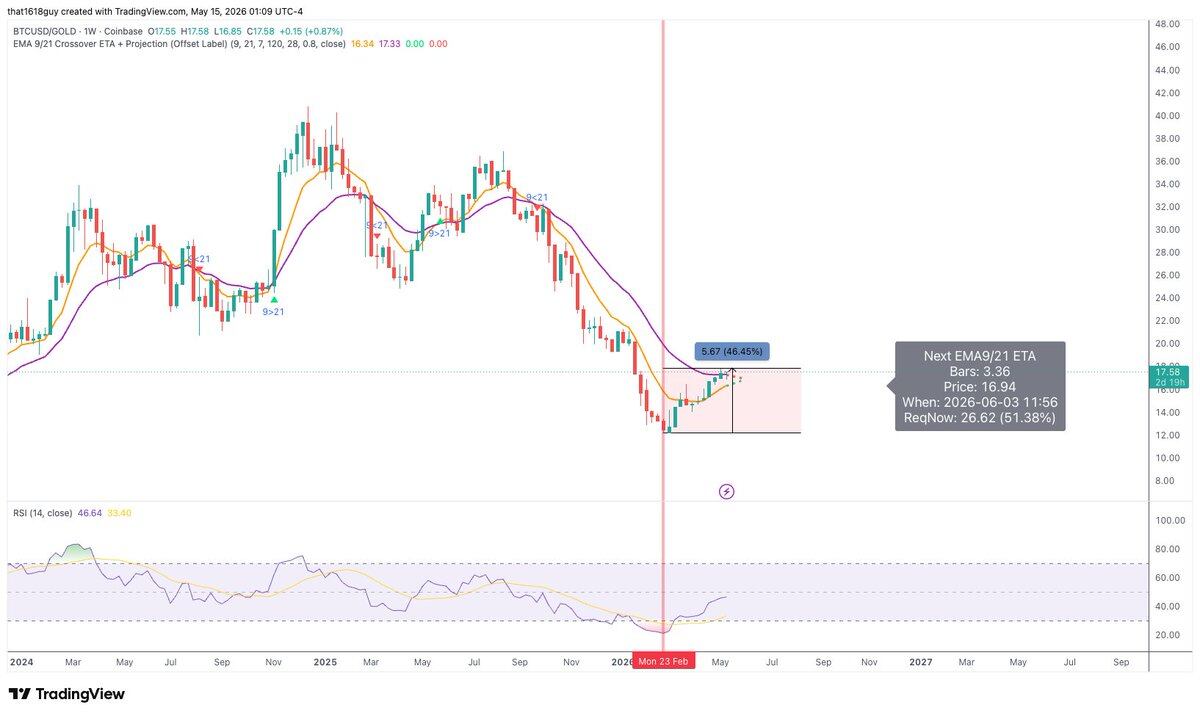
Today, the ratio has risen to 17.6, a substantial increase from its lows. This recovery was driven entirely by the first of two potential scenarios: Bitcoin didn't experience a violent breakout, but instead achieved relative strength through a pullback in Gold prices. This was exactly the dynamic highlighted in my previous article – the scenario most overlooked by the market. Few realized that Bitcoin's recent outperformance was primarily fueled by Gold's weakness, which has been the market reality since mid-February.
The ratio's retracement from its October 2025 peak has narrowed from approximately 60% to 46%. While still deep by historical standards, it has moved out of extreme territory, falling from the second-largest historical retracement to a moderate level.
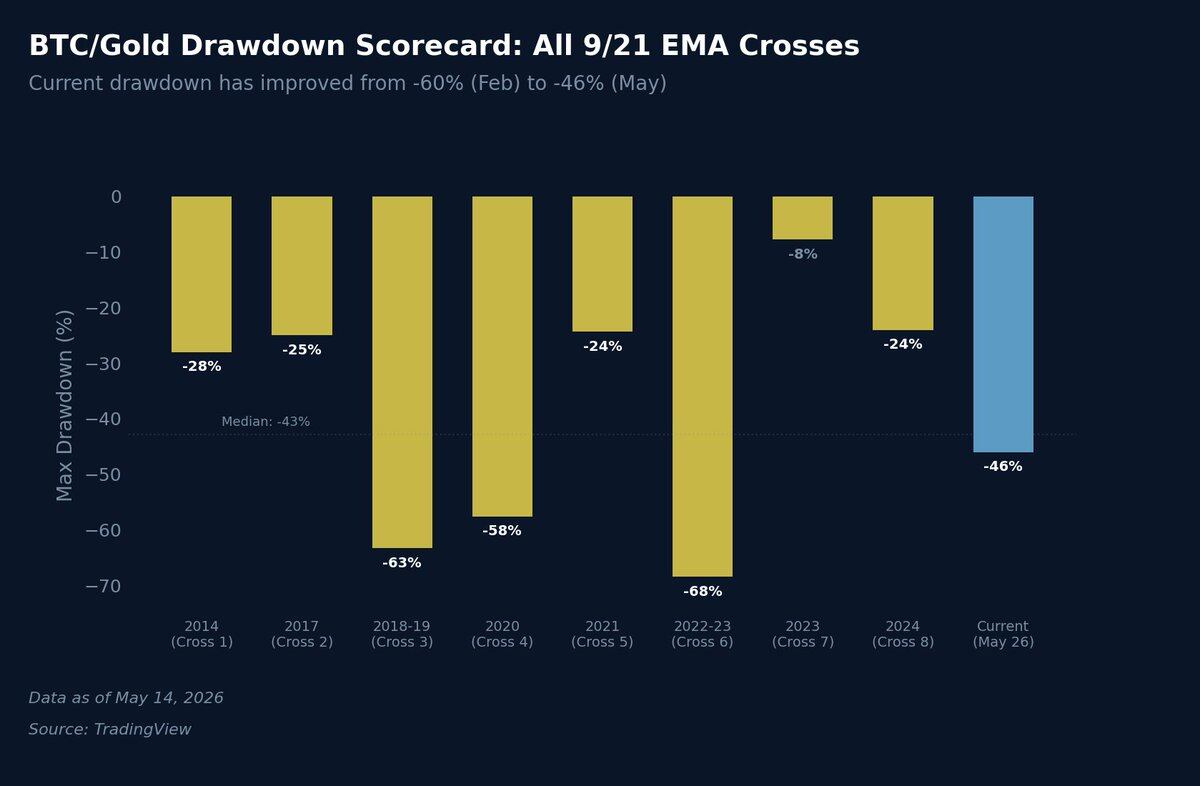
Looking back at eight historical downturns, only the 2018 bear market (63% retracement) and the 2022 bear market (69% retracement) saw steeper declines than the February lows. The current 46% retracement now closely aligns with the historical median of 43%, demonstrating significant recovery from the extreme lows three months ago.
The converging weekly 9/21 EMAs, a key signal I previously highlighted, have yet to materialize. Both EMAs remain in a bearish configuration, but the gap between them is narrowing rapidly. Based on trading desk model projections, approximately 3.5 more weekly candles are needed before a bullish golden cross occurs, placing it around the first week of June 2026.
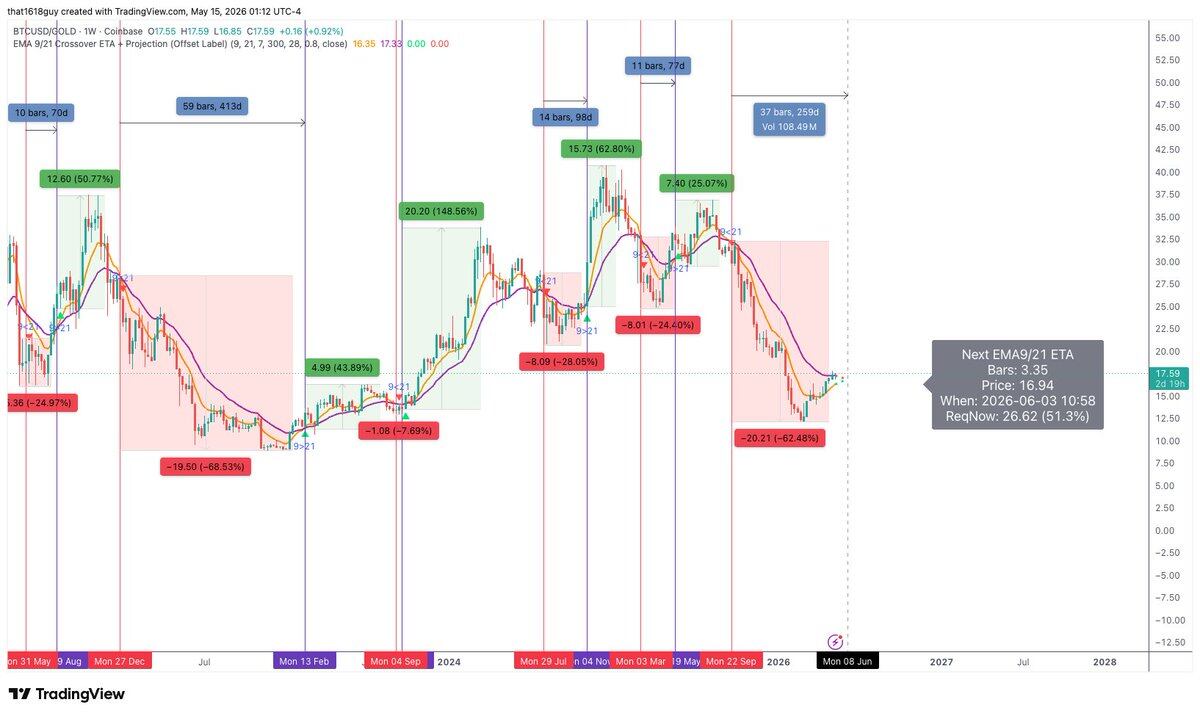
The previous weekly death cross led to a 62% decline in the Bitcoin/Gold ratio. This closely mirrors the three other significant historical death cross downturns (63% in 2018, 57% in 2020, 68% in 2022), confirming the validity of this technical analysis framework during bearish phases.
Similarly, the framework provides strong guidance for bullish phases. Once a bullish golden cross is firmly established, history shows that it often precedes powerful upward moves. The golden crosses following the three deepest death crosses resulted in ratio gains of 148%, 641%, and 148%. Even following shallower retracements, subsequent golden crosses produced gains ranging from 25% to 62%.
A crucial caveat: Not every golden cross is sustainable. A false breakout occurred in 2023, where the EMAs briefly crossed before quickly reversing, leading to a 7.69% decline in the ratio – the smallest and briefest death cross in the dataset. Investors can use momentum indicators like MACD or RSI to gauge the strength of a golden cross and filter out potential false signals.
My view remains that Bitcoin will continue to outperform Gold for the remainder of 2026, a trend that may even extend into the first half of 2027. The core question for the market now is the magnitude of the potential upside once the golden cross is confirmed and holds.
Review of the Annual Gold Market Outlook
In the "2026 Market Outlook" report, when Gold was trading around $4,600, we highlighted it as one of the most compelling asset classes. We pointed to strong structural tailwinds: continued central bank accumulation (notably by the People's Bank of China), fiscal deficits driving currency debasement, and the global trend of de-dollarization of foreign exchange reserves.
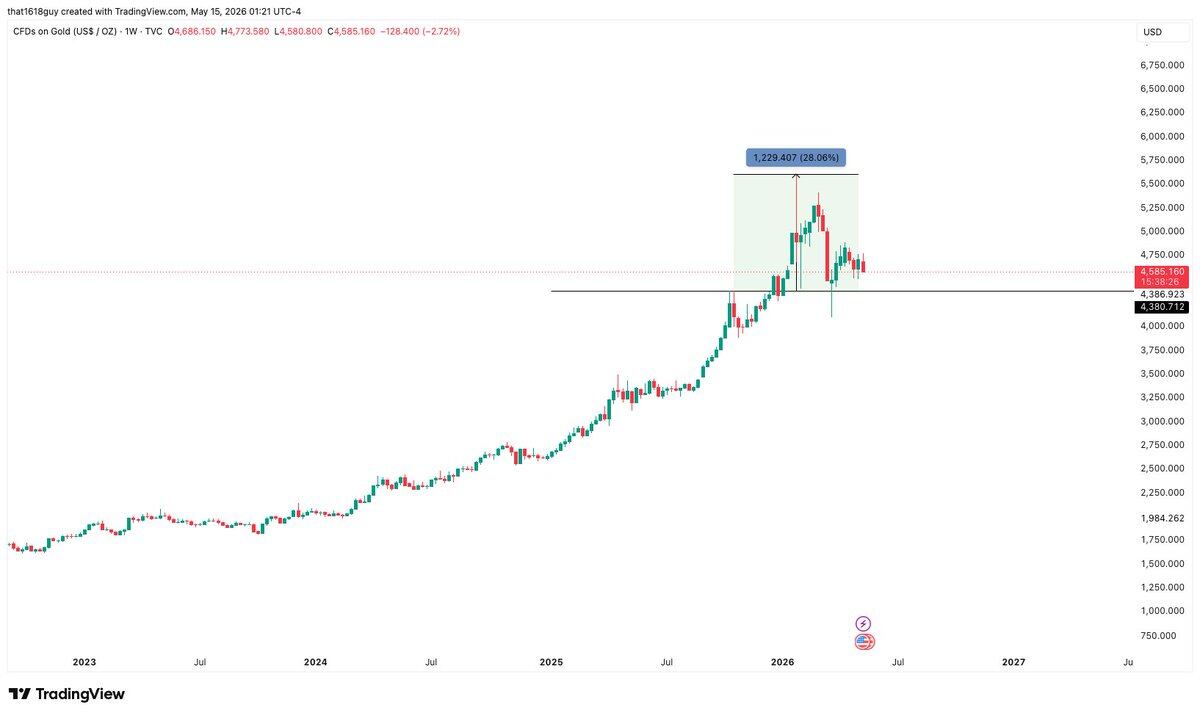
Gold subsequently surged, reaching an all-time high of $5,589 on January 28, 2026 – a gain of over 26% from our forecast level. Currently, Gold has pulled back to around $4,700, a 16% decline from its peak. This reversal stems from a confluence of three factors:
- Kevin Warsh's nomination for Fed Chair in January triggered a rapid shift towards hawkish market pricing, prompting significant profit-taking after Gold's rally.
- The outbreak of US-Iran military conflict on February 28th pushed oil prices above $100/barrel, exacerbating inflationary pressures. April's US CPI inflation rose to 3.8%, the highest since May 2023, extinguishing hopes for Fed rate cuts. While Gold can hedge multiple risks, a prolonged period of high interest rates acts as a significant headwind for this non-yielding asset.
- The rise in hawkish expectations strengthened the US Dollar Index, further pressuring Gold prices.
As mentioned in our annual outlook, Gold's weekly RSI briefly exceeded 85, entering an extreme overbought zone rarely seen in modern history. This signaled that short-term upward momentum would inevitably slow, likely leading to a period of consolidation – a scenario now playing out perfectly.
While this historic Gold rally has entered a digestion and adjustment phase, the underlying structural buying pressure remains intact. The short-term weakness is merely being suppressed by adjustments in interest rate expectations and a stronger US Dollar.
## Continued Gold Accumulation by the People's Bank of China
The views expressed in the annual outlook regarding the PBOC's gold accumulation have also fully materialized. The report noted that the PBOC is one of the largest and most consistent gold buyers globally; its continued accumulation is a key component of national strategic planning, potentially including using ample gold reserves to optimize its debt structure and build a cross-border RMB settlement system.
Since the annual report was published, the PBOC has increased its gold reserves for 17 consecutive months. Total official gold reserves now stand at 2,313 tonnes, representing 9.6% of total foreign exchange reserves (data from the World Gold Council). In March 2026 alone, the PBOC added approximately 5 tonnes of gold, its largest monthly purchase in over a year.
Overall central bank buying remains robust. Global central banks collectively purchased a net 244 tonnes of gold in Q1 2026, exceeding the previous quarter's total and the five-year average. Goldman Sachs had previously forecast average monthly central bank purchases of 70 tonnes for 2026. While the actual pace slightly undershot this initially (the PBOC purchased only 1 and 1.2 tonnes in Jan and Feb), the increased buying in March confirms that central bank demand is driven by market needs, not a phased withdrawal.
The most telling market signal is that the PBOC has not paused its buying spree even with Gold prices above $5,000. Historically, central banks often pause purchases or even sell into price strength. However, consistent with our previous assessment, the aggressive accumulation during this sharp price increase proves this is a long-term structural strategic allocation, not short-term speculative hoarding.
This trend is deeply intertwined with the relative strength logic of Bitcoin vs Gold. The PBOC's continued large-scale gold purchases represent a fundamental statement of intent regarding dollar reliance. Every tonne of gold bought is a tonne of reserve assets moved out of the dollar system. The de-dollarization wave continues to accelerate.
Data from the World Gold Council's March 2026 survey shows that the proportion of central banks planning to increase their gold reserves within the year rose from 62% in 2025 to 68%. Despite short-term bearish pressures on gold prices from the Fed's hawkish stance, a stronger dollar, and market fears of rate hikes, structural buying from central banks provides a solid price floor. This significantly limits Gold's downside and means that for the Bitcoin/Gold ratio to continue recovering, it will increasingly rely on Bitcoin attracting capital inflows in its own right – the second of our two potential scenarios.
## Review of Bitcoin and Gold Year-to-Date Performance
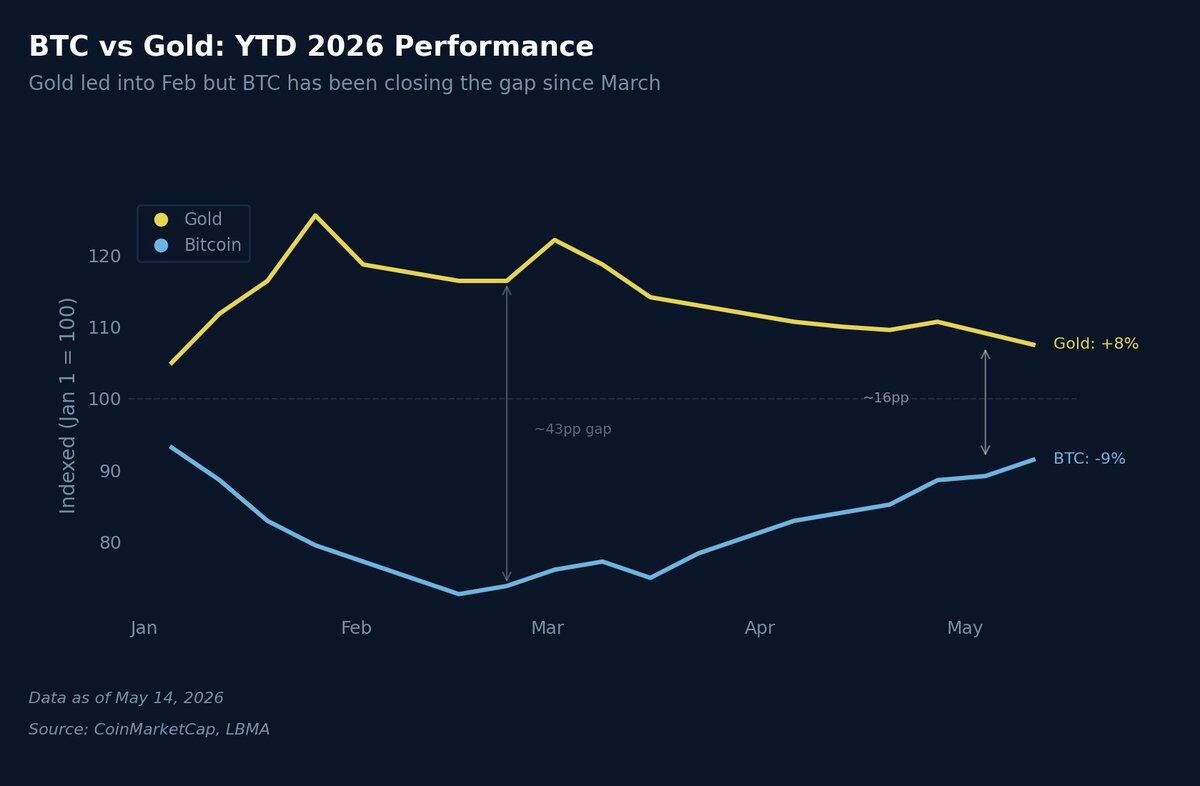
Calculating year-to-date (YTD) performance from January 1, 2026, the market dynamics are clear. Gold began the year with a powerful surge, boasting YTD gains of 25% by the end of January. Meanwhile, Bitcoin was down approximately 25% YTD at the same point. The divergence between the two assets was at its extreme, marking the bottom for the ratio that I identified in February.
Since then, their performances have converged. Gold has given back most of its YTD gains, now showing a mere 8% increase year-to-date. Bitcoin's YTD decline has narrowed from a maximum loss of 27% to around 9%. The performance gap between the two has shrunk from 50 percentage points to 17 percentage points, a direct visual representation of the real-time recovery in the Bitcoin/Gold ratio.
This convergence has been almost entirely driven by Gold's weakness, not a powerful Bitcoin rally. This carries significant implications for asset allocation strategy. The current market still operates under the first scenario (Gold pullback, Bitcoin range-bound). The core suspense for H2 is whether the market will transition to the second scenario (Bitcoin leading via capital inflows) or remain stuck in a prolonged period of range-bound consolidation.
Adding a piece of historical correlation: Past data shows that Gold's movements, and global broad money supply (M2) trends, often lead Bitcoin's price action by 3 to 4 months. Gold's initial breakout occurred in mid-2025, coinciding with Global M2 money supply hitting new highs. Based on this lag, Bitcoin should have followed suit sometime between late 2025 and early 2026. However, this correlation failed to materialize, with the lag extending to 5 or 6 months. Such extensions are not unprecedented; the 2020 pandemic shock also lengthened the correlation cycle. Historically, when the correlation reasserts itself after such a lag, it often leads to significant price volatility.
Now, the US-Iran geopolitical conflict is playing a role similar to the pandemic, generating fresh inflationary pressures and directly delaying the Bitcoin rally that loose liquidity signals would typically trigger.
## What Has Changed Since February?
Three months since the previous research report, the market environment has undergone substantial changes. Here's a review of the forecast vs. reality:
### Thesis Confirmed
- The Bitcoin/Gold ratio bottomed within the predicted range, initiating a recovery driven by Gold's pullback.
- The deep correction in Gold after its surge has materialized.
- The trend of global central banks continuously accumulating Gold remains intact.
- The convergence pace of the weekly 9/21 EMAs is roughly in line with initial projections.
### Thesis Unfulfilled
Expectations for Fed rate cuts have been completely dashed. In February, my base case was for one or two rate cuts in H2 2026, a view widely shared by the market. This logic has fully unraveled. With US CPI inflation at 3.8%, rising Producer Price Index (PPI), oil firmly above $100, and the US-Iran conflict amplifying supply-side inflationary pressures, the market has not only abandoned rate cut expectations but is now pricing in the possibility of rate hikes by year-end. This represents the single biggest deviation from my earlier thesis.
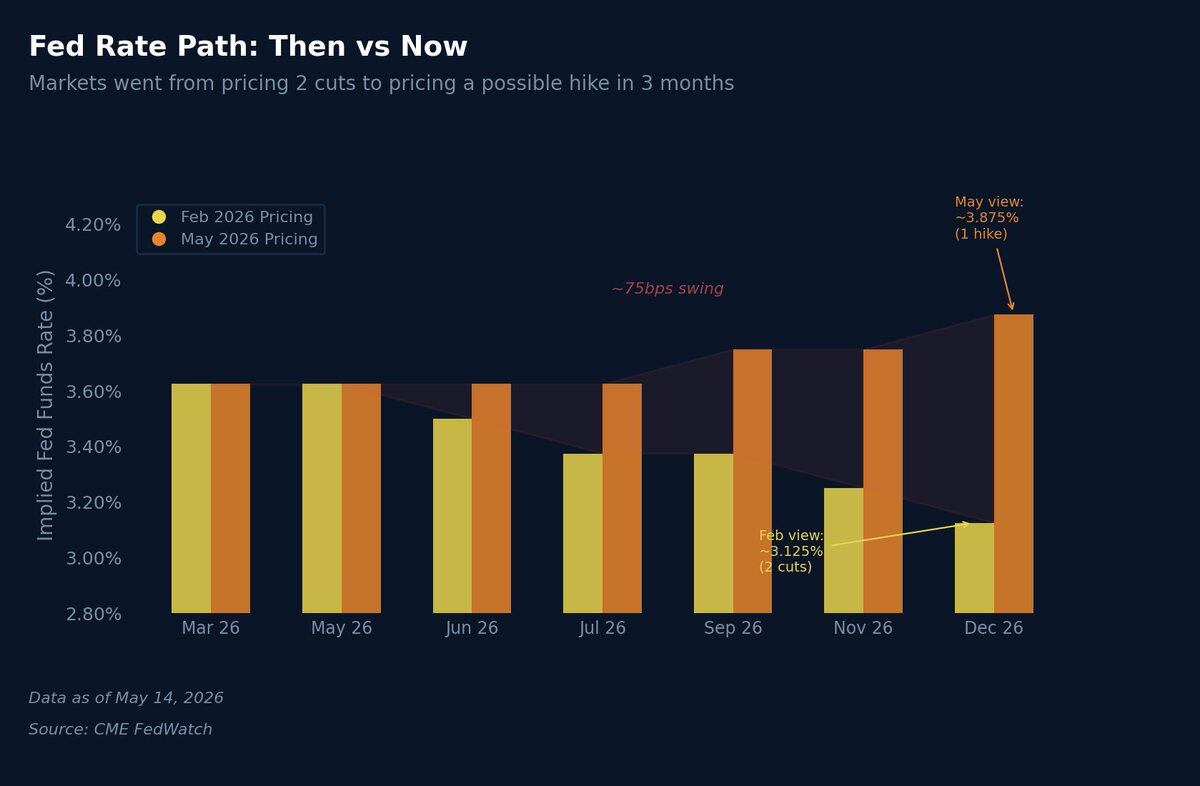
Interest rate market expectations have undergone a violent reversal. In February, the market expected the Federal Funds Rate to fall to 3.125% by December 2026, implying two cuts. Currently, market pricing indicates rates will finish the year unchanged or higher, with the implied rate near 3.875%. In just three months, the expected rate trajectory has shifted by a dramatic 75 basis points, primarily due to the energy-driven inflation shock resulting from the geopolitical conflict.
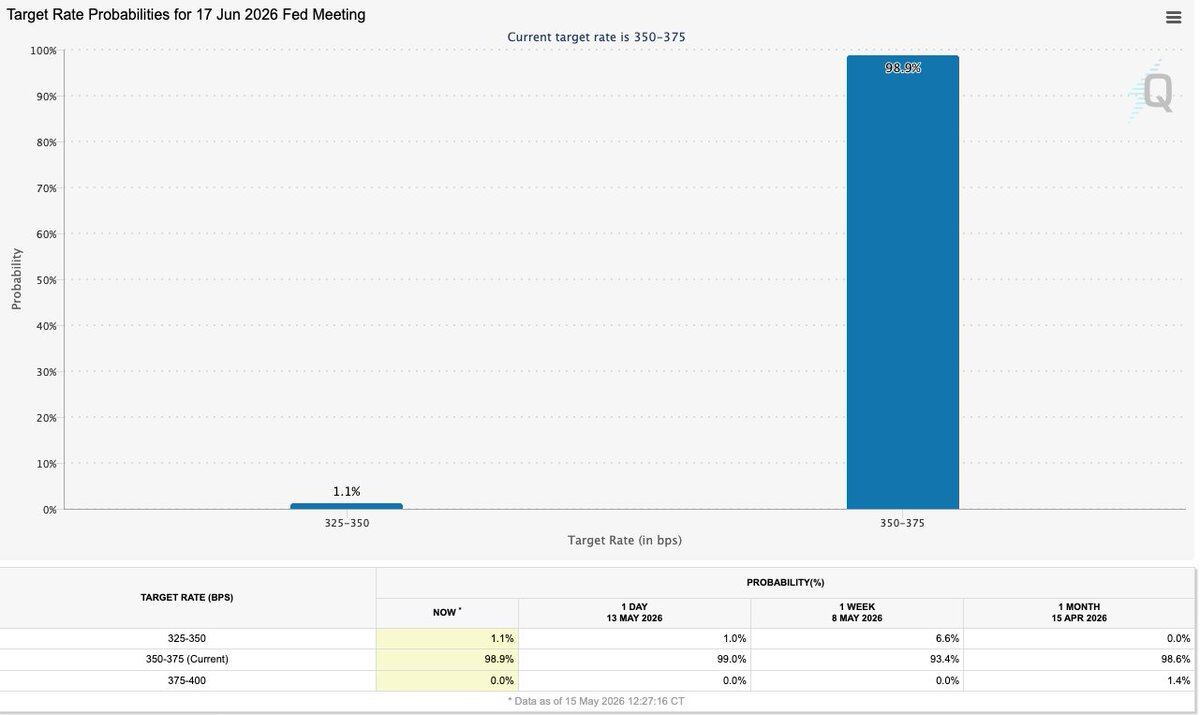
The Fed Chair transition has also dashed previous expectations for an easing bias. The market had anticipated a more dovish stance from the new Chair after Powell's departure. However, Kevin Warsh has taken office with a significantly more hawkish posture than his predecessor. His first FOMC meeting is scheduled for June 16-17. Under his leadership, it's unlikely the Fed will embark on a large-scale easing cycle even if economic growth slows, directly altering the H2 risk-on asset rotation thesis I previously outlined. Current market models peg the probability of a rate cut at this meeting as near zero.
However, the previously identified fiscal dominance logic remains valid. The US is effectively monetizing debt through the banking system. The annual fiscal deficit is running between $1.5-$2 trillion. Regardless of the Fed's monetary policy stance, the sheer weight of fiscal pressure will eventually force more liquidity into the market.
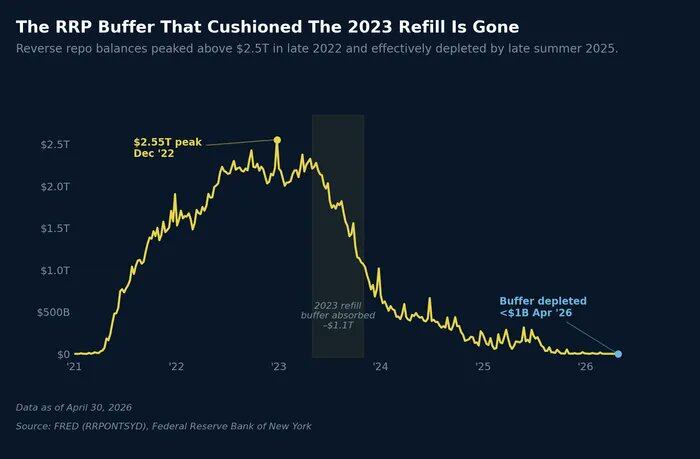
US national debt has now surpassed $39 trillion. The Treasury still needs the market to absorb massive amounts of newly issued bonds. Hedge fund basis trades continue to support the long end of the yield curve, and the overnight reverse repo facility (RRP) balance remains low.
Even if Chair Warsh projects a hawkish tightening stance, the underlying operational needs of the financial system demand liquidity support. The central conflict to watch in H2 will be the tug-of-war between the Fed’s hawkish monetary policy stance and the structural necessity of fiscal accommodation.
## H2 2026 Market Outlook
My core thesis remains unchanged: the Bitcoin/Gold ratio is recovering from historically extreme lows, and the directional bias is decisively positive. The key driving factors for H2 are as follows:
### The Gold Side
Gold’s 18% decline from its all-time high has already created ample room for the ratio to recover. Even if Gold simply consolidates its recent gains without further downside, any positive market catalyst could still lift the ratio higher, capitalizing on Bitcoin’s superior historical elasticity. Continued global central bank buying provides solid support, seemingly anchoring Gold’s price floor in the $4,200-$4,500 range. This relative strength rotation does not require a Gold crash; it merely needs Gold’s uptrend to pause.
### The Bitcoin Side
Compared to February, Bitcoin's current market positioning is healthier. Since rallying from the $64,000 low, it has steadily climbed to around $80,000 over a dozen weeks, successfully absorbing multiple bearish shocks – including the US-Iran conflict, the Fed chair transition, and recalibrated inflation expectations – without revisiting its lows.
A core catalyst event I am monitoring is the potential US-China leaders' meeting. Tangible progress on a trade truce, coupled with a de-escalation of US-Iran tensions, could rapidly boost risk appetite. Current Bitcoin market positioning appears subdued, suggesting significant upside potential relative to other assets should risk sentiment improve.
### The Macro-Policy Side
Chair Warsh's stance introduces


