
「TACO」is out, Wall Street embraces「NACHO」trading
- Core Thesis: Wall Street trading patterns have shifted from the "TACO" (expecting Trump to concede) regime to "NACHO" (betting on a prolonged Strait of Hormuz blockade). Markets are pricing high oil prices as a structural norm, validated through derivatives markets, rather than a one-off shock.
- Key Elements:
- From the US-Israeli airstrikes on Iran on February 28 to early May, oil prices surged over 50%. While the S&P 500 hit an all-time high, the two assets decoupled, indicating the market no longer requires falling oil prices as a prerequisite for equity gains.
- Trump's "ceasefire" announcement on March 23 was nullified after Iran denied it, marking the critical tipping point for the TACO regime. Subsequently, all "ceasefire headlines" failed to bring oil prices back to the pre-war baseline ($67).
- Three derivatives markets support NACHO: War risk insurance premiums for the Strait of Hormuz have soared to 1%-8% of vessel value; the Brent crude futures spread (June 2026 vs. December 2030) has reached $28.5, its steepest backwardation; the market is pricing in zero rate cuts by the Fed for all of 2026.
- Sector divergence within the broader market: The Energy Sector ETF (XLE) is up 31.63% year-to-date, the only sector in positive territory. The Transportation Sector ETF (IYT) has risen just 8.79%, underperforming the broader market by 15 percentage points, reflecting the direct impact of high oil prices on cost structures.
- NACHO has a physical endpoint: JPMorgan estimates that 280 million barrels of globally available commercial inventory have been drawn down, leaving roughly 520 million barrels. It is expected to approach "operational stress levels" by early June, with European aviation fuel inventories potentially falling below the 23-day warning threshold by June.
- Prediction market data aligns: Polymarket shows the probability of "normal navigation through the Strait of Hormuz by May 31" at just 28%, and the probability for before May 15 at 2%. Active positions are betting the blockade will extend into June.
On Wall Street, the "TACO trade" is over, and everyone is now discussing a new trading pattern — "NACHO."
The Strait of Hormuz has remained closed since the U.S. and Israel launched airstrikes on Iran on February 28. Oil prices have surged over 50% since before the conflict, and expectations for a Fed rate cut in 2026 have been compressed from two cuts pre-war to zero currently. Yet, over the same period, the S&P 500 has hit all-time highs, rising for six consecutive weeks — its longest winning streak since 2024.
Wall Street has coined a term for this seemingly contradictory market state: NACHO, which stands for "Not A Chance Hormuz Opens." It is the antithesis of TACO (Trump Always Chickens Out). TACO bets on "people backing down" — that Trump would retreat at a critical moment. NACHO bets on "situations stagnating" — that the Strait of Hormuz cannot be reopened this time through a single Truth Social post.
"For most of the crisis, every ceasefire headline triggered a sharp drop in oil prices, as traders repeatedly bet on a resolution that never came," said Zavier Wong, a market analyst at eToro. "NACHO means the market acknowledges that high oil prices aren't a one-time shock, but a feature of the current market environment itself."
The Two Diverging Lines in Early April
March 23 marked the tipping point. That morning, Trump announced on Truth Social that he had engaged in "very good and constructive dialogue" with Iran, ordering the Pentagon to pause strikes on Iranian energy facilities for five days. S&P 500 futures rebounded nearly 4% from session lows within minutes, adding $1.7 trillion in market value. Brent crude plunged from a session high of $109 to $92.
Then, Iranian officials denied the dialogue. According to Iranian state media, a "senior security official" called it market manipulation, stating that no dialogue had occurred. The gains were halved within two hours; the S&P 500 closed up just 1.15%, and Brent crude bounced back to $99.94.
That was the first time in 14 months that a Trump "backdown" failed to move the market. The reason is simple: under the TACO framework, backing down was unilateral — a single post sufficed. The March 23 backdown required Iranian cooperation. When the counterparty doesn't play along, a backdown becomes a lie.
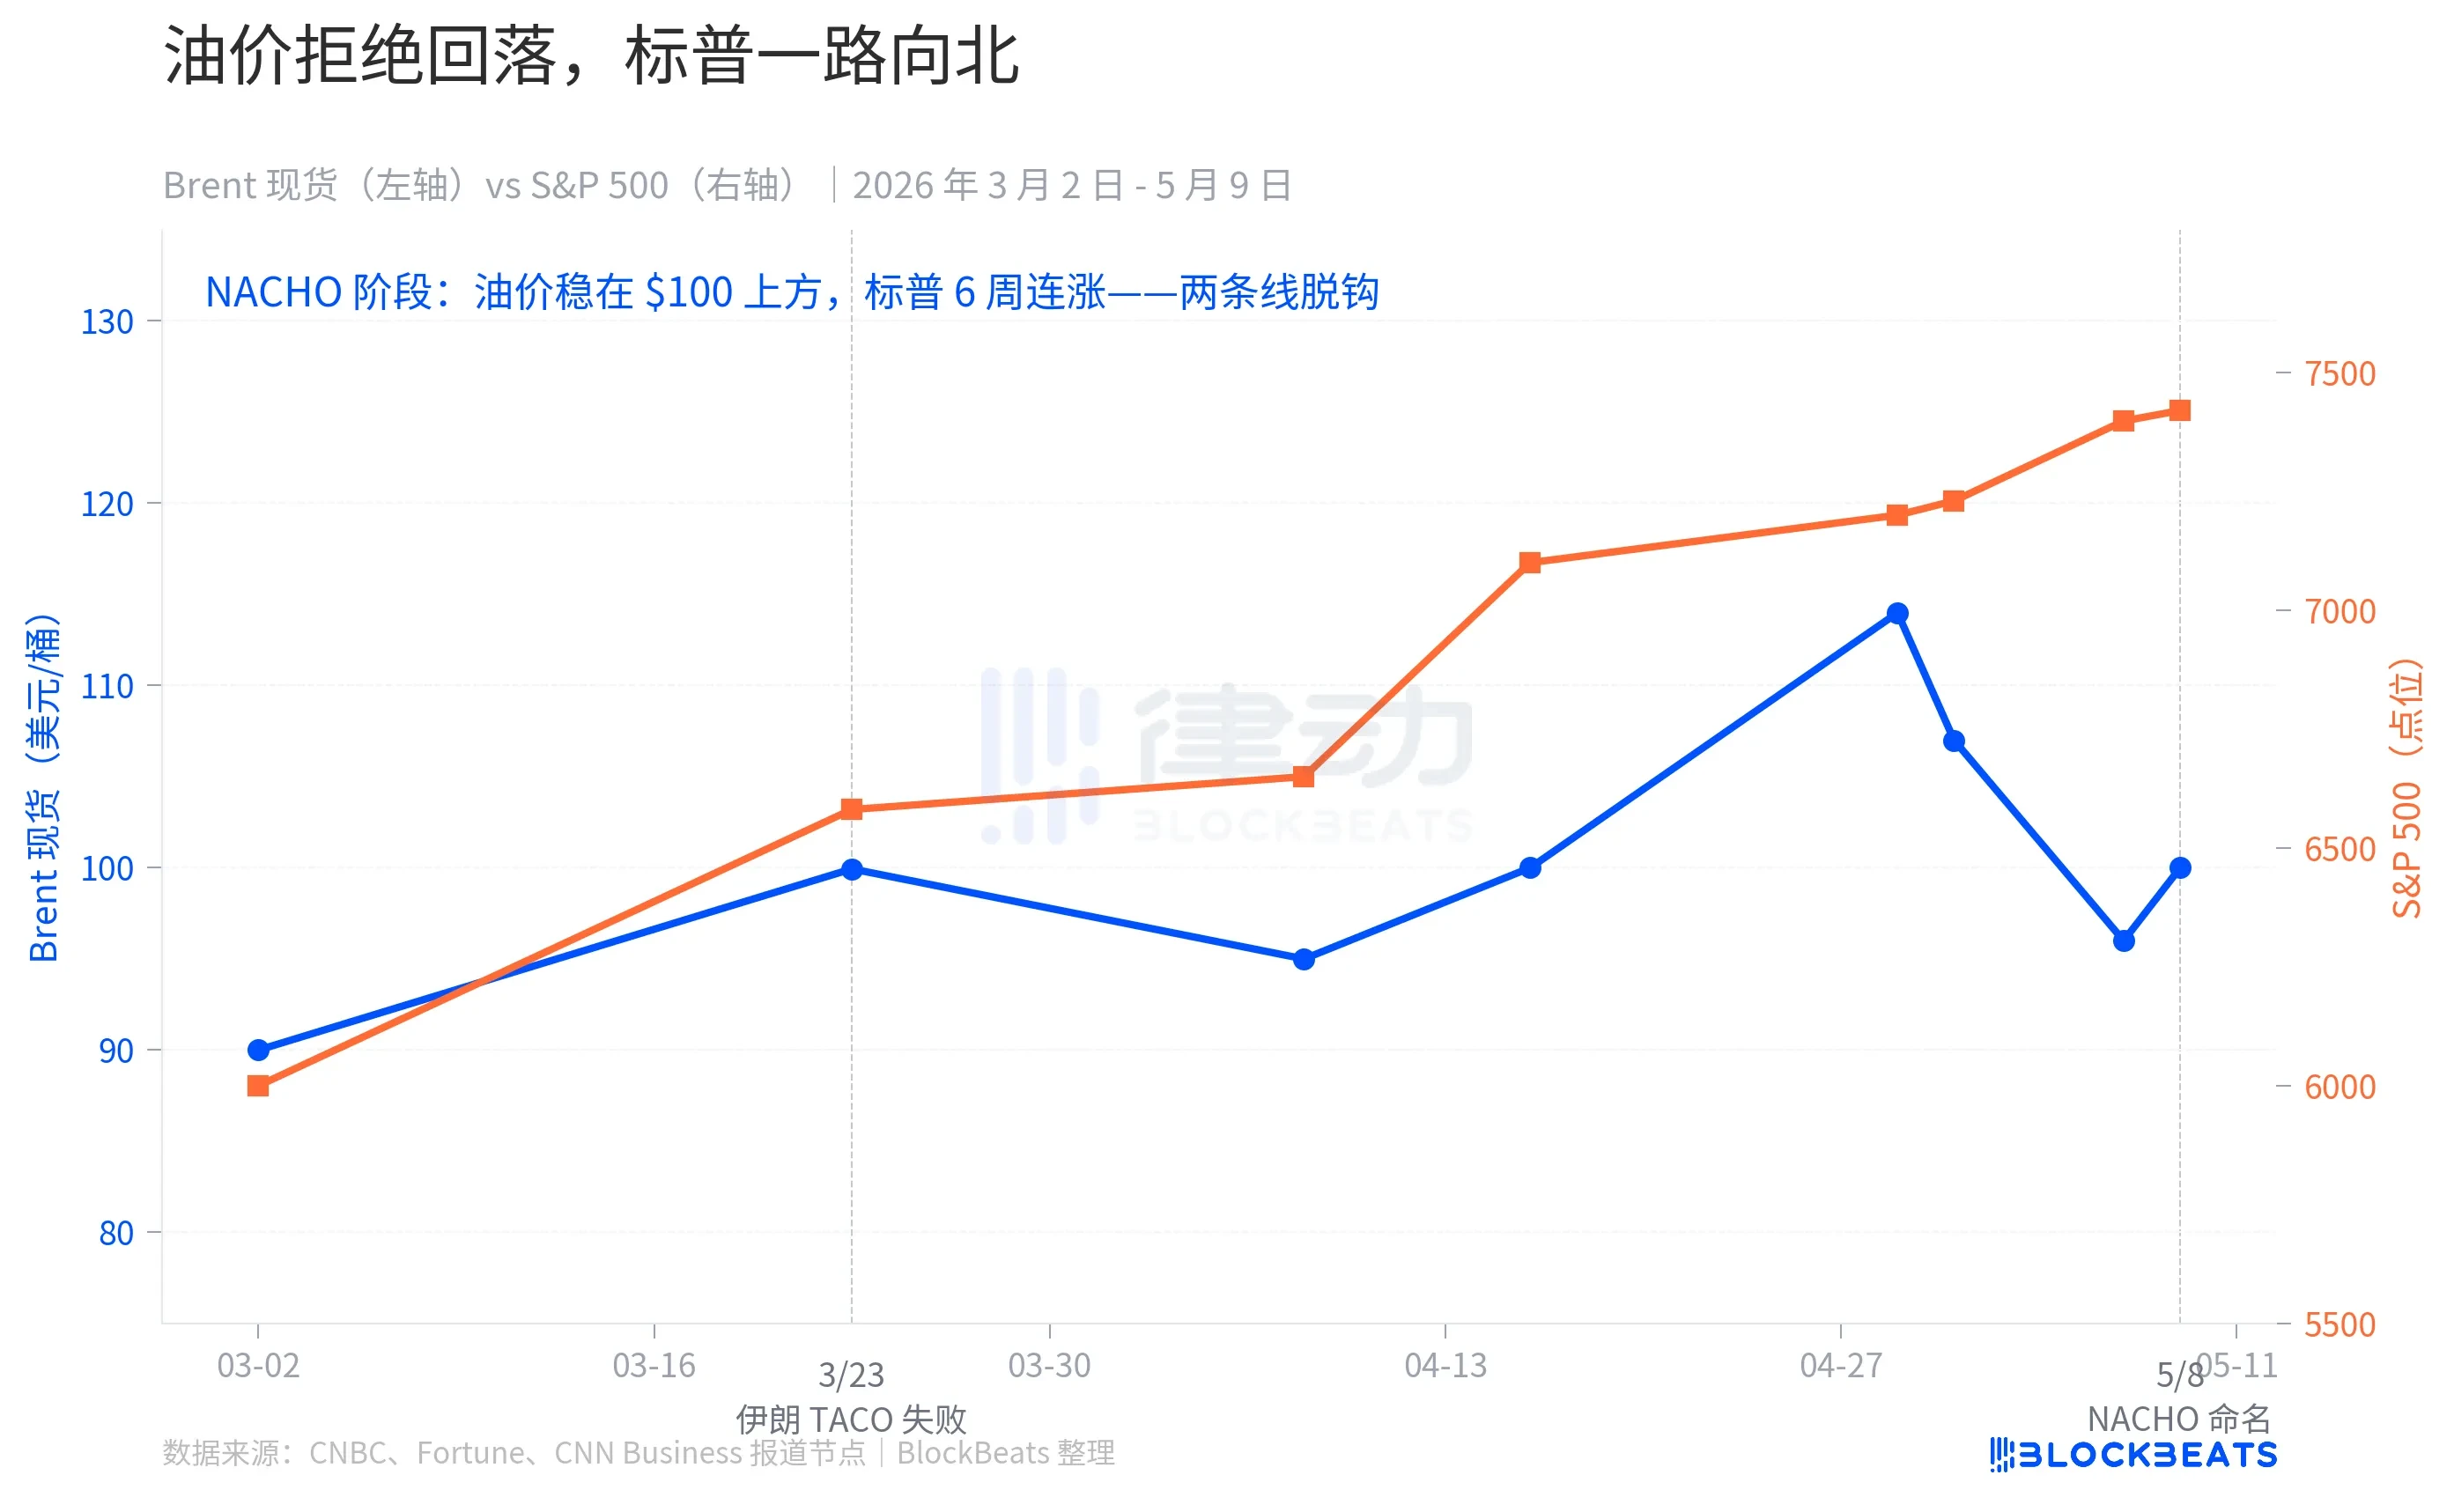
From that day forward, market behavior underwent a fundamental shift. Over the next six weeks, Brent crude never fell back to its pre-war level of $67, and the May average remained at $109.57. Despite the U.S.-Iran ceasefire agreement on April 7-8, oil prices briefly returning to "early war levels" on April 17, and news of an imminent U.S.-Iran deal on May 7, none of these "ceasefire headlines" brought oil back to its baseline.
But the S&P 500 kept marching higher. It rose 10% in April alone — its best month since November 2020 — setting seven new intraday all-time highs. It briefly broke 7,230 points on May 1 and closed at 7,398 on May 7.
The two lines completely decoupled in early April. In the TACO era, they moved in sync: threats drove oil down and stocks down; backdowns drove oil up and stocks up. In the NACHO era, they speak two different languages. Oil says "Hormuz is closed for good," while the S&P says "not my problem."
Three Markets, Three Reactions
NACHO is not just rhetoric; it's a bet placed with real money across three distinct derivatives markets.
The first layer is insurance. According to historical data from the Strauss Center, war risk insurance premiums for the Strait of Hormuz spiked to 3.5% of vessel value during the 2003 U.S. invasion of Iraq and reached 7.5% at the peak of the 1980-88 Iran-Iraq War's "Tanker War" following an attack on the Yanbu Pride. The pre-crisis baseline was 0.125% to 0.25%. By early May, rates had entered the 1% range, with some policies surging to 3% to 8%.
In dollar terms, the cost to insure a single Very Large Crude Carrier (VLCC) for one transit has jumped from roughly $250,000 pre-war to between $800,000 and $8 million today. An insurer's job is to price risk. The practical implication of this layer is that if insurers simply refuse to underwrite, shipowners won't risk uninsured transits. A "physical reopening" of the strait is very different from "actual navigability."
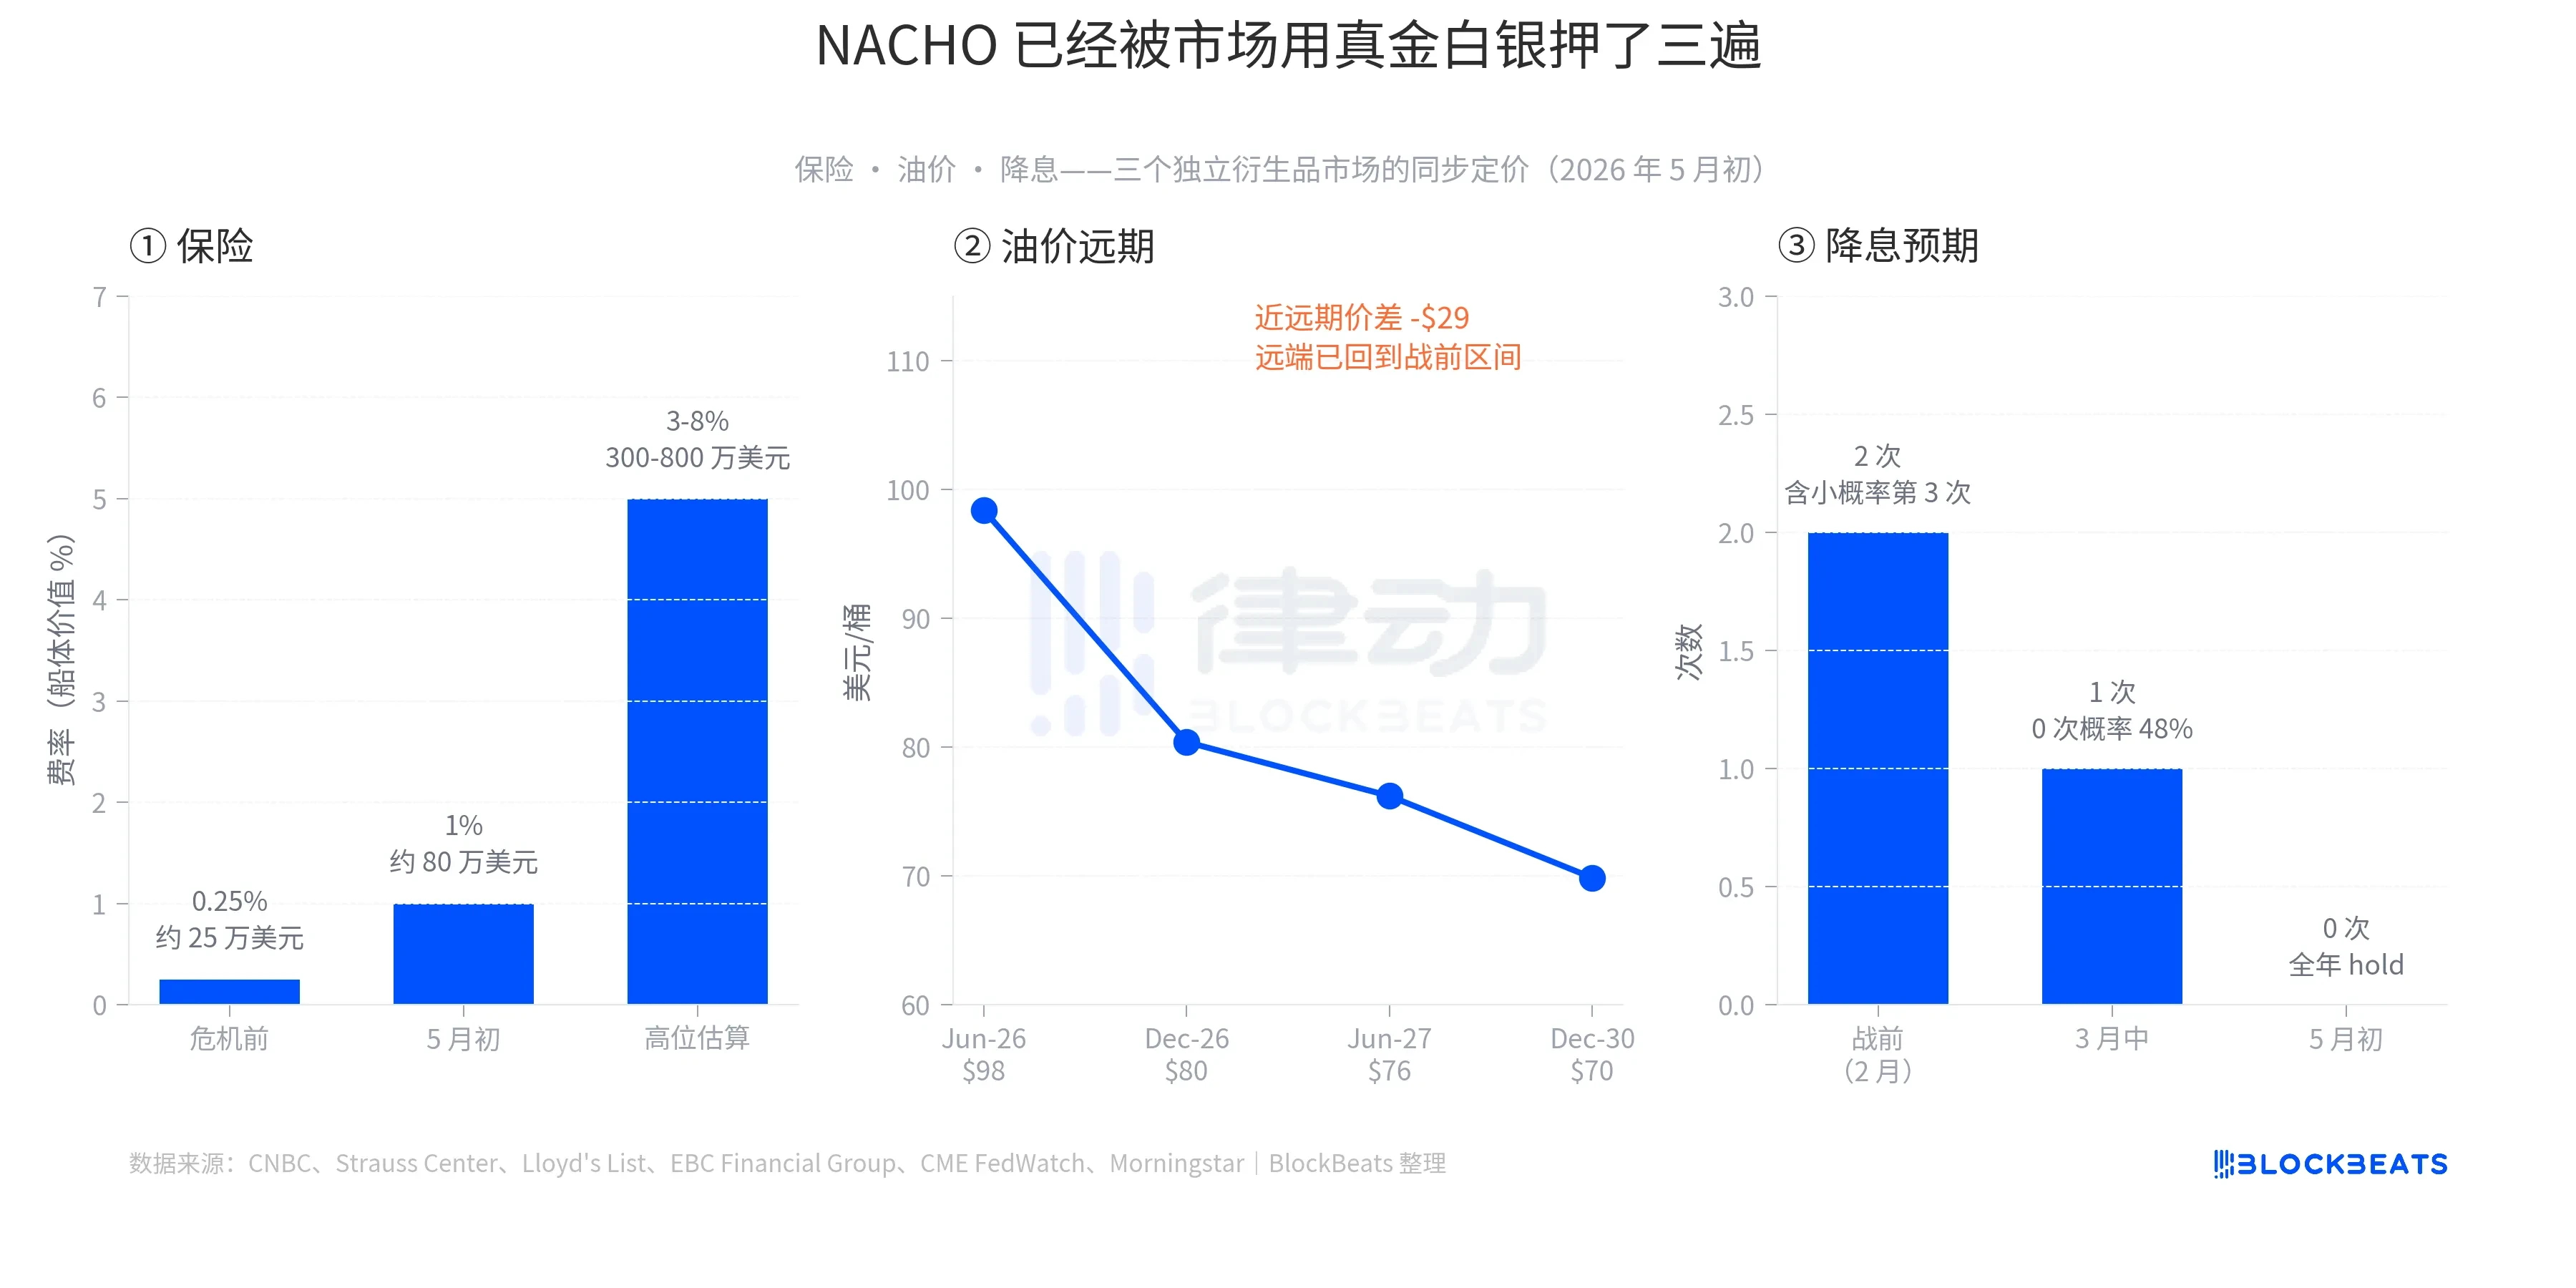
The second layer is oil prices. Early May data shows the Brent Jun-26 contract at $98.41, Dec-26 at $80.39, Jun-27 at $76.20, and Dec-30 at $69.85. The spread between the front-month and Dec-30 is about $28.5, one of the steepest backwardation structures in five years. This curve tells a very specific story: the market sees spot supply as tight but expects it to eventually ease, with far-dated prices returning to the pre-war range of $60-$70. In other words, high oil prices are not the endgame, but a bounded window. However, the window is long enough that traders don't bet on it closing abruptly.
The third layer is interest rates. In early February 2026, the market expected the Fed to cut rates twice this year, with a small chance of a third cut. After oil prices surged in mid-March, expectations were compressed to one cut, with the probability of zero cuts reaching 48%. On April 29, the Fed held rates at 3.50%-3.75%. CME FedWatch data on May 6 showed a 70% probability of another hold at the June meeting, with the market pricing in zero rate cuts for all of 2026. Legendary hedge fund manager Paul Tudor Jones even said on CNBC on May 7 that "even [Kevin] Warsh has no chance of getting the Fed to cut rates."
All three layers have left their mark on the derivatives markets. This isn't a narrative; it's real money.
A Stock Market Divided
A second, less obvious detail about NACHO is that it has already caused divergent pricing within the broader market.
As of the close on May 7, the Energy Select Sector SPDR Fund (XLE) is up 31.63% year-to-date, making it the only major sector in positive territory for all of 2026. Over the same period, the S&P 500 has gained about 24%. In contrast, the iShares U.S. Transportation ETF (IYT) is up just 8.79% year-to-date, underperforming the S&P 500 by over 15 percentage points.
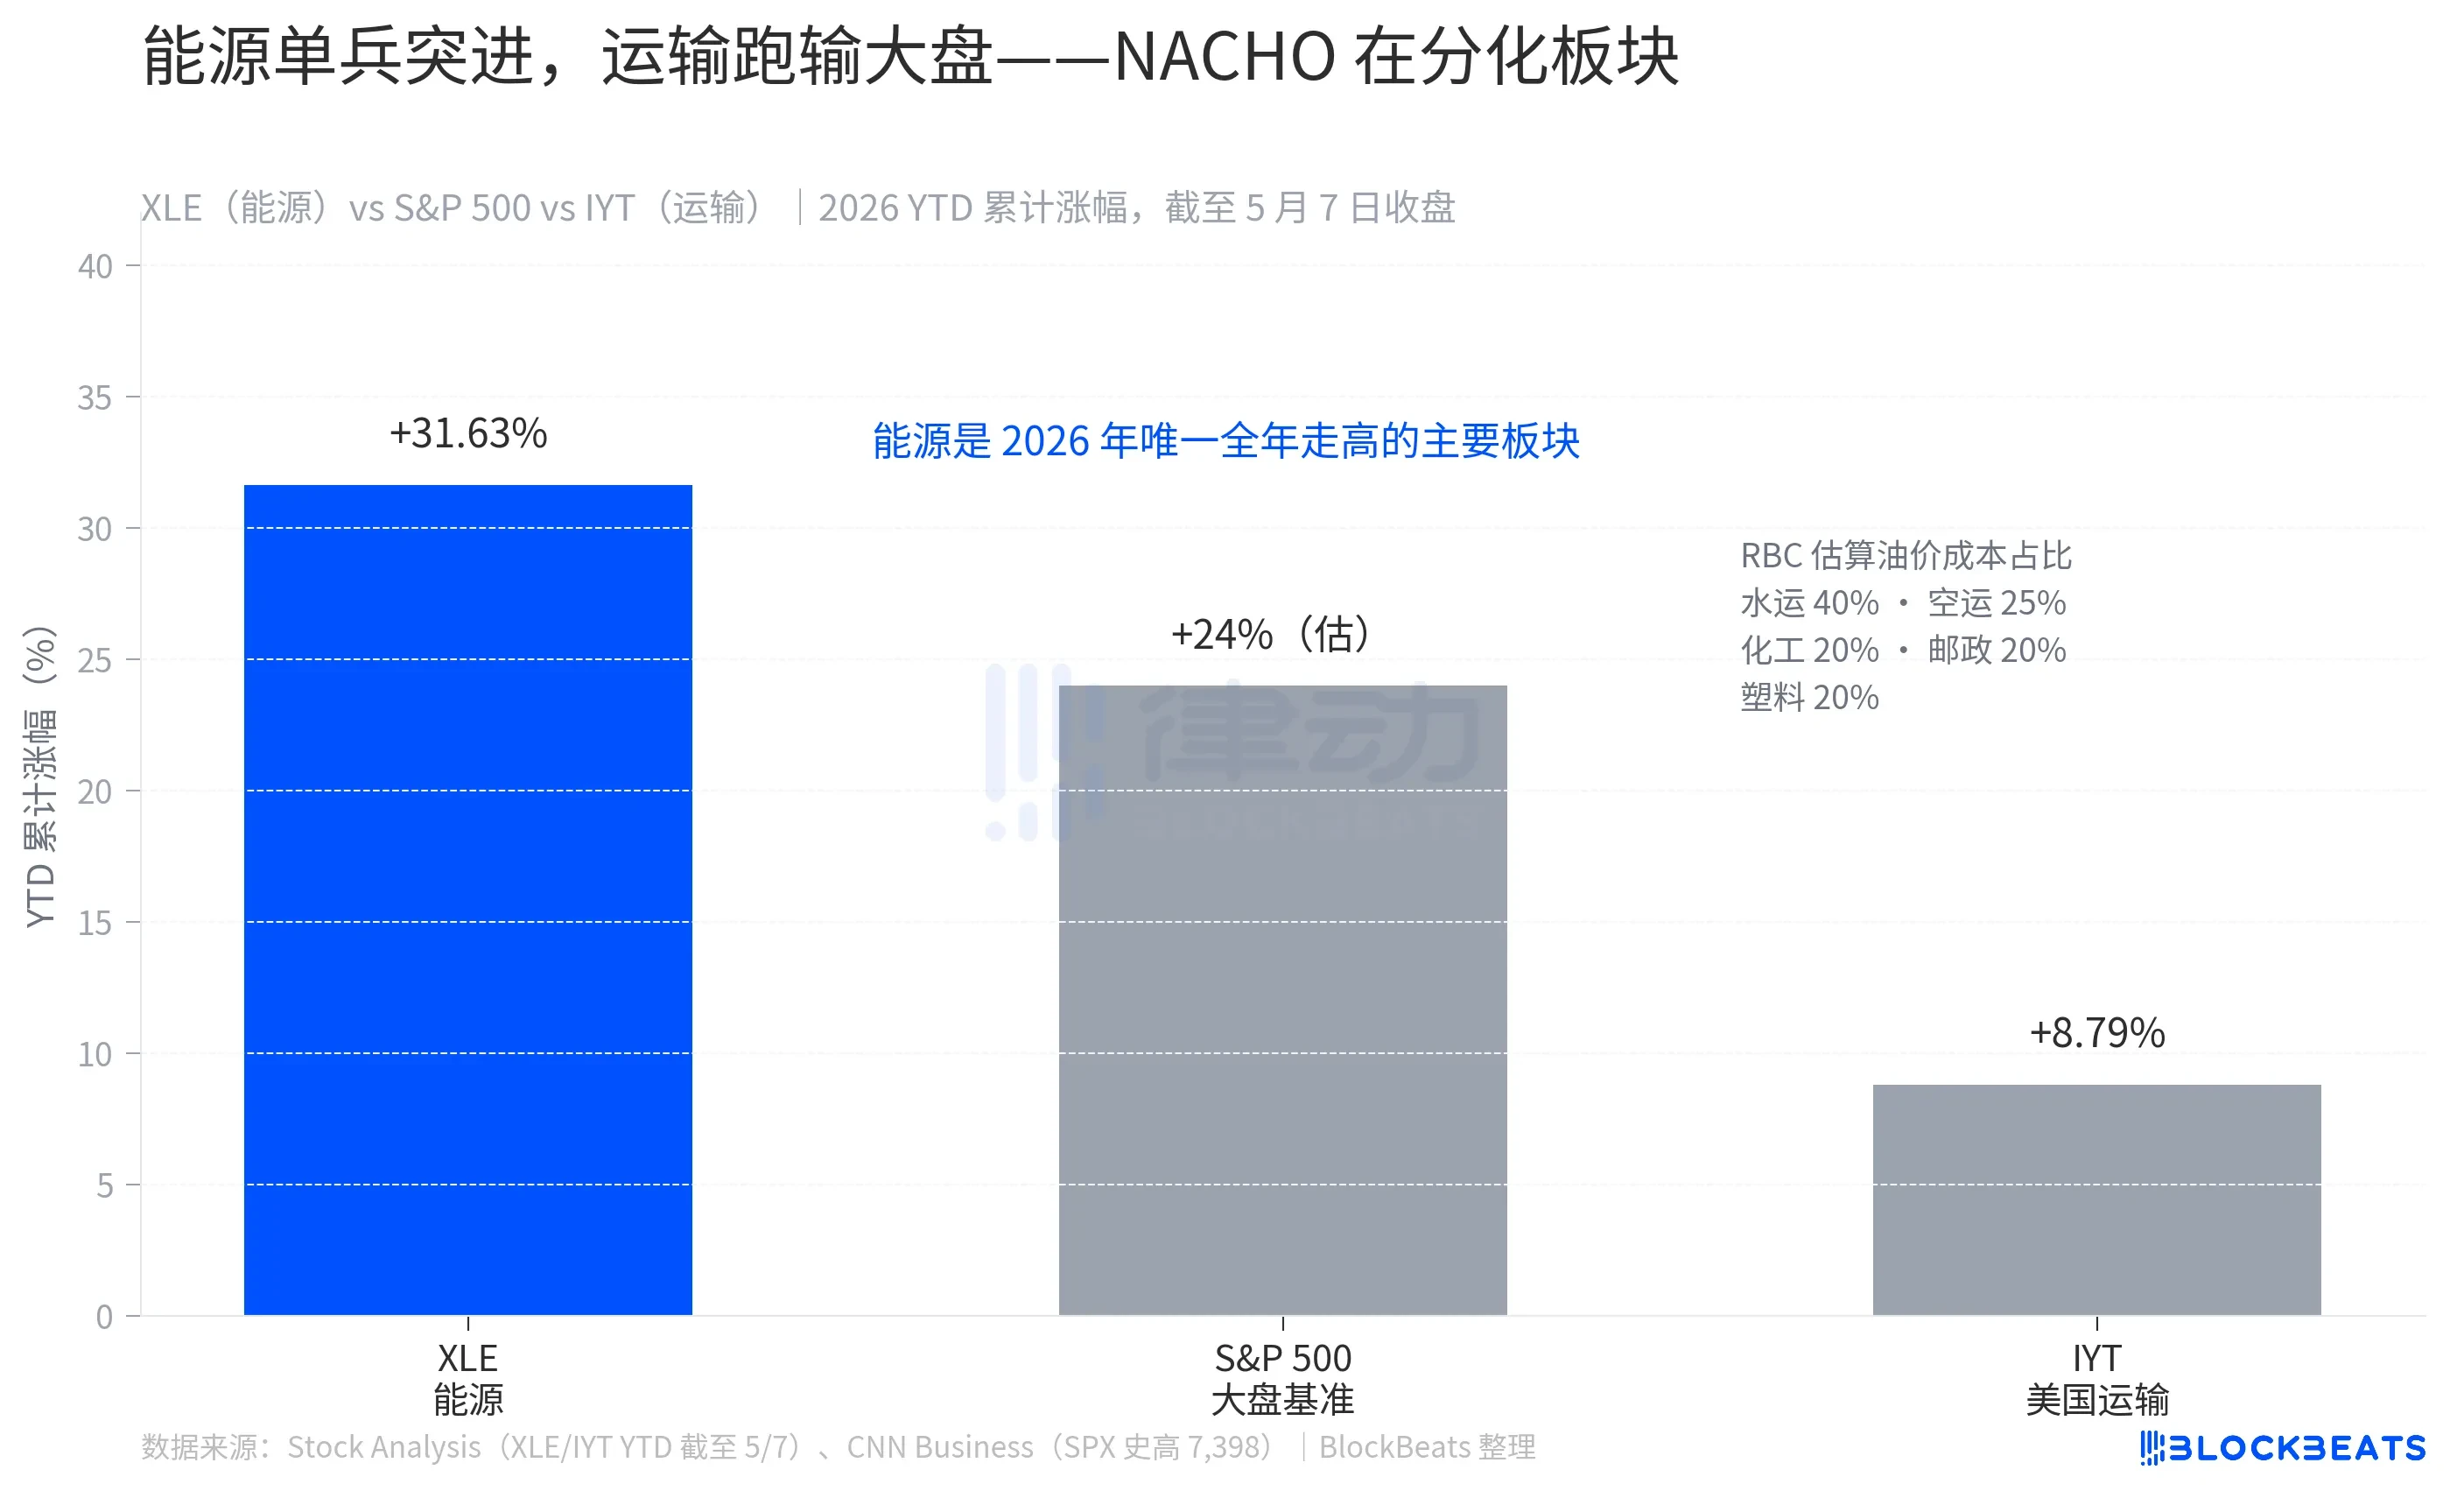
This disparity is not random. According to estimates from RBC Capital Markets, fuel accounts for 40% of operating costs in the maritime shipping industry, 25% in air freight, and 20% each in chemicals, postal/courier services, and rubber/plastics. If fuel is a major line item in your cost structure, NACHO hits you directly.
XLE's 31.63% gain isn't a short-term bounce; it's the result of eight consecutive weeks of outperformance. IYT's 8.79% gain isn't weakness per se, but rather a case of rising with the broader market while having its returns eroded by higher oil prices. The market is clearly telling readers how to calculate the odds of NACHO: just look at how much the transportation ETF is lagging.
But NACHO is not an open-ended bet. It has a very specific expiry date: June 1.
According to JPMorgan's commodities research team, global commercial crude oil inventories stood at approximately 8.4 billion barrels in early 2026. However, only about 800 million barrels of that is considered "operationally available." The rest consists of pipeline fill, tank bottoms, and minimum terminal reserves needed to keep the system running. Since the start of the crisis, about 280 million barrels of this buffer have been drawn down, leaving roughly 520 million barrels in usable inventory. JPMorgan notes, "Commercial inventories are expected to approach operational pressure levels by early June."
"Operational pressure level" is a specific physical concept. JPMorgan explains: "The system won't collapse because oil disappears, but because the distribution network no longer has enough working inventory." Once this line is crossed, governments and businesses have only two choices: either dip into minimum required inventories (which damages core infrastructure) or wait for new supply. If the Strait of Hormuz remains closed until September, OECD commercial inventories could fall to what is called the "operational floor." According to Fortune, European jet fuel inventories are expected to fall below the critical 23-day supply threshold by June.
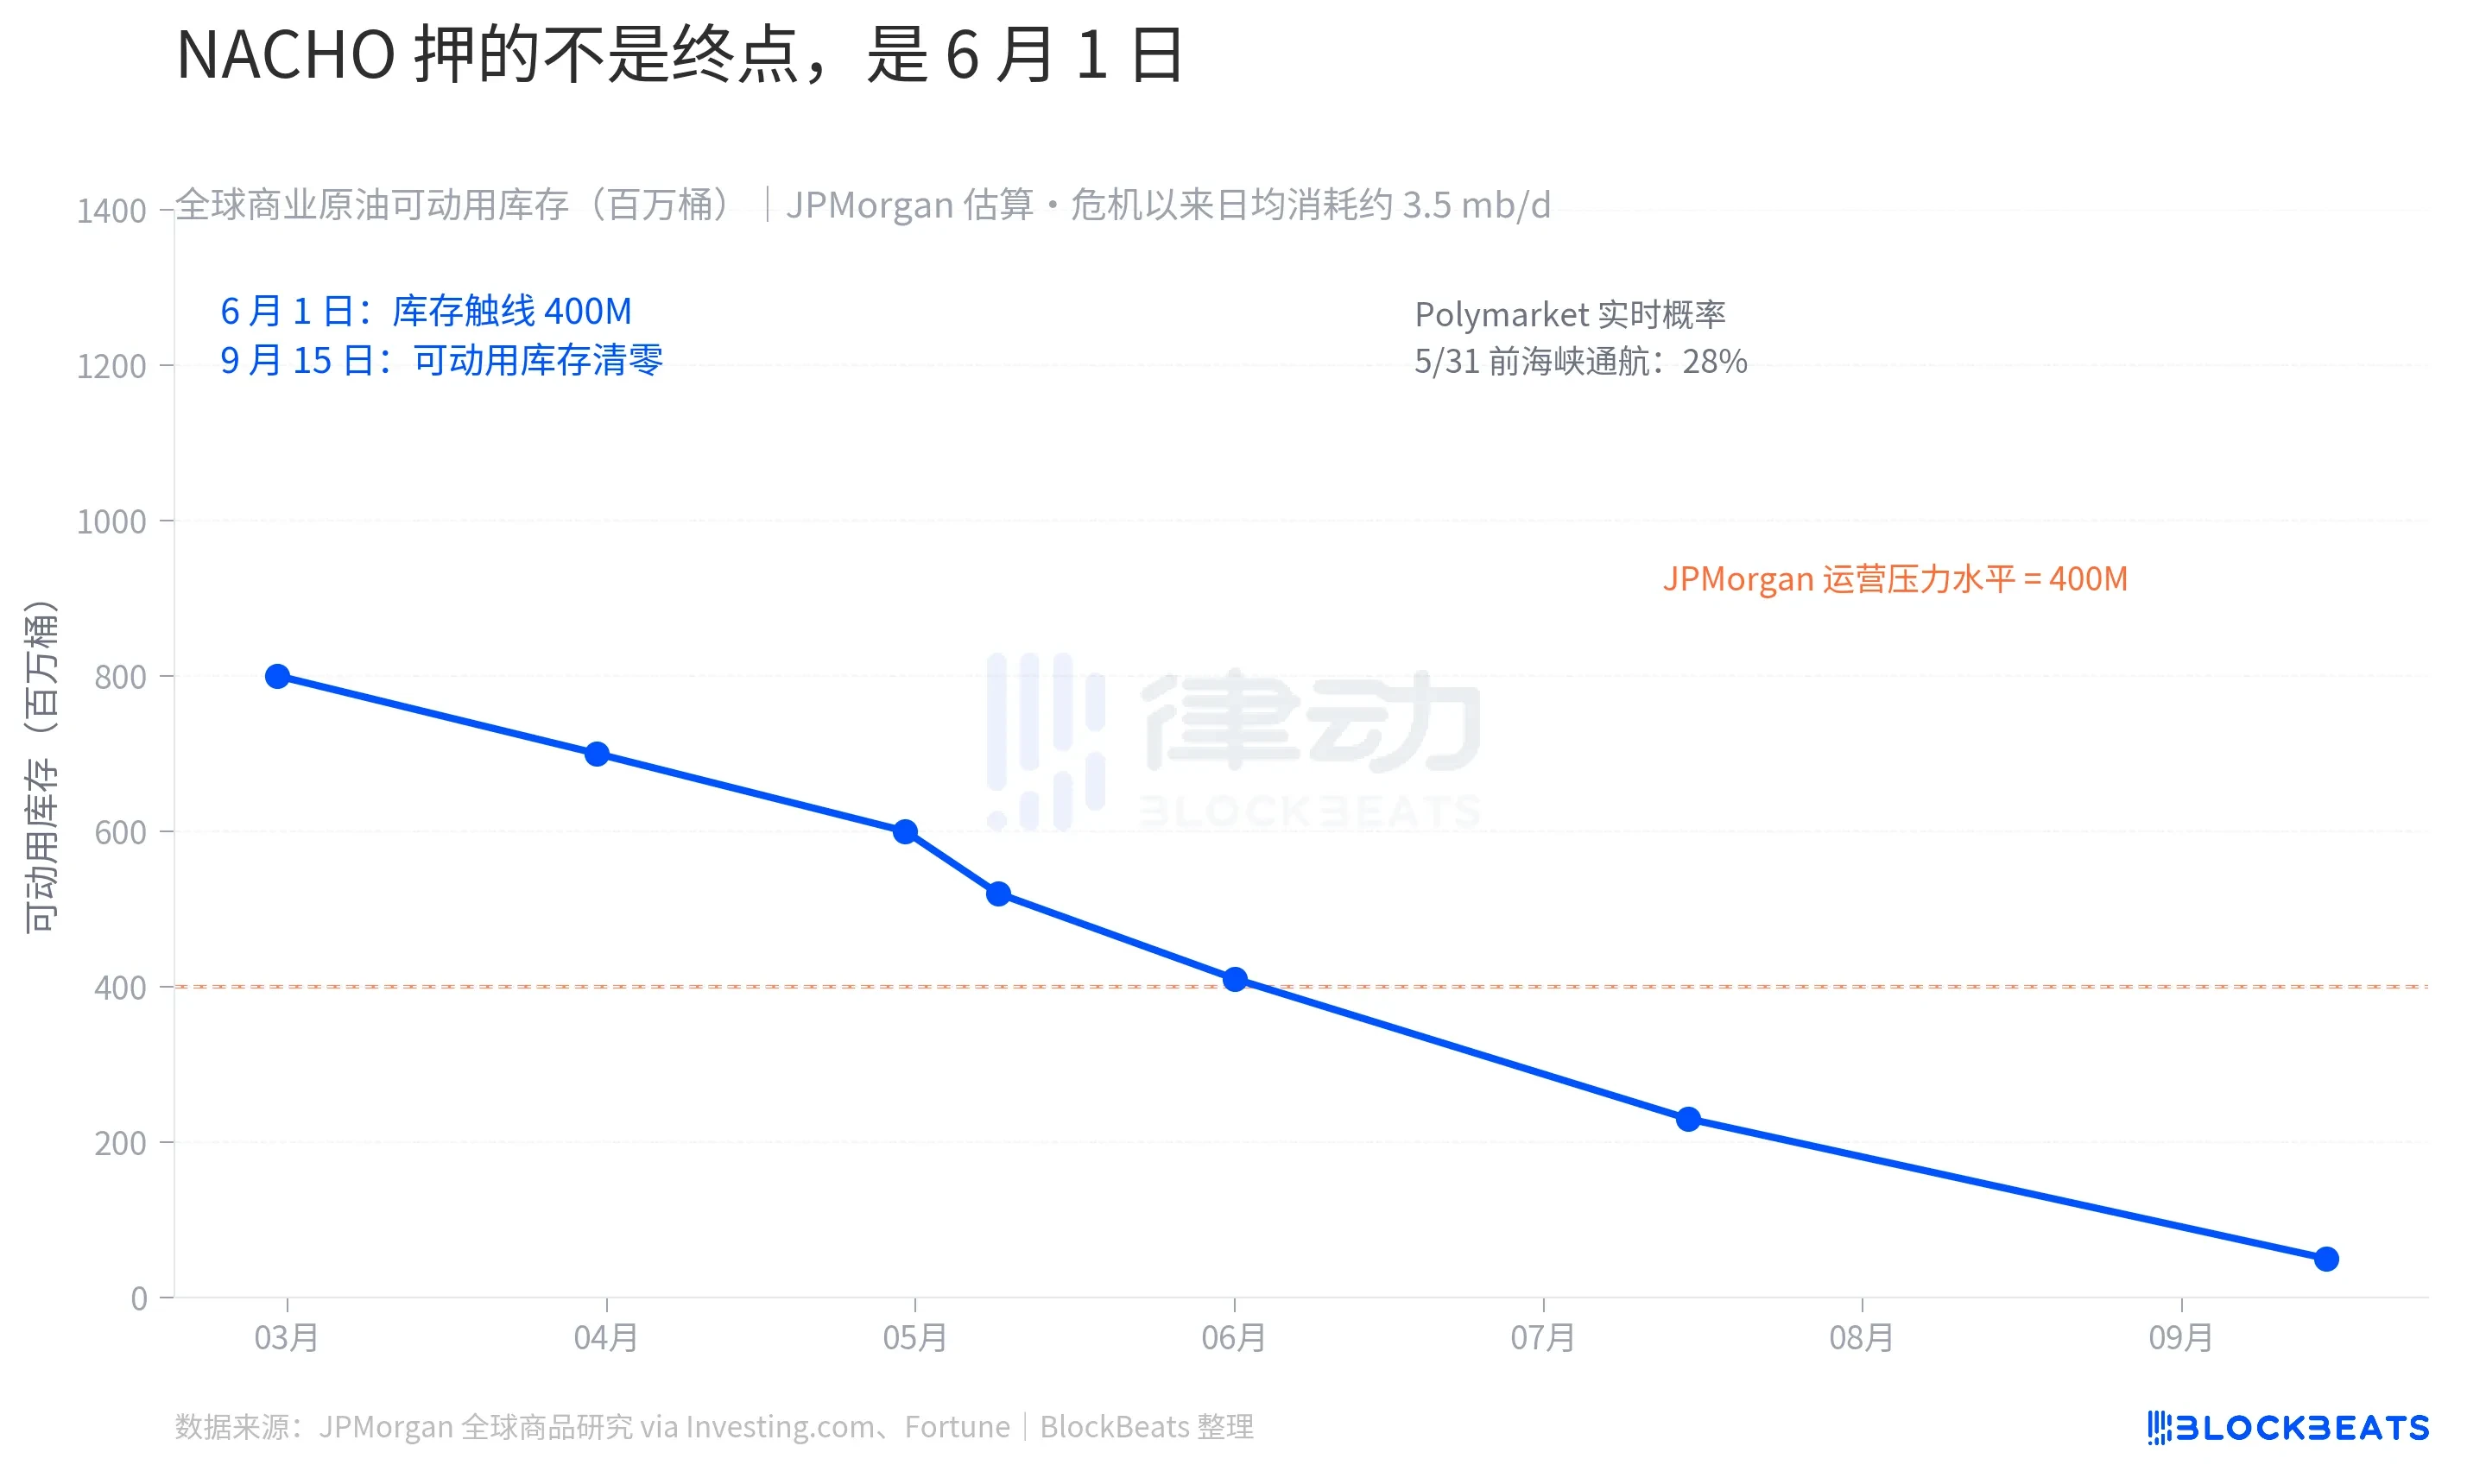
Prediction market odds are moving in lockstep with this physical clock. As of May 9, Polymarket data shows a 28% probability of "Normal navigation through the Strait of Hormuz before May 31," and just a 2% probability for before May 15. The $9.92 million in active positions on the market are betting that NACHO will hold true for at least the rest of May.
The market is no longer trading on Trump's next Truth Social post. It's now trading on early June inventory data for the Strait of Hormuz.


