
BitMart VIP Insights | April Crypto Market Review and Hotspot Analysis
- Core Thesis: In April, the crypto market underwent a structural improvement characterized by "market cap breakthroughs with volume support," driven by easing geopolitical tensions and regulatory progress. BTC achieved its strongest month of the year with a 13% gain, but faces the key resistance level of $80,000. The core variables for May are the policy signals following the transition of the Fed Chair, the legislative progress of the CLARITY Act, and DeFi security repairs.
- Key Elements:
- The April FOMC maintained interest rates unchanged, but Powell's departure and Walsh's succession introduce policy uncertainty. Walsh's first FOMC meeting on May 6-7 will be a critical juncture; any hawkish signals or a secondary uptick in inflation could suppress risk assets.
- In April, the crypto market cap rose from $2.43 trillion to $2.70 trillion (+11.5%), with an average daily trading volume of approximately $98 billion. BTC spot ETF assets exceeded $100 billion (reaching $101.2 billion), with a net monthly inflow of $8.44 billion, while ETH ETFs saw a net inflow of $1.75 billion.
- The US-Iran ceasefire was the core market catalyst. BTC rebounded from its $65,000 low to around $79,000 but failed to break the $80,000 resistance. SOL underperformed, dragged down by the Drift attack incident. The $90 resistance level and ecosystem confidence repair are worth monitoring.
- April saw frequent DeFi security incidents. Two attacks on Drift and KelpDAO resulted in combined losses exceeding $600 million, exposing systemic risks in oracles and cross-chain architectures and triggering capital outflows of approximately $13 billion.
- The CLARITY Act was marked up in the Senate Banking Committee. Polymarket predicts the probability of its passage within the year has risen above 85%. If passed in May, it would end the SEC/CFTC jurisdictional dispute and accelerate institutional capital inflows.
- The total stablecoin supply grew modestly to $288.4 billion, but with structural divergence: USDT led the expansion (+3.2%), while USDe contracted sharply by 37.7% due to declining yields, reflecting capital rebalancing between returns and risk.
- In May, key mid-to-long-term incremental drivers to watch include Asia-Pacific regulatory implementation (Hong Kong's stablecoin licensing framework), continued corporate BTC treasury expansion (MicroStrategy holdings surpass 530,000 BTC), and RWA tokenization (e.g., BlackRock's BUIDL fund).

TL;DR
- The April FOMC meeting kept rates unchanged, but the impending leadership transition introduces policy uncertainty. Inflation is ticking up due to oil price shocks, while a recovering job market supports the economy. US stocks rebounded overall amid a restoration of risk appetite. In May, markets will closely watch the new Fed Chair's policy signals, inflation trends, and oil prices. Meanwhile, crypto market momentum and legislative progress will also be key variables.
- Crypto market trading volume in April displayed a "low open, volume surge, high-level consolidation" structure. Multiple volume spikes, driven by ceasefire news, occurred alongside healthy volume during price increases. Total market cap rose from approximately $2.43 trillion to $2.70 trillion. After an early-month dip, the ceasefire catalyzed a reversal and subsequent volatile upward trend. Compared to March's pressured consolidation, April saw "market cap breakout and volume follow-through," indicating a structural improvement and a clear upward shift in market focus.
- April witnessed significant net capital inflows into both BTC and ETH spot ETFs, driving prices higher concurrently. Notably, the BTC ETF scale surpassed the $100 billion mark for the first time, signaling a new phase in institutional allocation. Overall, the market exhibited a "price-led, capital-following" characteristic, with institutional funds still clearly favoring BTC over ETH. Meanwhile, the total stablecoin supply grew modestly but with heightened structural divergence. USDT dominated the expansion while USDe saw a sharp contraction, reflecting a capital rebalancing between yield and risk.
- BTC recorded its strongest monthly performance of the year in April, staging a powerful rebound fueled by geopolitical de-escalation, but remains capped by the key $80,000 resistance level. ETH's trajectory largely mirrored BTC's, rebounding on institutional demand and upgrade expectations, but still faces a short-term test at the $2,400 resistance level. SOL followed the market recovery but performed relatively weakly, weighed down by ecosystem security incidents. Its subsequent trajectory hinges on restoring confidence and breaking through the $90 resistance.
- The US-Iran ceasefire alleviated geopolitical risks and spurred a strong BTC rebound. April saw approximately 13% gains, driving a significant return of overall crypto market cap and ETF capital. Concurrently, attacks on Drift and KelpDAO resulted in over $600 million in DeFi losses and triggered a large-scale capital exodus, exposing systemic risks in oracle and cross-chain architectures. On the policy front, the CLARITY Act achieved key progress, notably boosting its passage probability for the year, signaling an accelerating regulatory framework for the crypto market.
- May's market core lies with Warsh's first FOMC meeting and ensuing policy signal changes, compounded by inflation and oil price trends. These will directly impact whether risk assets and BTC can sustain their strength. Meanwhile, the CLARITY Act moves to a full Senate vote; if passed, it could significantly drive institutional capital inflows and reshape the crypto regulatory landscape. Asia-Pacific regulatory progress, corporate BTC reserves, and accelerating RWA tokenization collectively constitute important drivers for medium-to-long-term capital inflows and industry development.
1. Macro Perspective
Policy Direction
The FOMC held its third policy meeting of the year on April 28-29, with the market expecting the federal funds rate target to remain unchanged in the 3.50%–3.75% range. As no dot plot update was scheduled for this meeting, every nuance of the statement is subject to intense market scrutiny. This was also Chairman Jerome Powell's last FOMC meeting; his term officially ends on May 15. Nominee successor Kevin Warsh completed his Senate Banking Committee hearing on April 21. On April 26, the last key opposing Senator, Tillis, withdrew his objection, sending the confirmation vote to its final procedural stages. The market is closely watching whether Powell will provide forward guidance on the policy path at his final press conference, and whether a shift in monetary policy signals will emerge once Warsh takes over. Overall, the April FOMC offered no policy surprises on the "status quo" front, but the uncertainty premium introduced by the personnel transition will extend into May.
US Stock Market Trends
US stocks showed an overall pattern of initial decline followed by recovery, driven primarily by geopolitical easing. Continuing late March pressures from high oil prices and inflation concerns, the S&P 500 consolidated under pressure. The US-Iran ceasefire agreement on April 8 led to partial resumption of shipping in the Strait of Hormuz, rapidly boosting market risk appetite. The tech sector and consumer discretionary stocks led the rally, with the S&P 500 rebounding sharply within days of the ceasefire. A sharp rise in March CPI to 3.3% on April 10 triggered a brief pullback, but the market quickly digested this, characterizing it as a supply-side shock rather than demand-side inflation. The Q1 earnings season became the core driver in mid-to-late April. The S&P 500 logged positive returns for four consecutive weeks, hitting a new cyclical high on April 24. Major tech companies generally reported better-than-expected earnings, and the continued expansion of AI capital expenditure further boosted sentiment. Overall, the S&P 500 posted a positive monthly return in April. The VIX volatility index fell from a monthly high of 31.65 at the start of the month to around 18.5 by month-end, indicating a marked improvement in market sentiment.
Inflation Data
The US Bureau of Labor Statistics released the March 2026 CPI data on April 10: CPI rose 3.3% year-over-year, a significant increase of 0.9 percentage points from February's 2.4%. The monthly increase was +0.9%, the largest monthly gain since 2022. Core CPI (excluding food and energy) rose 0.2% month-over-month and was roughly 2.6% year-over-year, relatively moderate. The main driver of the inflation jump was the surge in energy prices due to the US-Iran war. Gasoline prices alone rose 21.2% in March, the largest monthly increase since 1967, significantly boosting the overall energy component. Pass-through effects from tariffs also began to show in imported goods categories. The prevailing market interpretation is that this is a supply-side shock rather than demand-side inflation. Because core CPI appears relatively controlled, the Fed is unlikely to change its policy path. However, if the US-Iran conflict persists, keeping oil prices elevated, the risk of secondary pass-through to core inflation components cannot be ignored.
Employment Data
The US Department of Labor released the March 2026 nonfarm payrolls report on April 3: Nonfarm payrolls increased by 178,000, significantly exceeding market expectations of 59,000. This marked a substantial turnaround from February's revised decline of -133,000 (initially reported as -92,000). The unemployment rate edged down to 4.3% from 4.4%, while the labor force participation rate dipped slightly to 61.9%. Key contributors to the job market recovery included the healthcare sector (+76,000, mainly due to healthcare workers returning after strikes ended), construction, and transportation/warehousing. Average hourly earnings rose 3.5% year-over-year and +0.2% month-over-month, indicating moderate wage inflation. Overall, the March employment data alleviated market concerns about a rapid deterioration in the labor market, providing new support for the "soft landing" narrative and somewhat easing the pressure on the FOMC to cut rates quickly. However, the decline in the labor force participation rate suggests that some improvement in employment stems from workers leaving the workforce, leaving the underlying resilience of the job market open for further observation.
Political Factors
Political factors influencing crypto and macro market sentiment were centered around the US-Iran geopolitical situation. On April 8, the US and Iran announced a temporary ceasefire brokered by Pakistan. Shipping through the Strait of Hormuz gradually resumed partial operations. Brent crude oil fell sharply from its peak near $120/barrel since the war began, with WTI dropping over 16% on the day of the ceasefire. However, the reprieve was short-lived. Ceasefire negotiations progressed slowly. Iran's Foreign Minister reiterated a hardline stance in late April, causing Brent crude to rise back to the $107-108/barrel range on April 26-27. The fragility of the ceasefire continues to pose a tail risk, with markets worried that if the Strait of Hormuz remains disrupted through the end of June, Brent could potentially hit $150. In the crypto sphere, the CLARITY Act passed the markup stage in the Senate Banking Committee just before the April 25 deadline. A substantive divide was resolved through the Tillis-Alsobrooks compromise on stablecoin yields, significantly boosting expectations for legislative passage by month-end. The uncertainty arising from the monetary policy transition period, with Powell set to leave and Warsh to take over, became an important new variable for the market to watch at the end of April. Overall, the ceasefire was the most significant positive catalyst, while the rebound in oil prices and uncertainty during the policy transition were the main negative variables.
Next Month Outlook
Looking ahead to May, Kevin Warsh will chair his first FOMC meeting as Fed Chair on May 6-7 (Powell officially steps down on May 15). The market will be highly sensitive to interpreting the statement's language and Warsh's policy signals at the press conference. Any clear deviation from Powell's phrasing could trigger significant volatility in risk assets. April CPI and PCE data will be released in May. The key observation point will be whether the March oil price shock causes a secondary uptick in core inflation. If core components remain moderate (month-over-month ≤ 0.2%), rate cut expectations are likely to stabilize. After clearing the Senate Banking Committee markup in April, the CLARITY Act will move into the preparation phase for a full Senate vote in May. Senator Moreno's set deadline for passage by the end of May makes the legislative timeline highly compressed. For crypto assets, whether BTC can achieve a valid breakout above the key $80,000 level and whether ETF inflows can remain positive will be crucial indicators for determining if April's bullish momentum can extend into May. The direction of US-Iran talks and whether oil prices can fall back below $100 will be the core macro variables determining whether risk appetite can expand further.
2. Crypto Market Overview
Token Data Analysis
Trading Volume & Daily Growth Rate
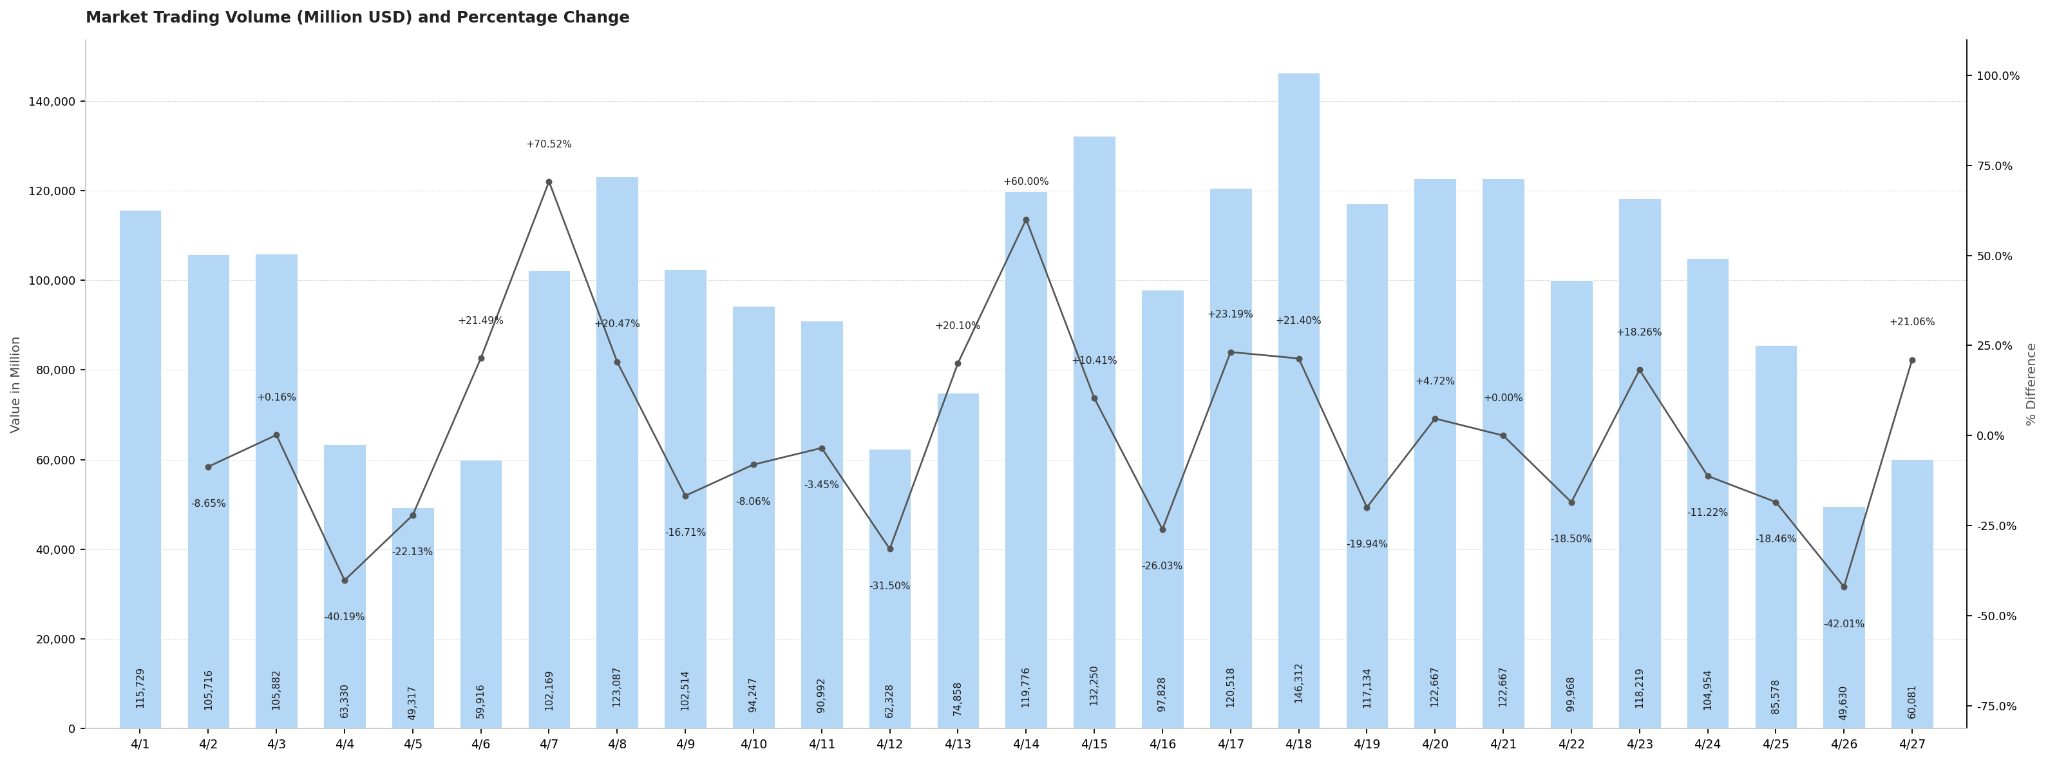
The overall average daily trading volume in the crypto market for April was approximately $98 billion, displaying a "low open, volume surge, high-level consolidation" fluctuation structure. Trading volume started the month at around $115.7 billion on April 1, then dropped due to weekend effects, hitting monthly lows on April 4-5 (approximately $63.3 billion and $49.3 billion, respectively). Volume recovered quickly upon entering the work week, surging 70.52% day-over-day to about $102.2 billion on April 7. The news of the US-Iran ceasefire on April 8 further drove volume to approximately $123.1 billion, with market sentiment warming significantly. As the market continued its upward trend on April 14-15, volume remained high for two consecutive days (approximately $119.8 billion and $132.3 billion). Volume peaked for the month on April 18 at approximately $146.3 billion, making it the most active trading day. This coincided with the crypto market cap hitting a new stage high, exhibiting a significant price-volume resonance. At month-end, volume dropped again due to the weekend on April 25-26 (approximately $85.6 billion and $49.6 billion), then recovered slightly to $60.1 billion on April 27 to close the month. Overall, weekday trading volume generally stayed in the $90-$130 billion range, while weekends saw a regular contraction to $50-$65 billion. Market activity showed a phased upward trend alongside price increases, with a healthy volume structure.
Total Market Cap & Daily Change
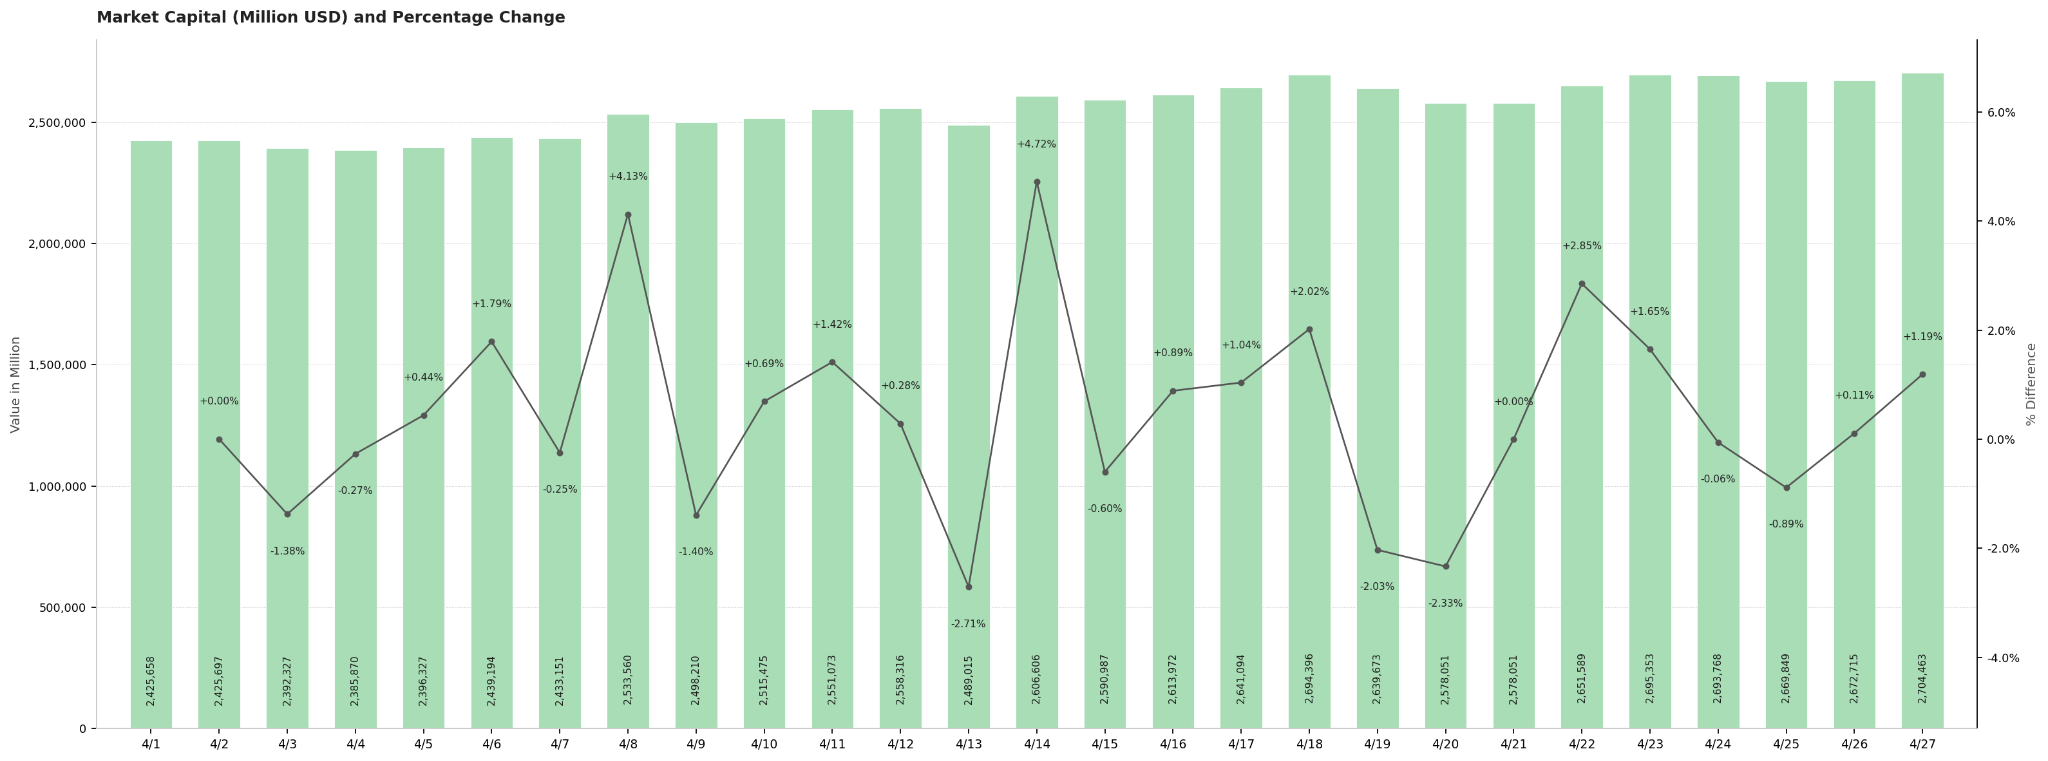
The total crypto market cap in April steadily increased from approximately $2.43 trillion at the start of the month to about $2.70 trillion by month's end, an intra-month gain of roughly 11.5%. The monthly trajectory shows a clear three-stage structure: "initial decline and bottom-finding, reversal on ceasefire news, volatile upward trend." From the beginning of the month to April 5, dragged by high oil prices and inflation pressures, the market cap slightly declined to about $2.39 trillion (the monthly low). The US-Iran ceasefire agreement on April 8 became the most important turning point for the month, with market cap surging 4.12% day-over-day, breaking through the $2.53 trillion mark, signaling a substantial repair in market risk appetite. Subsequently, the market cap entered a volatile upward channel. Driven by sustained capital inflows on April 14, it rose another 4.73% day-over-day, reaching a stage high of about $2.69 trillion on April 18. Towards the end of the month, on April 22-23, the market cap strengthened further to around $2.70 trillion, closing the last trading day of April at $2.70 trillion, the highest closing point for the month. It's noteworthy that the largest single-day correction for the month occurred on April 13 (-2.72%), corresponding to short-term panic following the KelpDAO security incident. However, the market quickly digested this and continued its upward trajectory, demonstrating the resilience and dominant position of bullish forces in this cycle.
Comparison with March Data
Compared to March, the crypto market in April showed clear improvement in both market cap and trading volume. In terms of market cap, March was suppressed by hawkish FOMC signals and high oil prices, with the total market cap oscillating broadly in the $2.3 trillion to $2.6 trillion range without achieving a valid breakout. In contrast, April saw a structural uplift catalyzed by the US-Iran ceasefire, steadily climbing from $2.43 trillion to $2.70 trillion, an intra-month gain of about 11.5%. The upper boundary of the range expanded by approximately $100 billion compared to March, with the market's center of gravity shifting northward. Regarding trading volume, March's average daily volume was around $80 to $100 billion, indicating low activity and cautious capital sentiment. April's average daily volume remained around $98 billion, roughly in line with March's average. However, April featured multiple high-activity days where single-day volume spiked above $120 billion (April 8, 14-15, 18). Notably, the peak on April 18 was approximately $146.3 billion, far exceeding any single day in March, demonstrating a price-volume resonance structure that amplified concurrently with the price increase. Overall, March was a consolidation pattern characterized by "pressure on market cap and shrinking volume," while April achieved a structural shift with "market cap breakout and volume follow-through," presenting a stark contrast between the two months.
Hot Tokens in April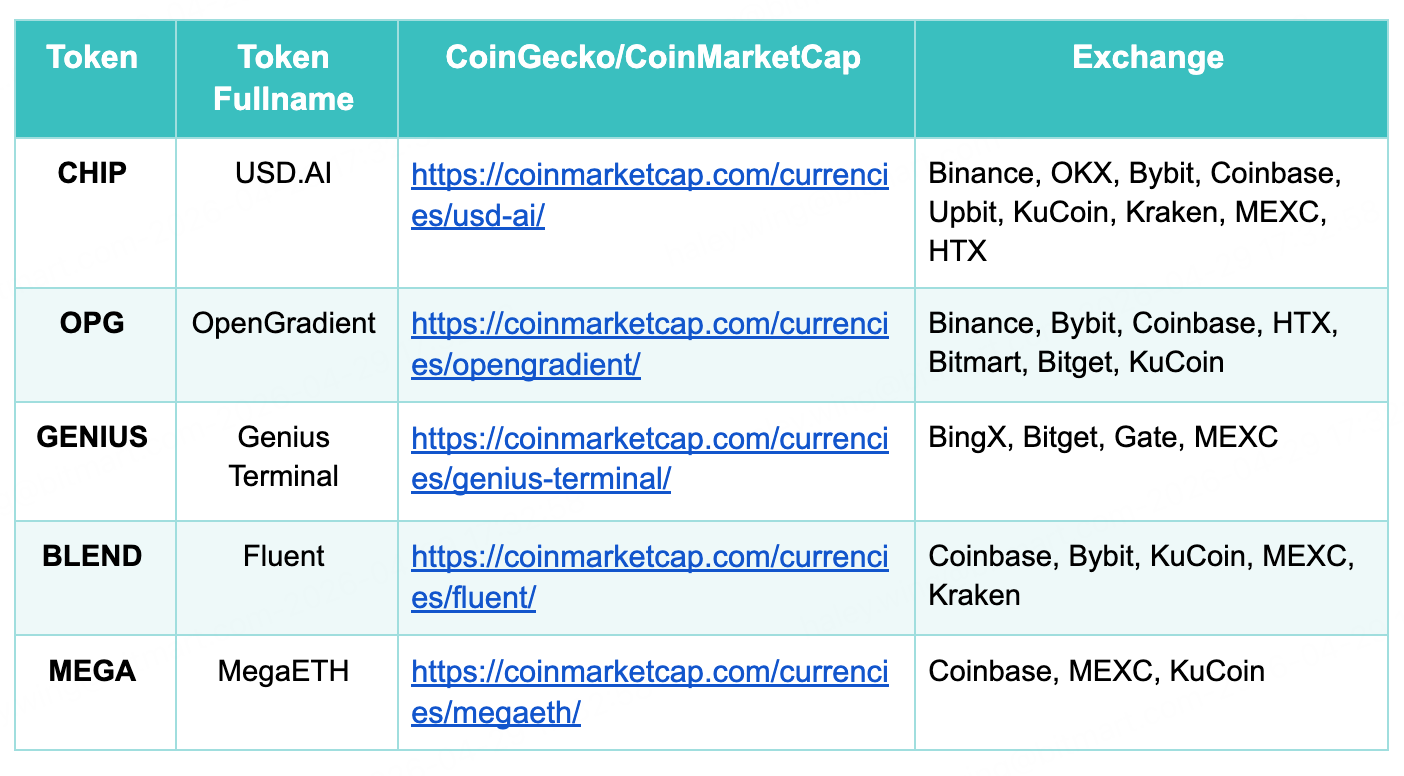
In April 2026, the crypto market witnessed the launch of several highly anticipated new tokens, all with strong performances. In terms of launch scale, CHIP (USD.AI) and OPG (OpenGradient) recorded first-day trading volumes exceeding $1.4 billion and $1 billion, respectively, marking the peak of new token liquidity for April and showing simultaneous inflows from institutional and retail capital. GENIUS (Genius Terminal) was the first to open on April 13. Backed by a multi-hundred-million-dollar investment from YZi Labs and the market effect of CZ serving as an advisor, its price surged over 65-fold on the first day, with a 24-hour trading volume of $1.1 billion, generating hype on par with the top two projects.
Analyzing the sector distribution, the three top projects respectively covered AI lending infrastructure (CHIP), decentralized AI inference networks (OPG), and on-chain trading terminals (GENIUS), all strongly aligning with the AI narrative and confirming the market's sustained enthusiasm for the AI+Web3 direction. BLEND (Fluent Network) and MEGA (MegaETH), as new Ethereum Layer 2 projects, conducted their TGEs on April 24 and April 30, respectively, with relatively more moderate trading volumes. However, Coinbase's backing provided them with strong compliance credibility. Overall, the hotspots for new tokens in April were concentrated on two main themes: AI infrastructure and Ethereum scaling. Top projects enjoyed ample first-day liquidity and broad exchange coverage, reflecting the market's continued strong capacity to absorb high-quality new projects.
3. On-Chain Data Analysis
BTC and ETH ETF Inflow/Outflow Analysis
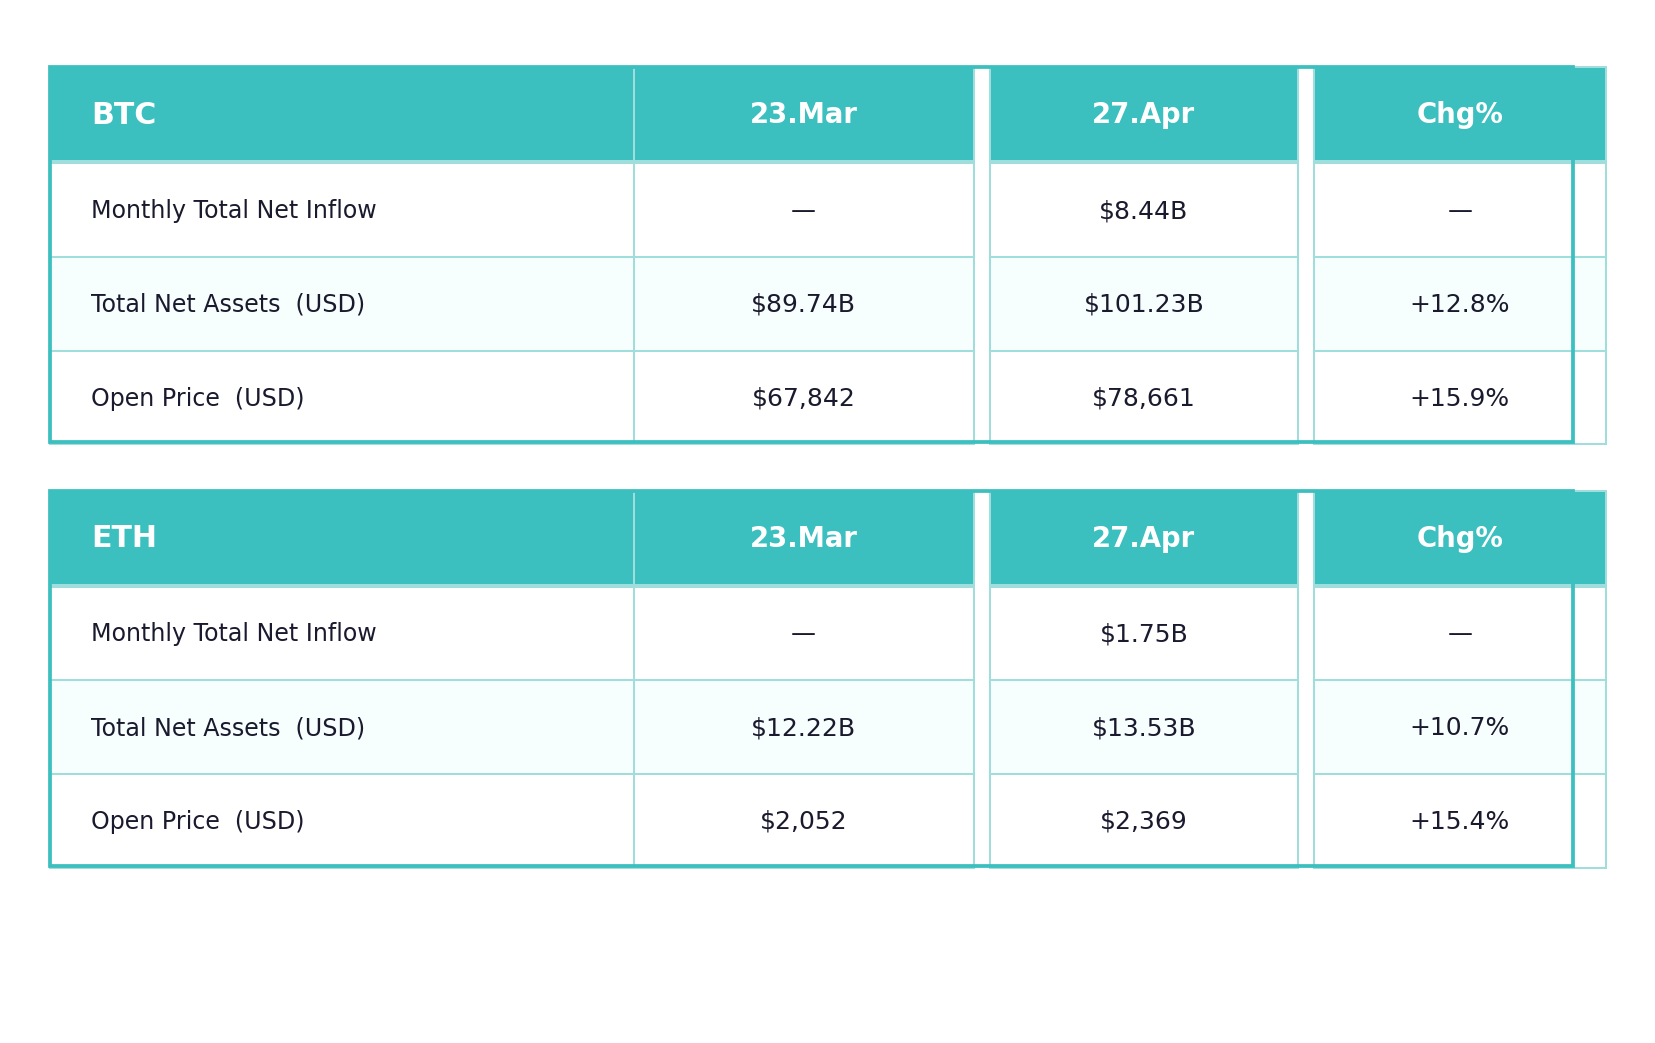
In April, both BTC and ETH spot ETFs continued their net capital inflow trend, with institutional allocation appetite recovering significantly. BTC spot ETFs saw a total monthly net inflow of $8.44 billion, driving total net assets from $89.9 billion at the end of March to $101.2 billion, a month-over-month increase of 12.8%. This marked the first time the figure surpassed the $100 billion mark, hitting an all-time high. Concurrently, BTC's opening price rose from $67,842 to $78,661, a monthly gain of 15.9%, its strongest monthly performance in the past year. ETH spot ETFs also recorded a net inflow of $1.75 billion for the month. Total net assets rose from $12.2 billion to $13.5 billion (+10.7%). ETH's price increased from $2,052 to $2,369 (+15.4%), with gains


