
Bitcoin Mean Reversion, but $80K Resistance and Profit-Taking Could Be Bottlenecks
- Core Thesis: Bitcoin has broken through its real market average of $78.1K, now faces strong resistance at the short-term holder cost basis of $80.1K. A surge in profit-taking coupled with low volatility warrants caution; an upward move depends on sustained spot demand and ETF inflows.
- Key Elements:
- Bitcoin has surpassed the real market average of $78.1K, a key signal for a market transitioning from bearish to constructive. However, the next significant resistance lies at the short-term holder cost basis of $80.1K.
- The proportion of profitable supply among short-term holders has reached the historical threshold of 54%, which typically coincides with the exhaustion of selling pressure during bear market rallies. This is only the second time in the current cycle that market structure has exhibited a similar pattern.
- Realized profits among short-term holders have surged to $4.4 million per hour, nearly three times the local top threshold of $1.5 million seen in the first two instances this year, signaling immense profit-taking pressure.
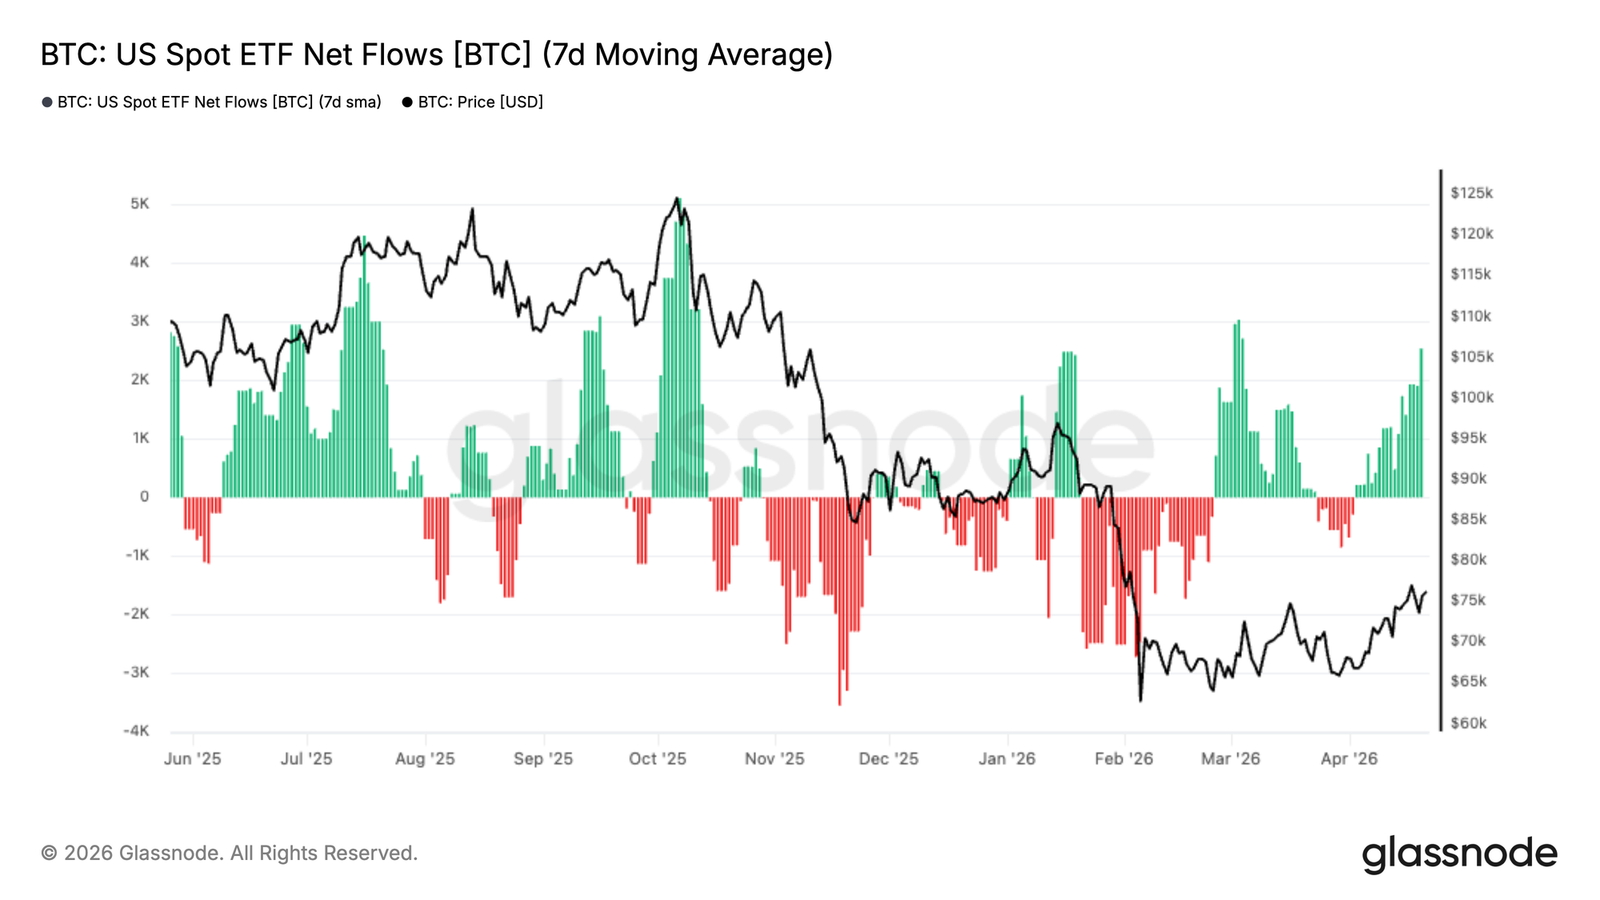
- The 7-day moving average of US spot ETF flows has turned positive again, indicating an initial return of institutional demand after a prolonged period of outflows, though inflow volumes remain below the peaks seen in late 2025.
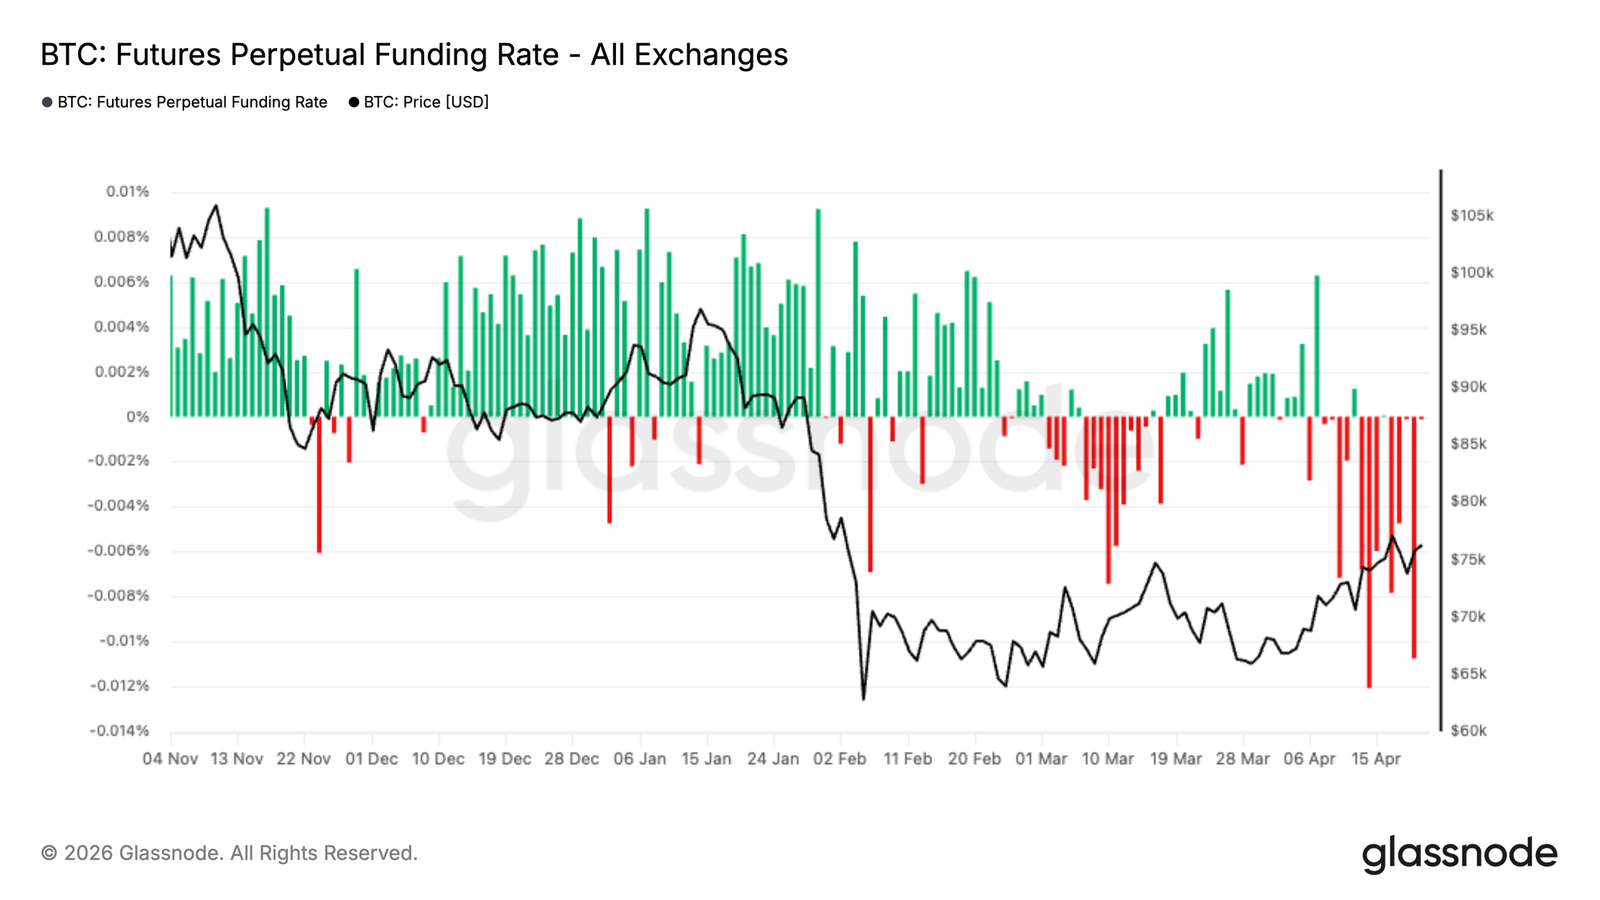
- Perpetual swap funding rates remain persistently negative, suggesting crowded short positions in the market. If spot demand strengthens, this could serve as fuel for upward momentum.
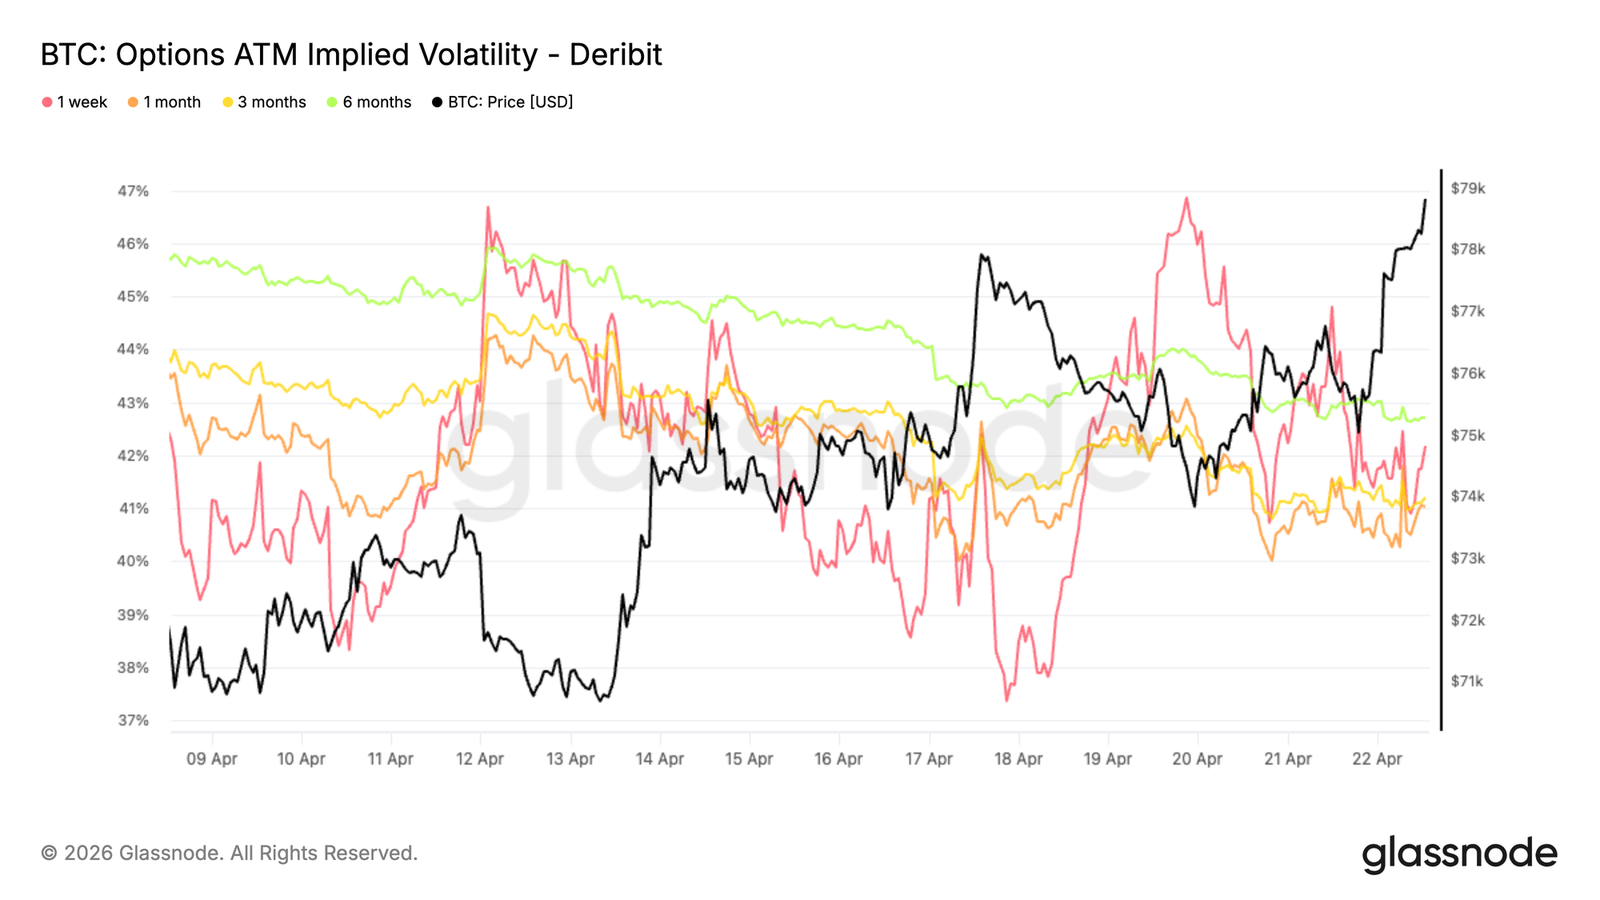
- The volatility market is soft, with implied and realized volatility continuing to decline and options pricing showing no premium. Skew indicates short-term adjustments, but the far end is still buying downside protection.
- Gamma data reveals mechanical resistance near the $80K level, while a pullback to the $75K zone faces the risk of accelerated downside driven by market maker hedging.
Original Author: Glassnode
Original Translation: AididiaoJP, Foresight News
Bitcoin has returned to $78,000, accompanied by a resurgence in spot demand and ETF inflows. Short positions have increased, funding rates are negative, and there is potential for a short squeeze. However, high realized profits and soft volatility suggest caution is warranted, with resistance above the $80,000 mark.
Summary
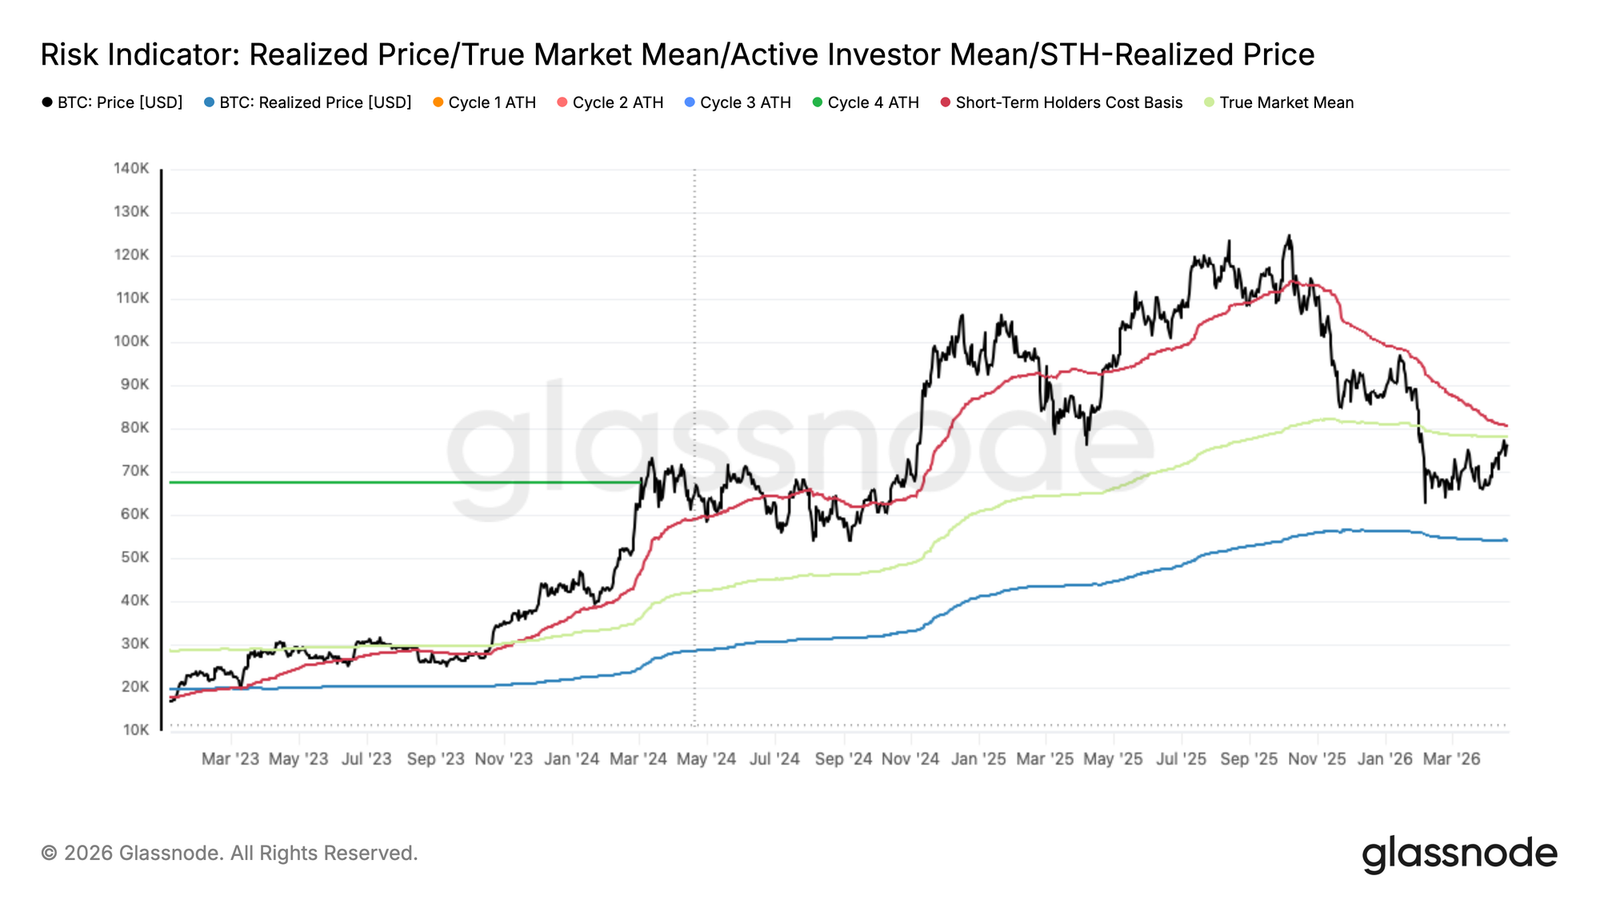
Bitcoin has broken through the True Market Mean of $78,100, marking its first significant mean reversion since mid-January. The Short-Term Holder Cost Basis is currently at $80,100, acting as immediate overhead resistance.
A rally to $80,000 would push over 54% of recent buyers into profit, a threshold that historically signals the exhaustion of selling pressure during bear market rallies. This is the second time such a structure has appeared in this cycle.
Short-term holder realized profits have surged to $4.4 million per hour, nearly three times the $1.5 million threshold that has marked every local top so far this year. Caution is warranted in the absence of a meaningful demand catalyst.
ETF flows have turned mildly positive again, with the 7-day moving average re-entering inflow territory, indicating an initial return of institutional demand after a prolonged period of outflows.
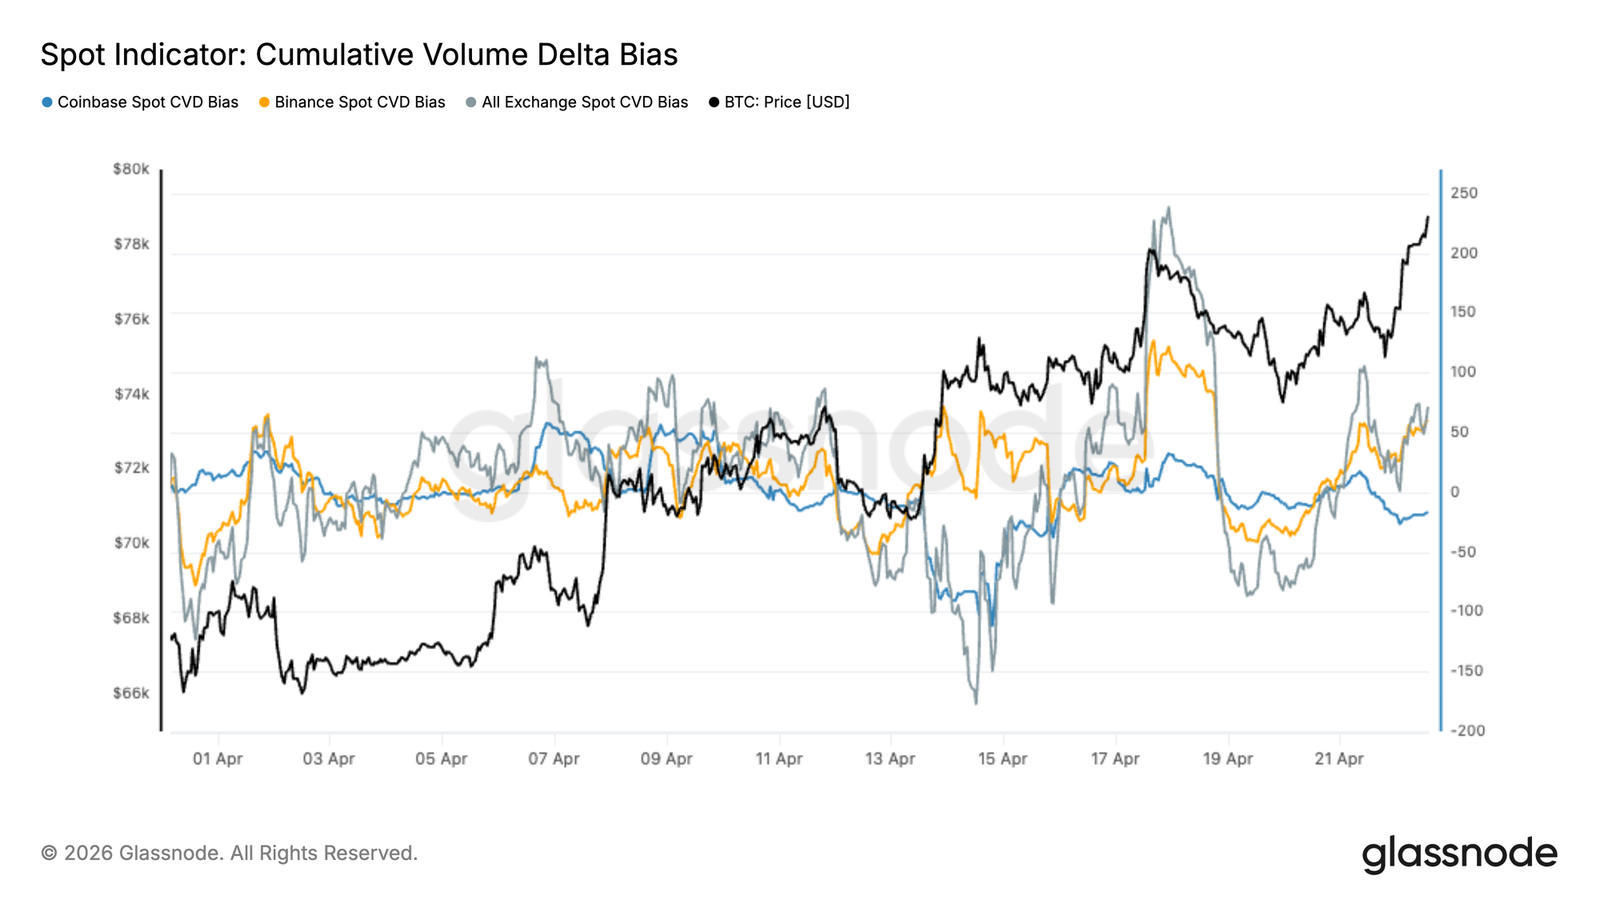
Spot demand is showing early signs of recovery, with the cumulative volume delta turning positive, suggesting increased buyer aggression, particularly in offshore venues.
Perpetual contract funding rates remain negative, reflecting a market increasingly biased towards short positions, which could serve as fuel for an upside move if spot demand continues to strengthen.
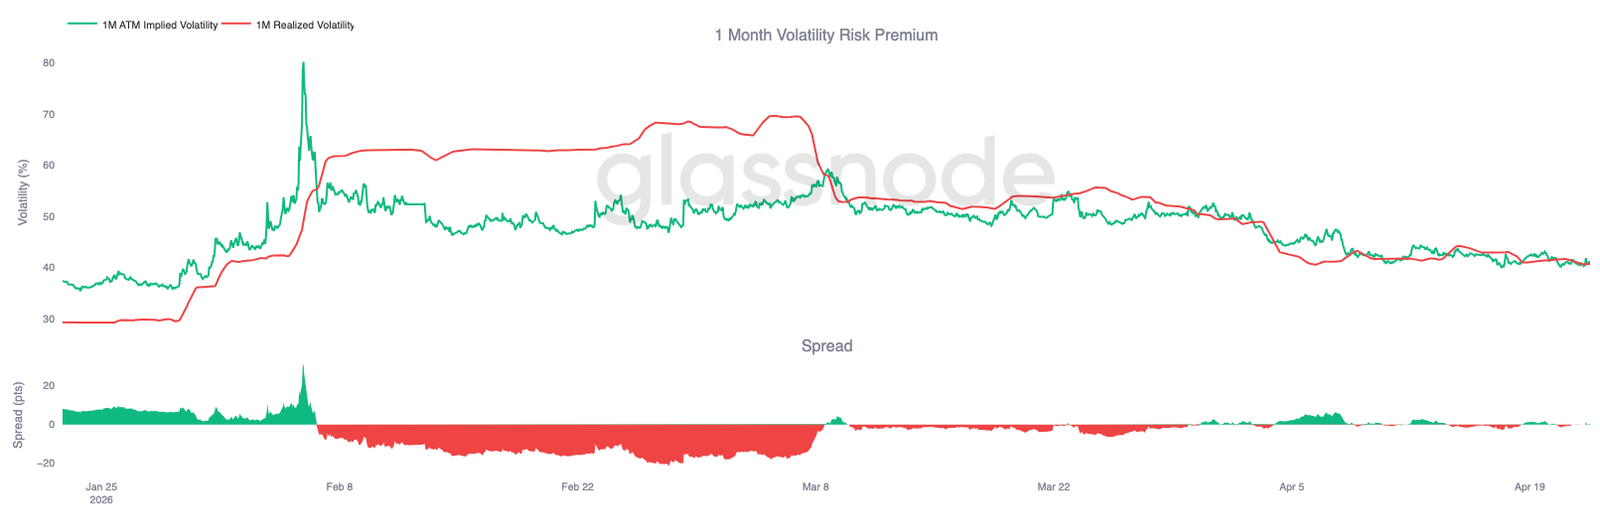
Volatility remains under pressure. Implied volatility continues to decline, realized volatility confirms the compression, and there is no premium priced into options.
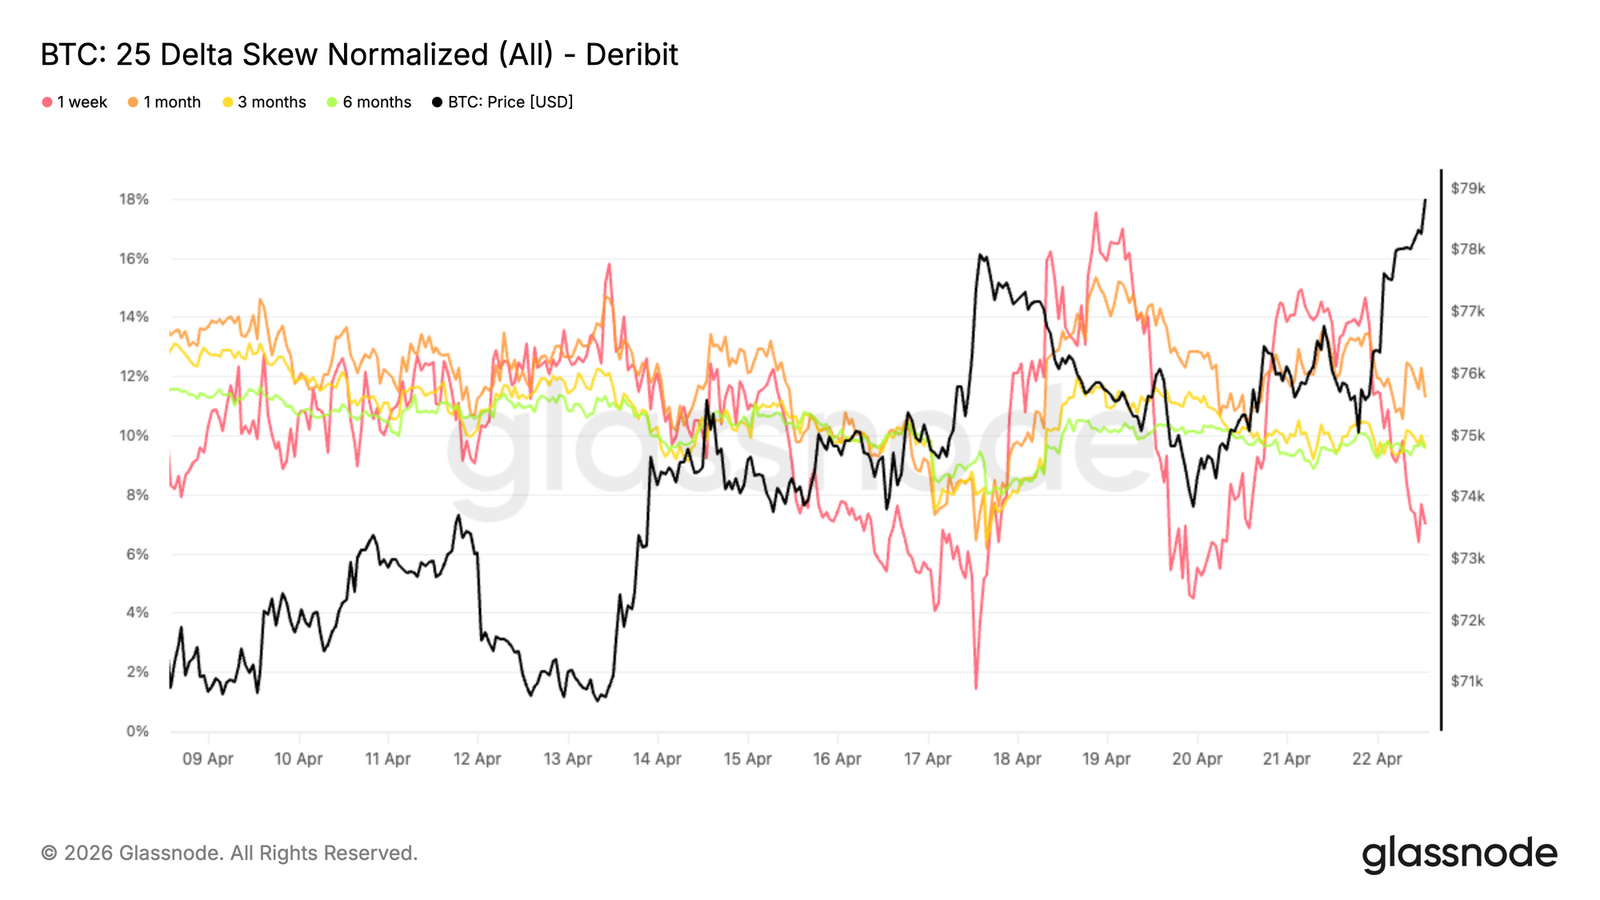
Skew shows short-term positioning adjustments, but downside protection further out continues to be firmly bought.
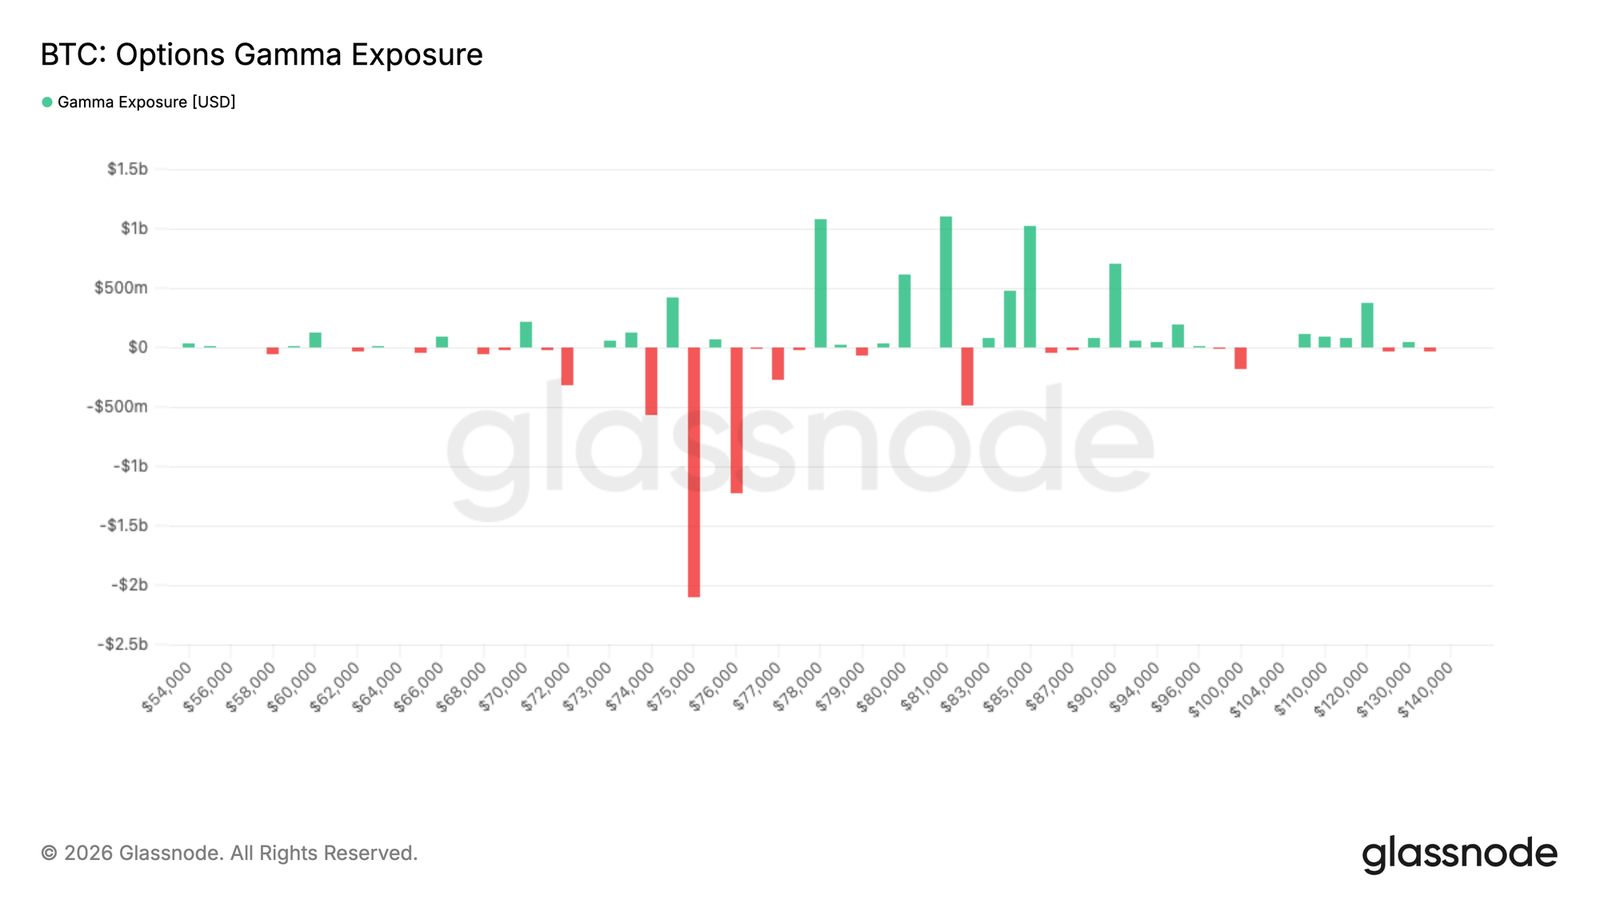
Gamma and flows outline the current landscape: mechanical resistance near $80,000 on the upside, while a pullback to $75,000 faces higher downside acceleration risk.
On-Chain Insights
Breaking Above, But Not Yet Clear
Last week, this report identified the True Market Mean of $78,100 as a short-term resistance zone, anticipating selling pressure from underwater investors would cap any rally. Bitcoin has since broken above this level, a development with significant cyclical implications.
The True Market Mean tracks the cost basis of actively traded supply. Historically, reclaiming this model marks a transition from deep bear market conditions to a more constructive market environment. This breakout represents a significant mean reversion within the current bear market, with the next logical target being the Short-Term Holder Cost Basis of $80,500.
However, selling pressure from investors who accumulated in the $60,000-$70,000 range is beginning to impact momentum, as this cohort approaches break-even and faces the behavioral incentive to exit. This dynamic increases the probability of a local top forming in the near term, warranting caution despite the constructive nature of breaking the True Market Mean.
The Next Wall: Short-Term Holder Cost Basis
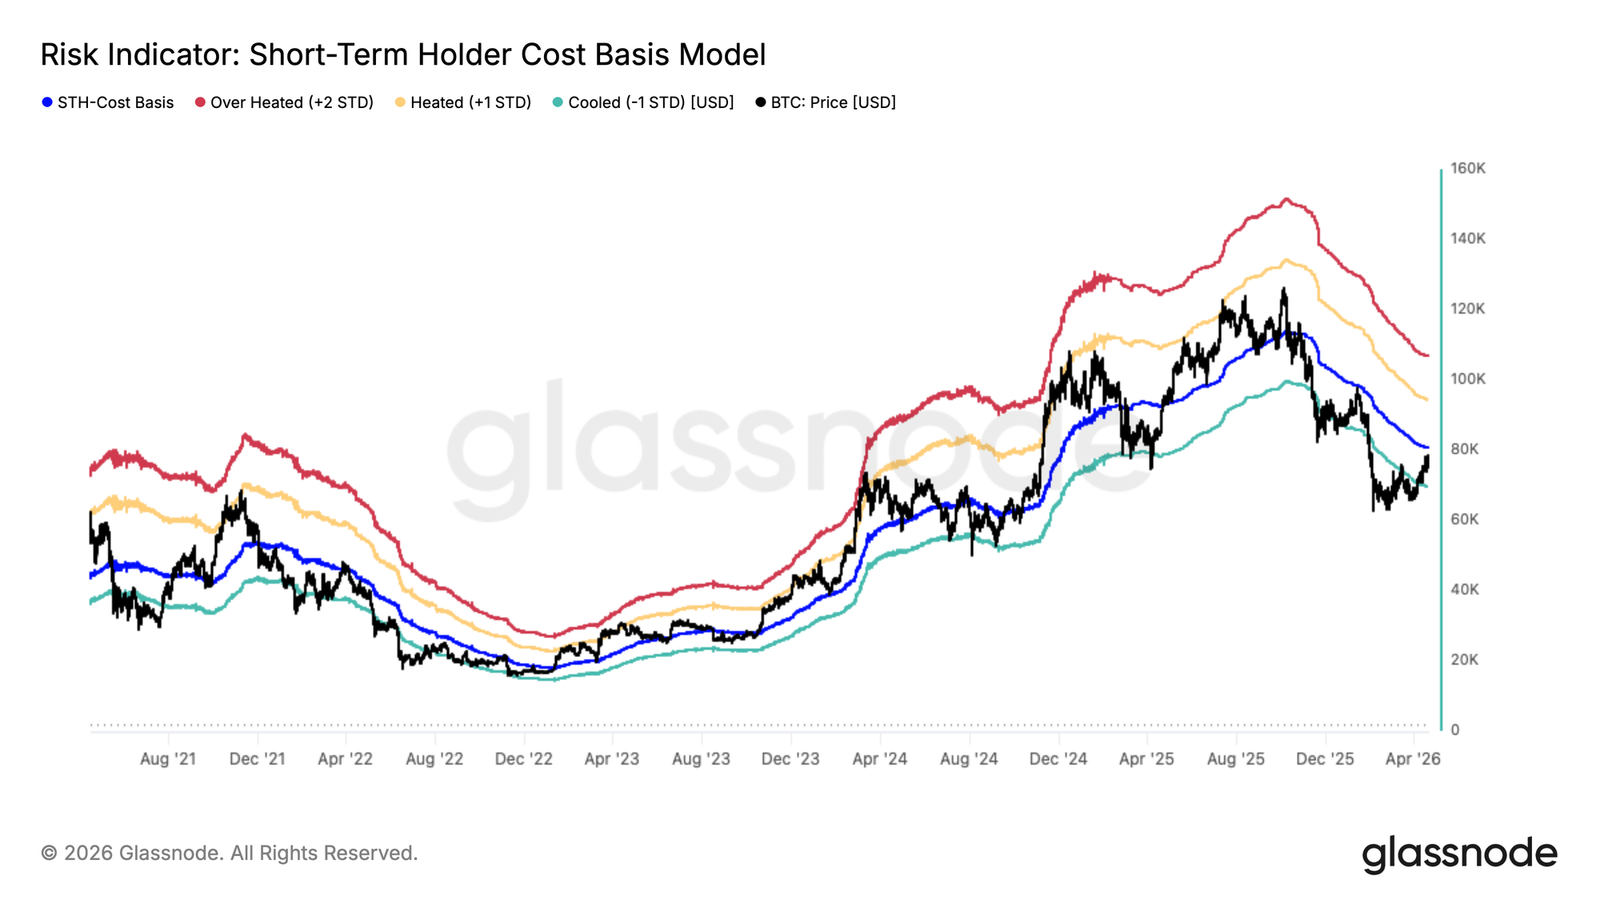
Having broken the True Market Mean, the market now faces a more severe test. The Short-Term Holder Cost Basis of $80,100 represents the average purchase price of buyers over the past 155 days, a group historically proven to be the most price-sensitive in the market.
As prices approach their break-even point, the behavioral incentive to exit strengthens, making this zone a natural source of selling pressure. In bear markets, rallies towards the Short-Term Holder Cost Basis often require multiple attempts to resolve, with prices retreating towards the -1 standard deviation level (~$69,900) between attempts. This pattern suggests the $78,000-$80,100 range constitutes significant short-term resistance, while $70,000 is increasingly developing as a mid-term support floor.
Where Bear Market Rallies Exhaust
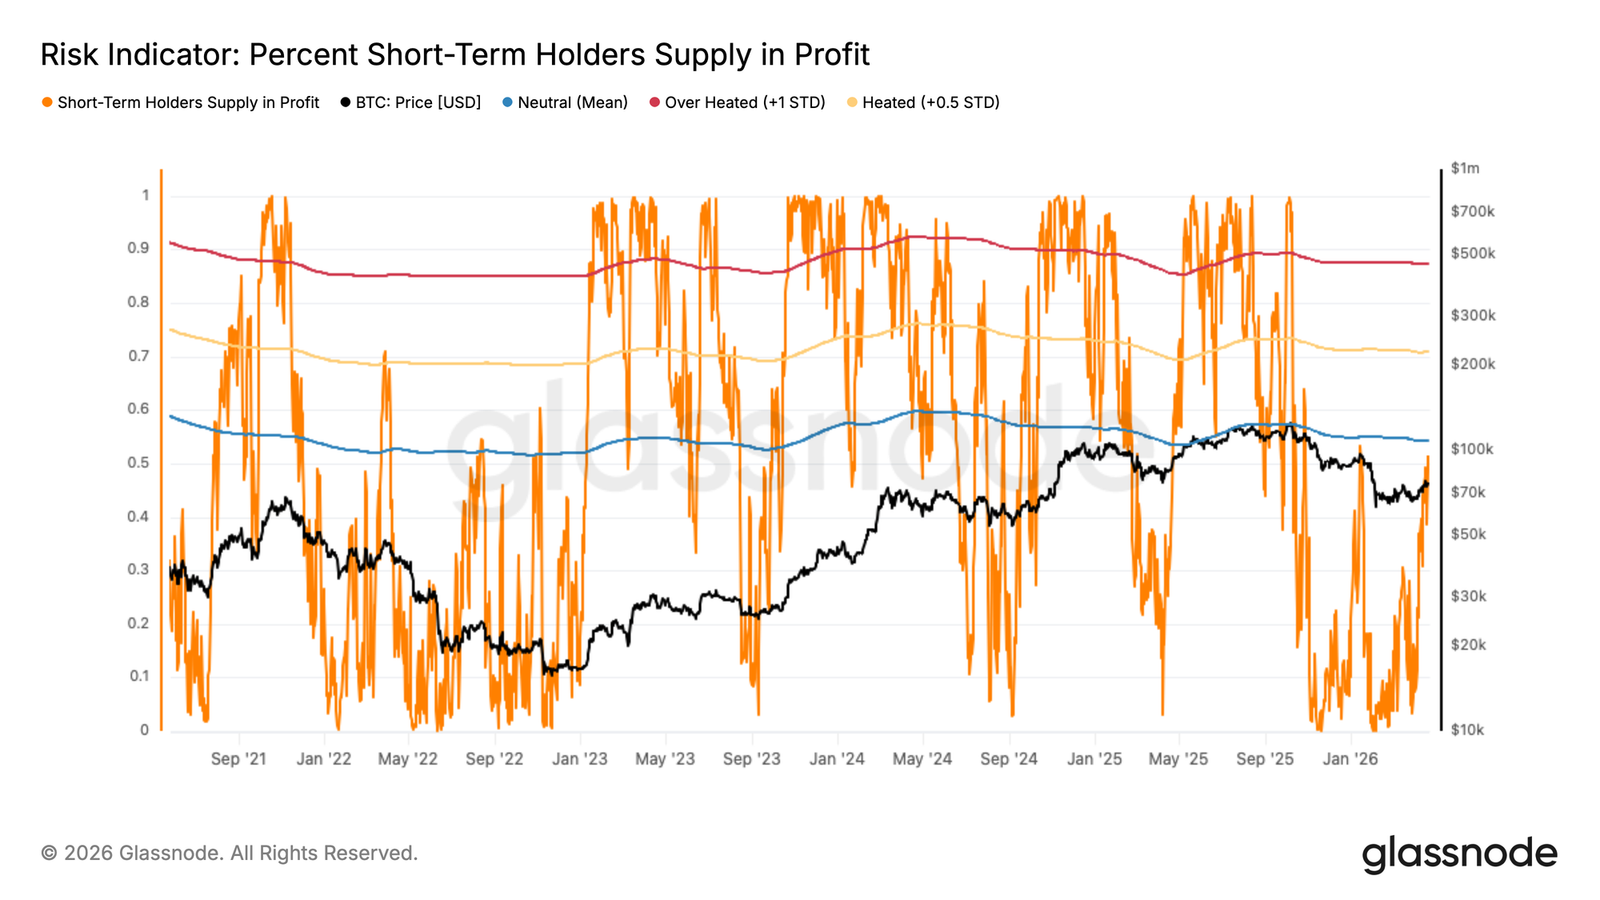
With the Short-Term Holder Cost Basis of $80,100 acting as immediate overhead resistance, the Percent of Short-Term Holder Supply in Profit offers a complementary perspective, precisely explaining why this level holds such significant behavioral importance. This metric measures the proportion of recently bought supply currently in unrealized profit. Historically, readings exceeding 54% have consistently coincided with peak selling pressure during bear market rallies, as the concentration of profitable short-term holders is sufficient to overwhelm demand.
A rally towards the $80,000 zone would simultaneously push this metric above its statistical mean of 54%, triggering a wave of profit-taking as recent buyers seize the opportunity to exit near break-even. Notably, this is not an isolated event in this cycle; it is the second time this structure has emerged, with similar setups observed in previous bear markets. Multiple touches of this threshold reinforce its reliability as a local top indicator.
Profit-Taking Surge Confirms Warning
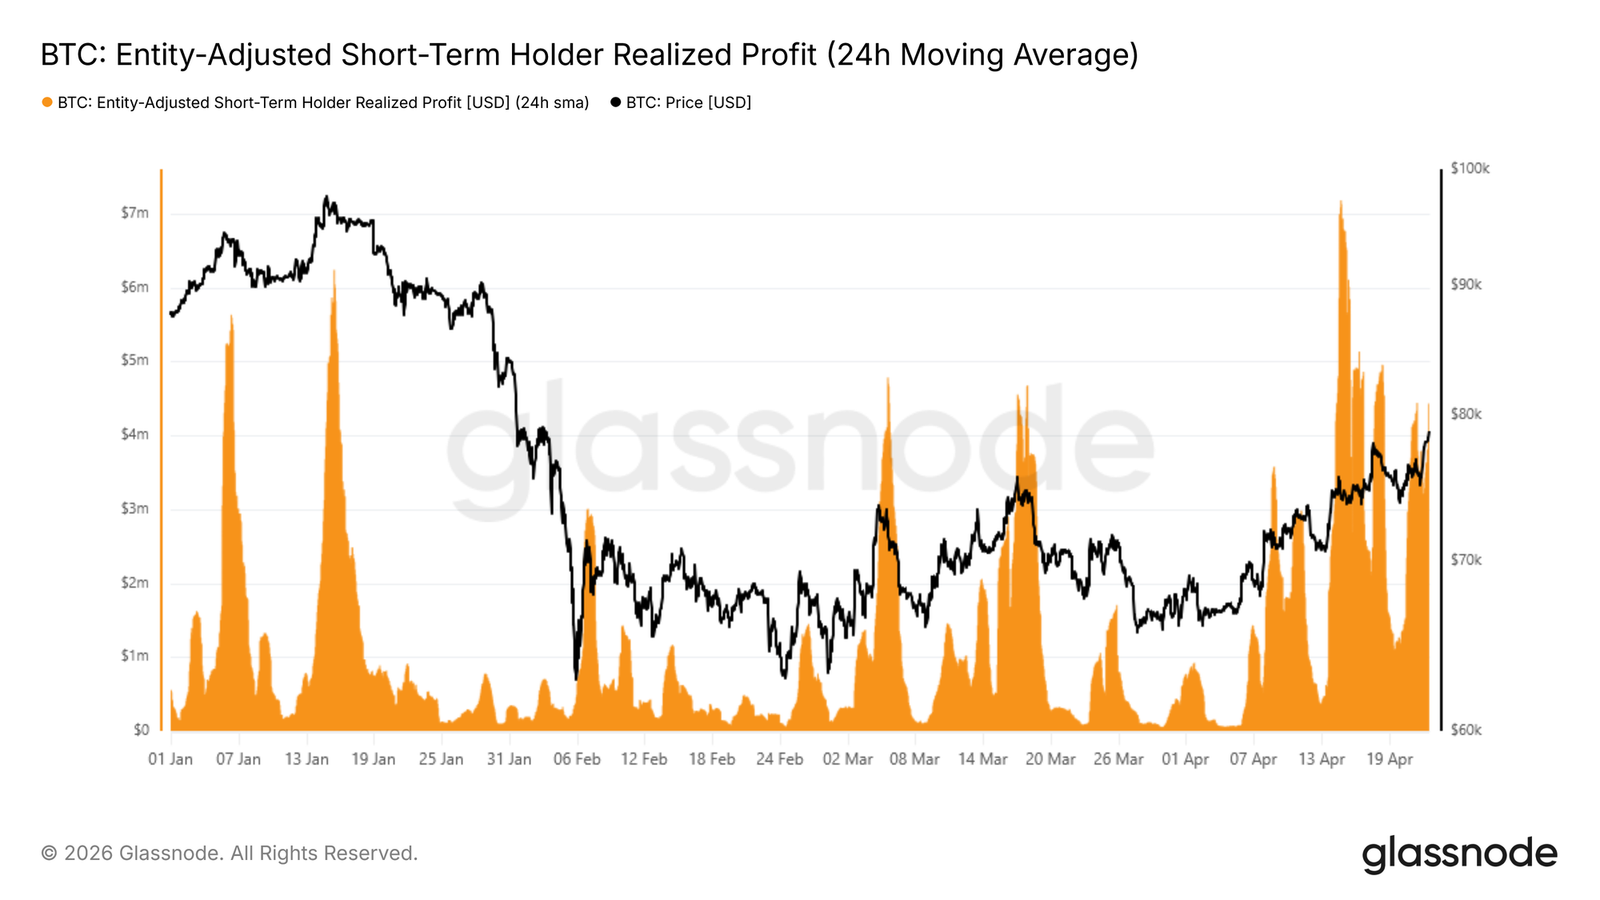
Further reinforcing the exhaustion signals above, the real-time spending behavior of short-term holders is validating the structural picture. As prices test the Short-Term Holder Cost Basis for the second time, pushing over 50% of recent buyers back into profit, the 24-hour simple moving average of short-term holder realized profit volume has surged to over $4.4 million per hour.
Placing this reading in a year-to-date context is particularly telling: every surge exceeding $1.5 million per hour so far this year has coincided with the formation of a local top, making the current reading nearly three times the historical warning threshold.
In the absence of a meaningful demand catalyst to absorb this profit-taking wave and sustain momentum above $80,000, a pullback from current levels would align perfectly with the patterns outlined in this report. The composite signals point to caution rather than conviction.
Off-Chain Insights
ETF Flows Turn Positive Again
US spot ETF flows have begun to recover, with the 7-day moving average returning to positive territory after a prolonged period of sustained outflows. This marks a significant shift in institutional demand, following substantial outflows in late January and February.
The recent cluster of inflows suggests a re-allocation by traditional investors, coinciding with Bitcoin's rebound from lows around $65,000 to the mid-$70,000s. While inflow magnitudes remain below the peaks seen in late 2025, the directional change is significant, indicating a return of institutional appetite.
Structurally, ETFs remain a key marginal buyer for the market. Sustained positive flows would provide a strong demand base, helping to absorb selling pressure and reinforce price strength. However, consistency will be key, as previous rallies struggled to hold when ETF demand faded.
Spot Demand Returns
Spot CVD bias has shifted decisively towards buyers in recent trading sessions, with a noticeable increase in cumulative volume delta across major exchanges. This indicates that the recent price strength is supported by genuine spot demand, rather than purely derivative-driven flows.
Exchange-level dynamics reveal some divergence beneath the surface. Binance spot CVD has dominated the recent buying pressure, while activity on Coinbase has remained relatively subdued, pointing to stronger participation from offshore or retail-driven flows. Nevertheless, the aggregate CVD trend across all exchanges has turned positive, reinforcing the narrative that buyers are entering with conviction.
Importantly, this spot demand recovery coincides with the price moving higher, suggesting a more constructive market structure compared to previous rallies that lacked underlying volume support. If sustained, this shift in spot positioning could provide a more durable foundation for further upside, especially given the growing short bias in the derivatives market.
Short Positioning Increases, Funding Rates Remain Negative
Perpetual contract funding rates have moved decisively lower in recent weeks, with negative readings consistently printed across major exchanges. This marks a clear shift from the positive regime that dominated November and December, when long positions were prevalent and traders were willing to pay a premium to maintain exposure.
The current structure reflects a market increasingly skewed towards short positions, with participants adopting defensive positioning following the sharp downturn in early February. Notably, funding rates have remained negative from March through April, suggesting this is not a fleeting sentiment shift but a more entrenched bias towards bearish hedging and speculative short exposure.
From a positioning perspective, this creates a constructive backdrop. Crowded short positions can serve as fuel for an upside move, especially if spot demand re-emerges or macro conditions stabilize. However, in the absence of strong directional flow, this imbalance may simply reflect a market that remains cautious.
Implied Volatility Continues to Decline
Starting with implied volatility, the dominant trend across the curve remains downward. The 1-month, 3-month, and 6-month tenors have consistently declined over the past two weeks, reflecting a steady compression of volatility expectations.
The 1-week tenor has shown more reactivity, with a few sharp spikes towards 46%, but these moves have not been sustained, quickly reverting to the broader downtrend. This suggests a reluctance in the market to maintain long protection. Instead, volatility is being consistently sold across tenors.
Even as prices have moved higher, implied volatility has failed to expand, pointing to a lack of urgency in hedging and limited upside chasing. The overall structure remains soft, with no clear sign of a broader volatility shift, only persistent selling pressure on the surface.
Realized Volatility Confirms Compression
As implied volatility is continuously sold, realized volatility has also moved in the same direction, reinforcing the trend.
Bitcoin's 30-day realized volatility currently stands at 40.7%, down from 49% in early April, with price action remaining convergent and follow-through limited. This is important because realized volatility anchors how options should be priced. When realized volatility remains low, it is difficult for implied volatility to sustain any upside, as there is no underlying pressure to justify higher premiums.
This is clearly reflected in the volatility risk premium, which is now near zero, meaning implied volatility no longer prices any meaningful premium over realized volatility. Options are pricing what has already happened, not what could happen.
The combination of low realized volatility and persistent volatility selling keeps the overall environment soft, with no pressure forcing a re-pricing of volatility higher.
Short-Term Skew Volatile, Broader Structure Holds
Skew adds further nuance to the picture. The 25 delta skew (put minus call implied volatility) experienced sharp oscillations at the front end on Friday, with 1-week put premium briefly crashing to -2% before bouncing back above 7% over the weekend.
This rapid round trip highlights the reactive nature of short-term positioning. In contrast, the 1-month, 3-month, and 6-month tenors have remained relatively stable over the past two weeks, hovering around 10%-12%, and continue to reflect steady buying of downside protection. This divergence suggests the volatility is driven by short-term positioning rather than a broader sentiment shift.
The temporary decline points to a brief unwinding of short-term hedges, but the rapid rebound indicates that protection demand has not disappeared. The market is making tactical adjustments at the front end while maintaining a cautious stance further along the curve.
Gamma Positioning Outlines Short-Term Resistance and Downside Risk
The positioning picture becomes clearer when examining market maker Gamma. There is significant negative Gamma concentration below the current price, particularly around the $75,000 level, where exposure is at its most extreme.
With Bitcoin currently trading near $79,000, the price sits above this zone, and immediate upside enters positive Gamma territory. In this zone, hedging flows tend to dampen upward moves, creating mechanical resistance as market makers sell into strength. However, the risk lies to the downside. If the price falls back into the mid-$75,000 range, it would enter negative Gamma territory, where market makers' hedging could accelerate downward price action.
Recent flows add important nuance. Over the past 7 days, call buying has dominated activity, pointing to market positioning for upside. However, over the past 24 hours, as spot approaches $80,000, flows have shifted towards call selling, suggesting the upside is being monetized rather than chased.
Conclusion
Bitcoin's return to the True Market Mean marks a significant shift in market structure, as the price reclaims a key cost basis level that often defines the boundary between bear market conditions and a more constructive phase. This recovery is currently supported by improving spot demand and the initial return of ETF inflows, suggesting that both retail and institutional participation is beginning to re-engage.
At the same time, derivative positioning paints a more cautious picture. Persistent negative funding rates highlight a growing short bias, which could act as fuel for an upside move if demand continues to strengthen. However, high realized profits and a lack of volatility premium suggest conviction remains fragile, with traders still hesitant to position aggressively for continuation.
On balance, the market appears to be transitioning towards a more constructive phase, but confirmation is still needed. A sustained break above the $80,000 level will likely depend on continued spot absorption and steady ETF demand, while failure to hold current levels could lead to accelerated downside in a relatively thin liquidity environment.


