
CoinW Research Weekly Report (Issue: March 2, 2026 - March 8, 2026)
- Core View: The cryptocurrency market overall showed a mild upward trend this week, but on-chain activity generally weakened. Market sentiment remains in a state of extreme fear, while several emerging projects in the fields of prediction markets, payment infrastructure, and traditional asset trading have gained attention and funding.
- Key Elements:
- The total market cap rose slightly by 0.85% to $2.37 trillion. Bitcoin spot ETFs saw a net inflow of $568 million this week, but the market fear & greed index stands at 9, indicating extreme fear.
- Total DeFi TVL increased by 2.53% to $95.5 billion. Ethereum maintains an absolute lead with a 56.92% share, but the daily DEX trading volume on major public chains has generally declined significantly.
- The total stablecoin market cap decreased by 1.73% to $306.6 billion. Among them, USDC's market cap grew by 2.65%, while USDT maintains a dominant share of 59.9%.
- On-chain activity diverged. Daily active addresses on Sui and Ton saw growth, but DEX trading volume and active addresses on mainstream chains like Solana and BNB Chain declined significantly.
- Emerging projects gained attention, including the prediction market platform Probable Markets on BNB Chain, the payment infrastructure Cyclops, and the trading platform QFEX (which completed a $9.5 million funding round) that introduces perpetual contracts to traditional assets.
Key Takeaways
The total global cryptocurrency market capitalization is $2.37 trillion, up approximately 0.85% this week from $2.35 trillion last week. As of press time, the cumulative total net inflow for U.S. Bitcoin spot ETFs is approximately $55.37 billion, with a net inflow of $568 million this week; the cumulative total net inflow for U.S. Ethereum spot ETFs is approximately $11.63 billion, with a net inflow of $23.56 million this week.
The total stablecoin market capitalization is $306.6 billion, down approximately 1.73% from $312 billion last week. Among them, USDT has a market cap of $183.89 billion, accounting for 59.9% of the total stablecoin market cap, remaining almost flat compared to last week. Next is USDC with a market cap of $77.2 billion, accounting for 25.1% of the total stablecoin market cap, up approximately 2.65% from $75.2 billion last week. DAI has a market cap of $5.37 billion, accounting for 1.75% of the total stablecoin market cap, remaining flat compared to last week.
According to DeFiLlama data, the total DeFi TVL this week is $95.505 billion, up approximately 2.53% from $93.143 billion last week. Divided by public chain, the three chains with the highest TVL are Ethereum, accounting for 56.92%; Solana, accounting for 6.84%; and BNB Chain, accounting for 6.02%.
On-chain activity for major public chains weakened overall this week. Daily DEX trading volume generally declined, with Solana ($0.969B, -68.33%), BNB Chain ($0.645B, -51.87%), and Sui ($0.049B, -51.33%) experiencing relatively significant drops. Ethereum ($0.862B, -36.62%), Ton ($0.0024B, -18.67%), and Aptos ($0.033B, -16.50%) also saw varying degrees of decline. Transaction fees showed little overall change, with Ethereum, BNB Chain, and Ton remaining around $0.01. Solana ($0.003) and Aptos ($0.000001) saw slight increases of 8.30% and 4.81% respectively, while Sui ($0.00144, -12.94%) experienced a certain decline. In terms of user activity, daily active addresses increased for Sui (179k, +29.11%) and Ton (117k, +4.84%), while other chains saw declines: Aptos (928k, -14.76%), BNB Chain (2.31M, -13.48%), Ethereum (525k, -9.29%), and Solana (1.91M, -6.37%). TVL showed a slight overall upward trend, with Ethereum TVL reaching $54.19B (+2.24%) maintaining absolute leadership, followed by Solana ($6.54B) and BNB Chain ($5.75B), while increases on other chains were relatively limited.
New Projects to Watch: Probable Markets is an on-chain prediction market platform built on BNB Chain, allowing users to trade probabilities around real-world events such as politics, sports, finance, and crypto assets. Cyclops is a stablecoin and crypto payment infrastructure platform built for the payments industry, dedicated to helping payment service providers (PSPs), acquirers, and merchants quickly integrate digital asset capabilities. QFEX is a 24/7 global trading platform for traditional financial asset trading. The platform introduces the perpetual contract model common in crypto markets to traditional financial assets, enabling users to trade assets like U.S. stocks, commodities, and forex 24/7, with leverage up to approximately 50–100x.
Table of Contents
Key Takeaways
I. Market Overview
1. Total Cryptocurrency Market Cap / Bitcoin Dominance
2. Fear & Greed Index
3. ETF Inflow/Outflow Data
4. ETH/BTC and ETH/USD Exchange Ratios
5. Decentralized Finance (DeFi)
6. On-Chain Data
7. Stablecoin Market Cap and Issuance
II. This Week's Hot Money Trends
1. Top 5 Gaining VC Coins and Meme Coins This Week
2. New Project Insights
III. Industry News
1. Major Industry Events This Week
2. Upcoming Major Events Next Week
3. Important Fundraising from Last Week
IV. Reference Links
I. Market Overview
1. Total Cryptocurrency Market Cap / Bitcoin Dominance
The global total cryptocurrency market cap is $2.37 trillion, up approximately 0.85% this week from $2.35 trillion last week.
Data Source: Bitcoin dominance from cryptorank, https://cryptorank.io/charts/btc-dominance
Data as of March 8, 2026
As of press time, Bitcoin's market cap is $1.32 trillion, accounting for 55.69% of the total cryptocurrency market cap. Meanwhile, the stablecoin market cap is $306.6 billion, accounting for 12.94% of the total cryptocurrency market cap.
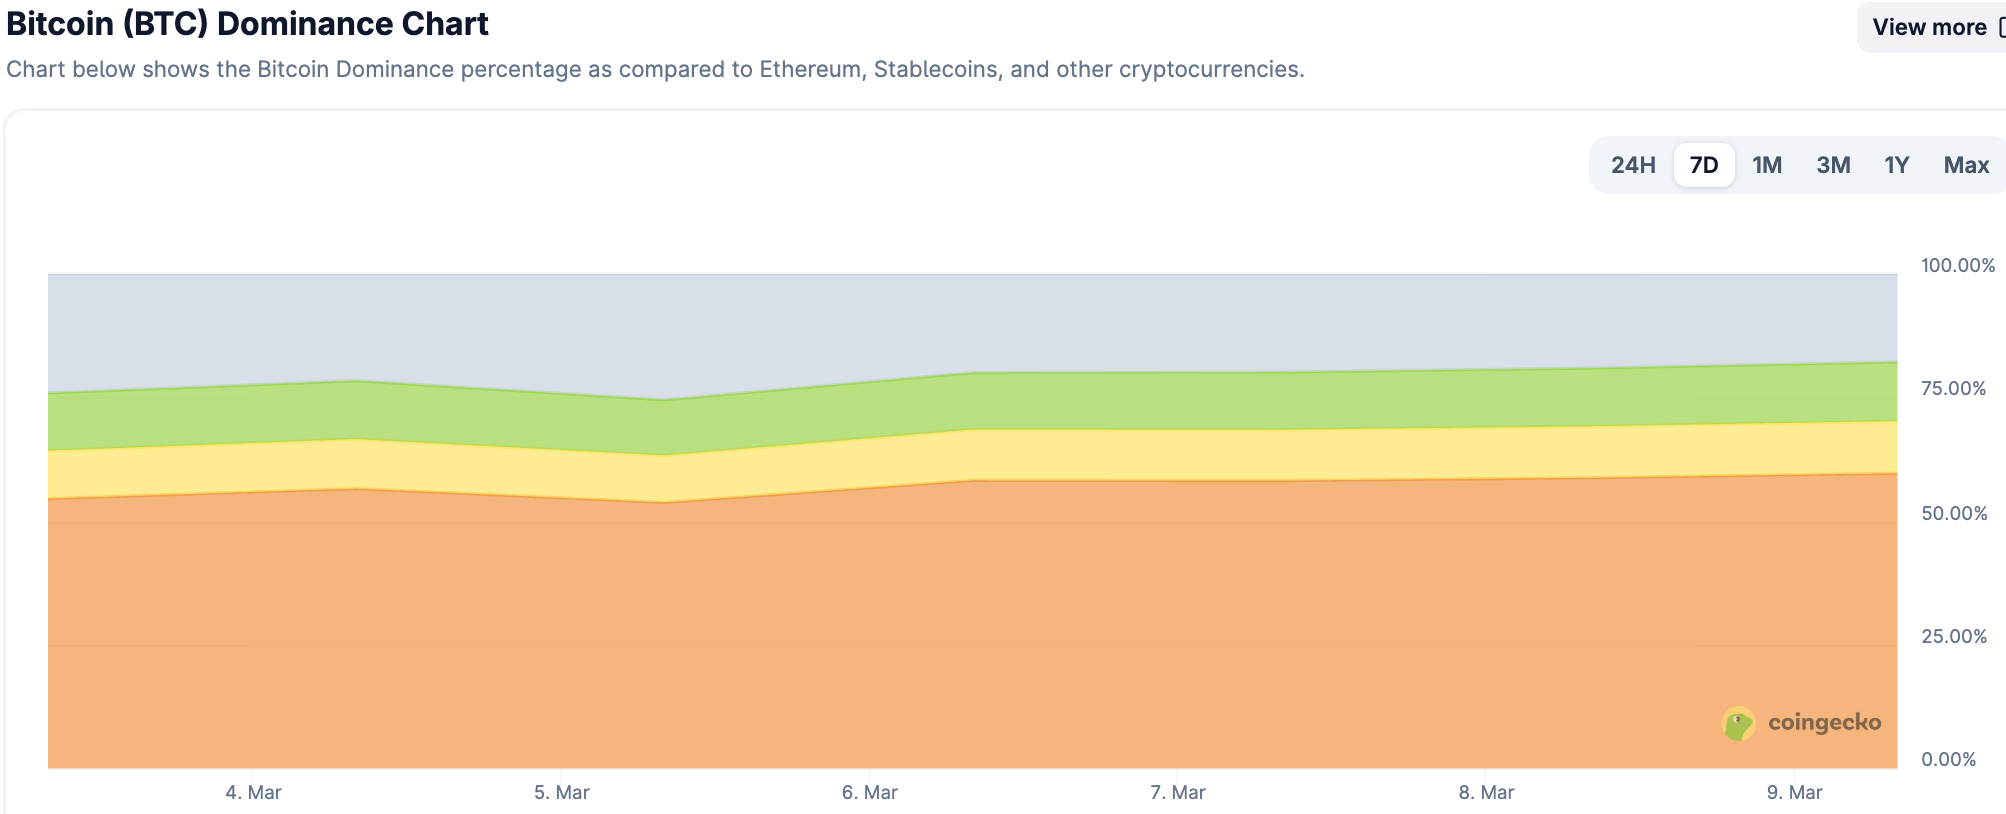
Data Source: coingecko, https://www.coingecko.com/en/charts
Data as of March 8, 2026
2. Fear & Greed Index
The Cryptocurrency Fear & Greed Index is 9, indicating Extreme Fear.
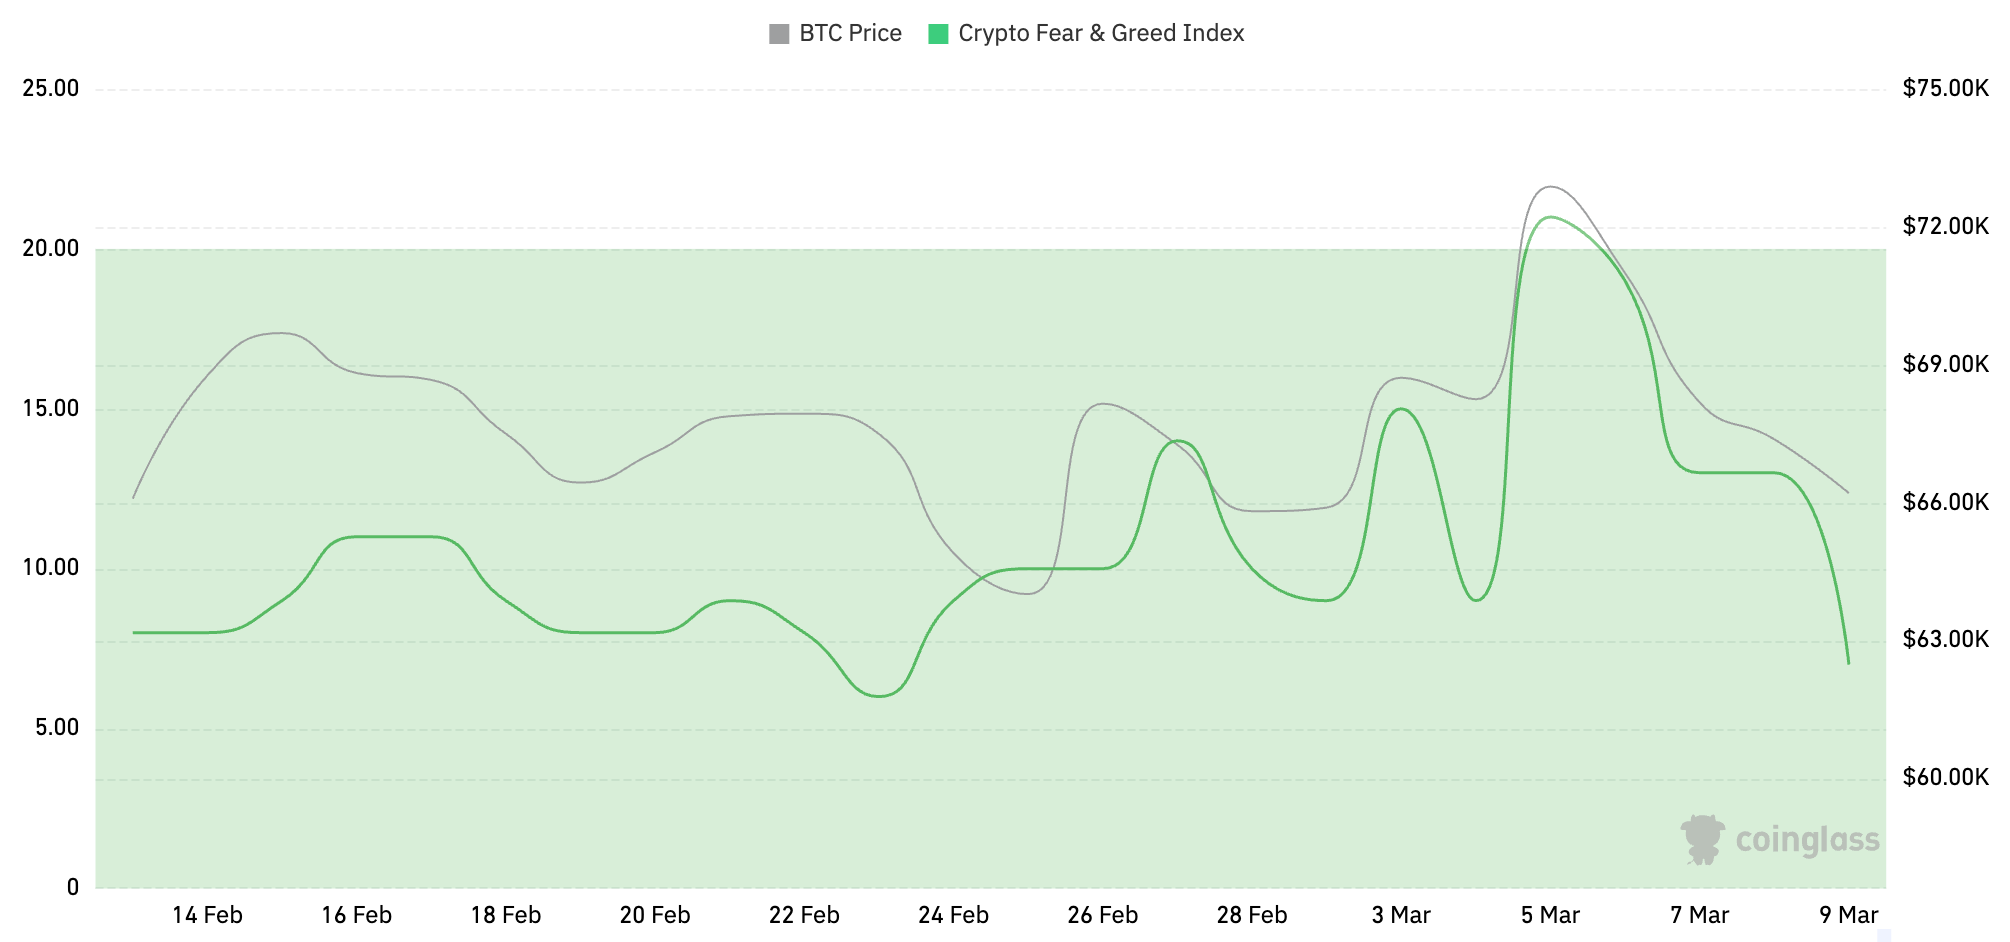
Data Source: coinglass, https://www.coinglass.com/pro/i/FearGreedIndex
Data as of March 8, 2026
3. ETF Inflow/Outflow Data
As of press time, the cumulative total net inflow for U.S. Bitcoin spot ETFs is approximately $55.37 billion, with a net inflow of $568 million this week; the cumulative total net inflow for U.S. Ethereum spot ETFs is approximately $11.63 billion, with a net inflow of $23.56 million this week.
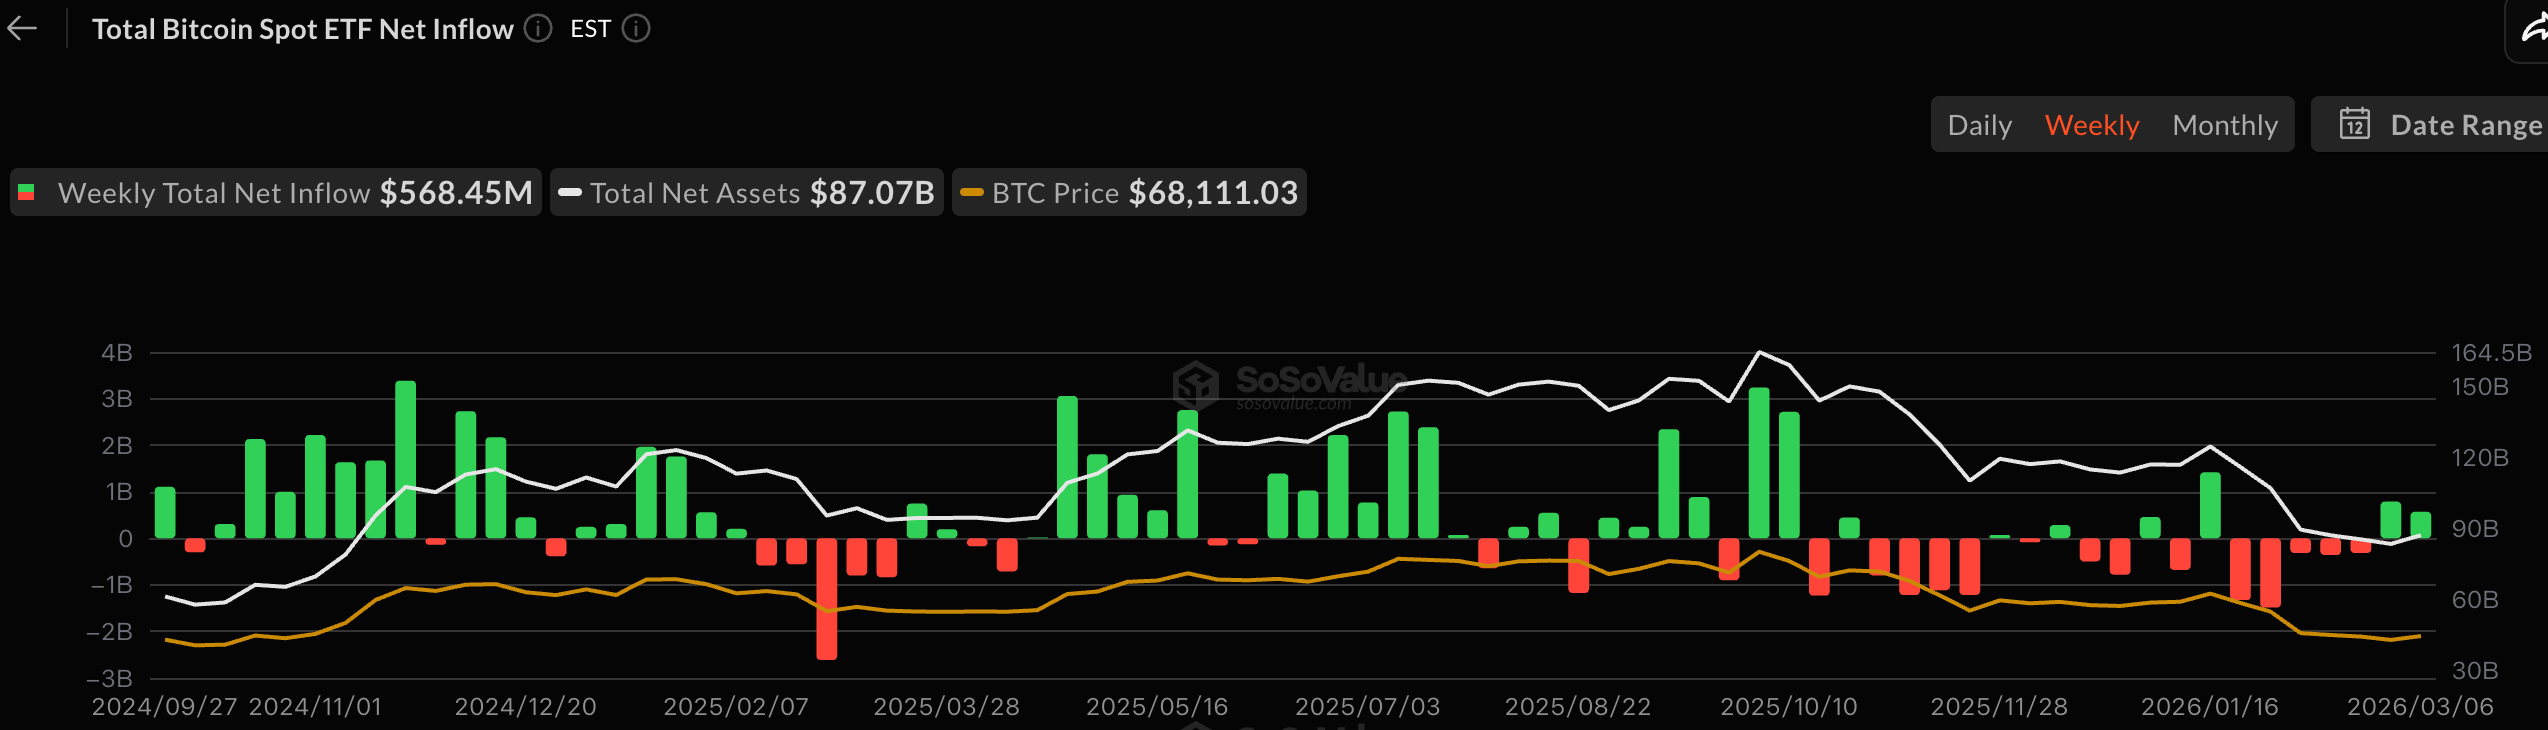
Data Source: sosovalue, https://sosovalue.com/zh/assets/etf
Data as of March 8, 2026
4. ETH/BTC and ETH/USD Exchange Ratios
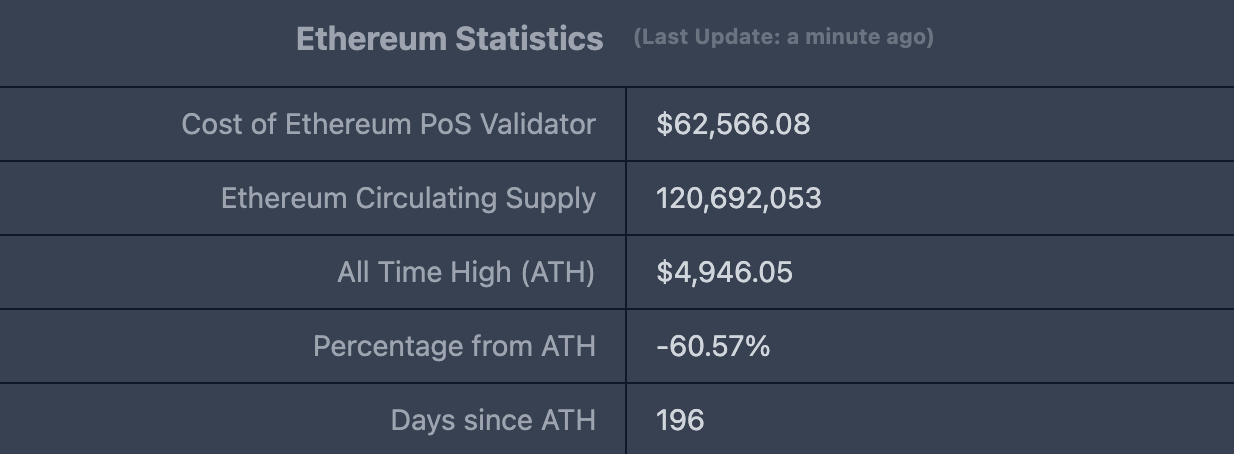
ETHUSD: Current price $1,956.59, all-time high $4,946.05, down approximately 60.57% from ATH.
ETHBTC: Currently 0.029377, all-time high 0.1238.
Data Source: ratiogang, https://ratiogang.com/
Data as of March 8, 2026
5. Decentralized Finance (DeFi)
According to DeFiLlama data, the total DeFi TVL this week is $95.505 billion, up approximately 2.53% from $93.143 billion last week.
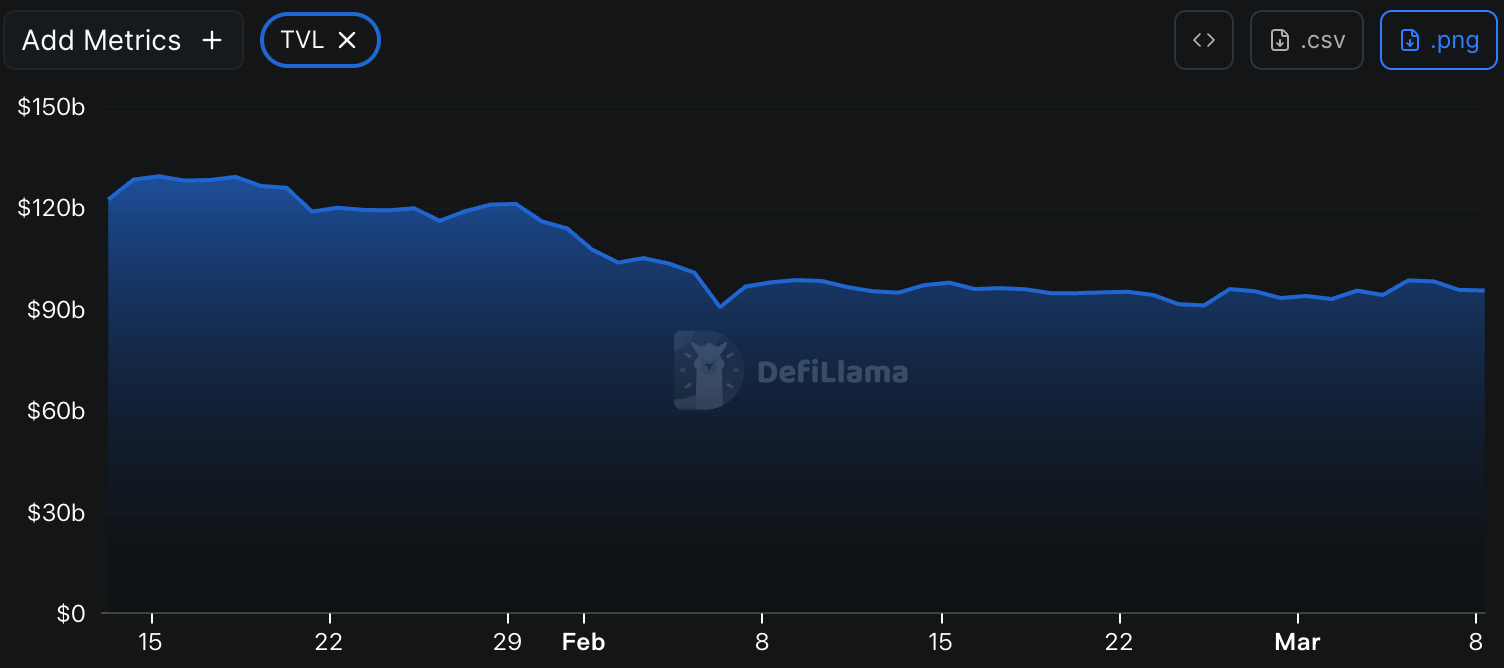
Data Source: defillama, https://defillama.com
Data as of March 8, 2026
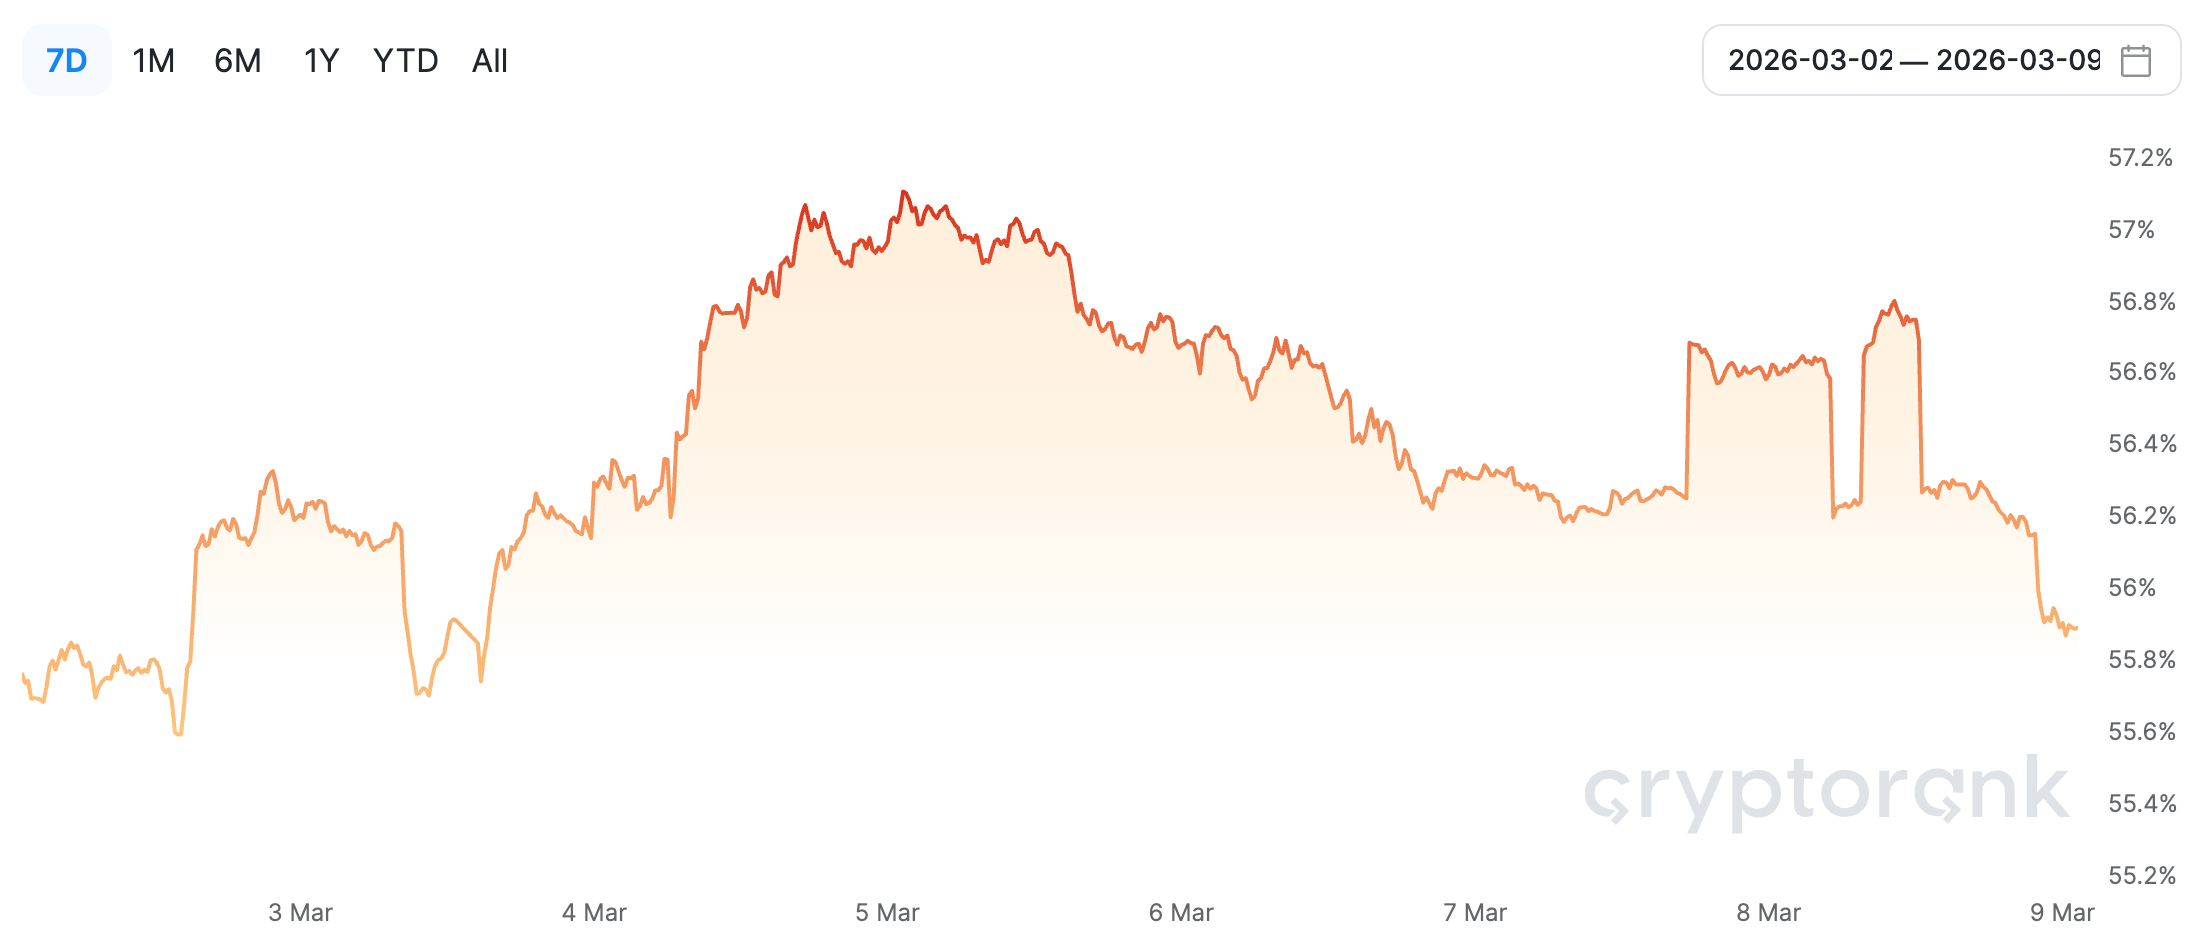
Divided by public chain, the three chains with the highest TVL are Ethereum, accounting for 56.92%; Solana, accounting for 6.84%; and BNB Chain, accounting for 6.02%.
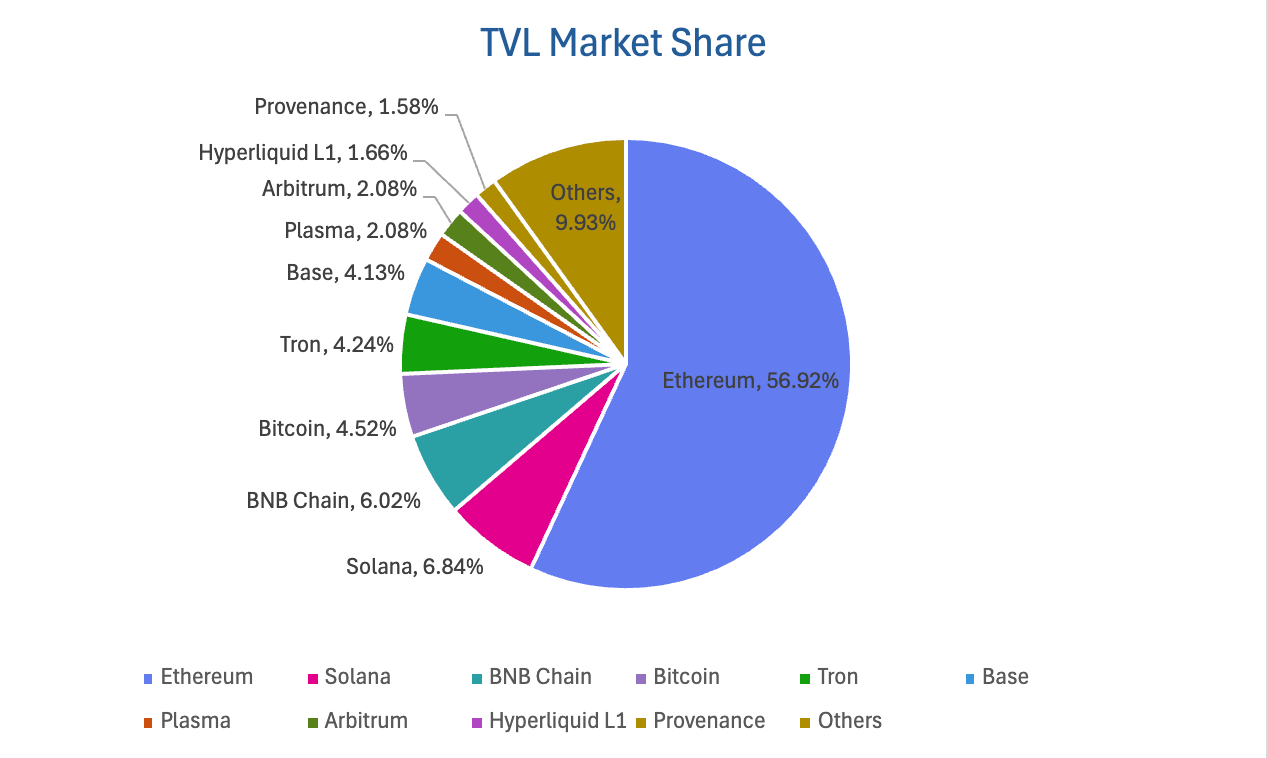
Data Source: CoinW Research Institute, defillama, https://defillama.com
Data as of March 8, 2026
6. On-Chain Data
Layer 1 Related Data
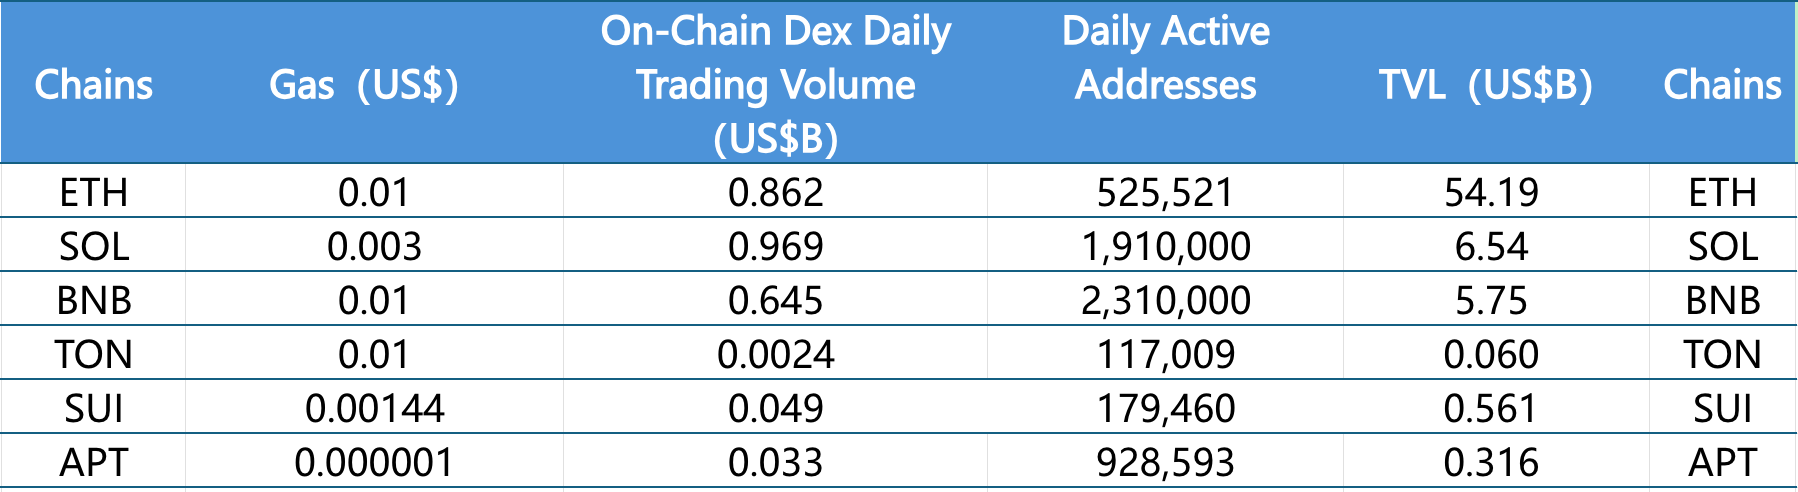
Analyzes current data for major Layer 1s including ETH, SOL, BNB, TON, SUI, and APTOS, focusing on daily trading volume, daily active addresses, and transaction fees.
Data Source: CoinW Research Institute, defillama, https://defillama.com
Data as of March 8, 2026
On-Chain DEX Daily Volume & Transaction Fees: On-chain DEX daily volume and transaction fees are core metrics for measuring public chain activity and user experience. Regarding on-chain DEX daily volume, all chains saw declines this week. Solana ($0.969B, -68.33%), BNB Chain ($0.645B, -51.87%), and Sui ($0.049B, -51.33%) experienced relatively larger drops. Other chains saw smaller declines: Ethereum ($0.862B, -36.62%), Ton ($0.0024B, -18.67%), and Aptos ($0.033B, -16.50%). For transaction fees, Ethereum ($0.01), BNB Chain ($0.01), and Ton ($0.01) remained flat compared to last week. Solana ($0.003) and Aptos ($0.000001) increased by 8.30% and 4.81% respectively compared to last week. Sui ($0.00144) decreased by 12.94% compared to last week.
Daily Active Addresses & TVL: Daily active addresses reflect a public chain's ecosystem participation and user stickiness, while TVL reflects user trust in the platform. For daily active addresses, Sui (179k, +29.11%) and Ton (117k, +4.84%) increased this week. Other chains all declined: Aptos (928k, -14.76%), BNB Chain (2.31M, -13.48%), Ethereum (525k, -9.29%), and Solana (1.91M, -6.37%). TVL overall showed slight increases this week: BNB Chain ($5.75B, +4.13%), Ethereum ($54.19B, +2.24%), Sui ($0.561B, +1.96%), Aptos ($0.316B, +1.94%), Solana ($6.54B, +0.51%), and Ton ($0.060B, +0.07%).
Layer 2 Related Data
According to L2Beat data, the total TVL for Ethereum Layer 2 is $31.90 billion, up 0.28% overall this week from $31.81 billion last week.
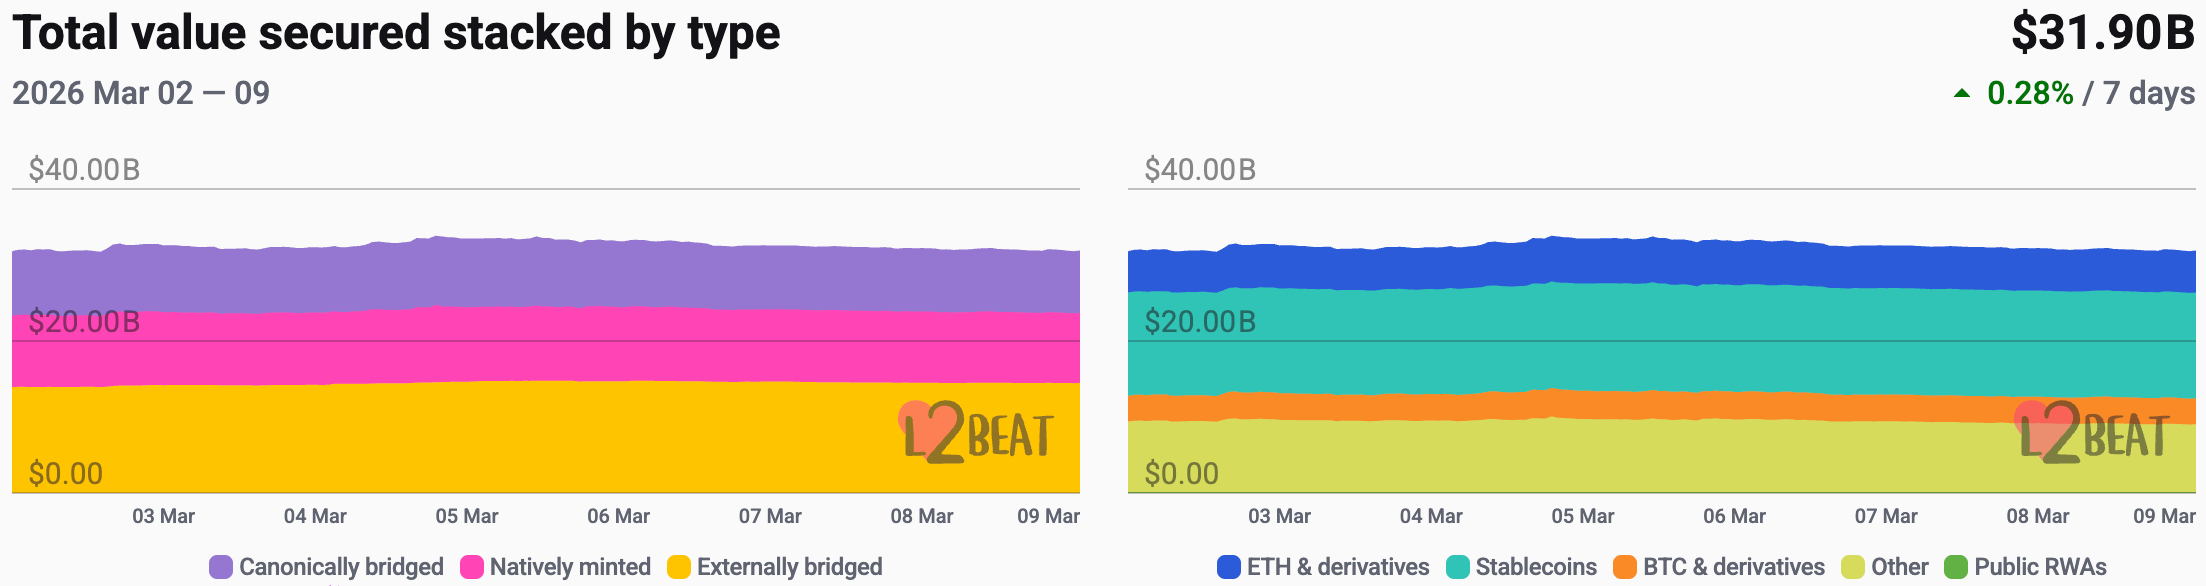
Data Source: L2Beat, https://l2beat.com/scaling/tvs
Data as of March 8, 2026
This week, Base and Arbitrum have market shares of 32.68% and 16.46% respectively, ranking first and second.
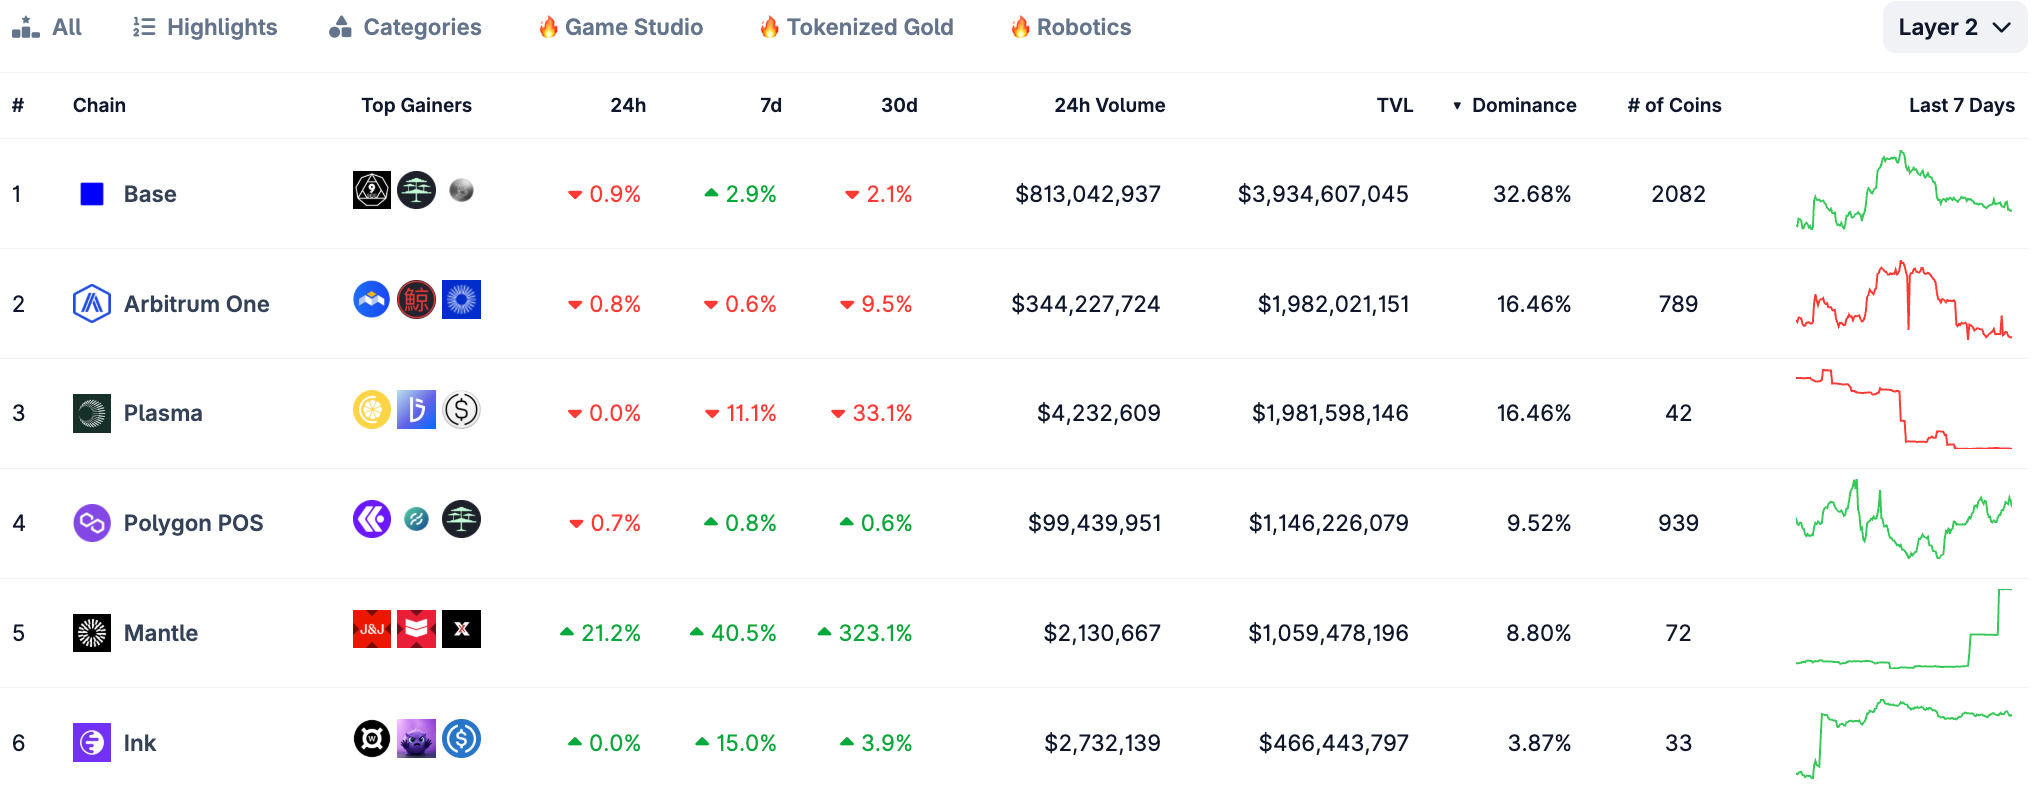
Data Source: CoinGecko, https://www.coingecko.com/en/chains/layer-2
<

