
Huobi Growth Academy|Crypto Market Macro Report: Repricing of Crypto Assets Amid Receding Liquidity
- Core View: The sharp decline in the crypto market in early 2026 was the result of the combined effect of macro liquidity tightening (suppression from high U.S. stock valuations, unwinding of the Yen carry trade, U.S. fiscal fund drainage) and the crypto market's own high-leverage fragility, marking the market's entry into a "new normal" dominated by macro factors.
- Key Factors:
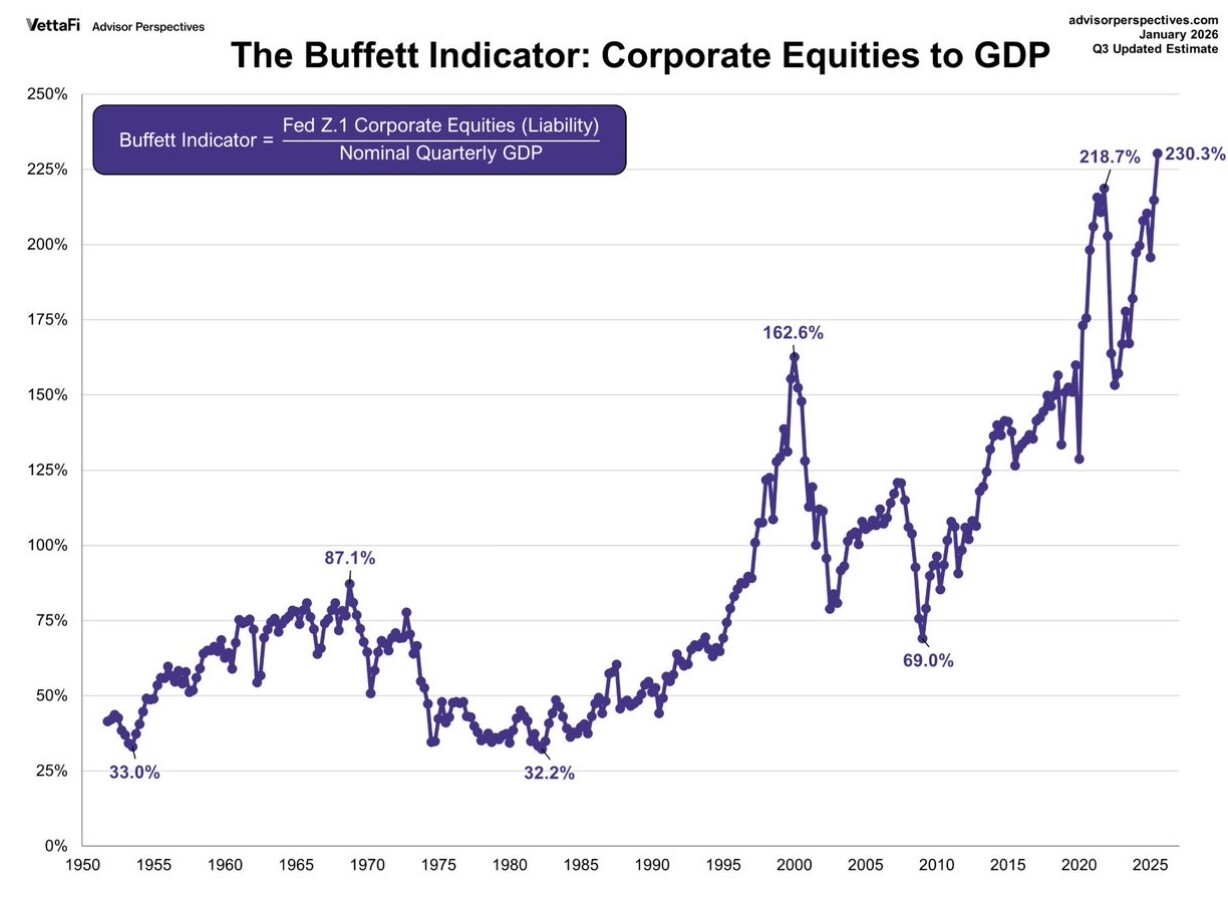
- U.S. stock valuations are at historically extreme highs (e.g., the Buffett Indicator reaching 230%), and their mean reversion pressure suppresses the valuation ceiling of risk assets like crypto assets through channels such as asset price comparisons and policy constraints.
- Expectations of a shift in the Bank of Japan's monetary policy led to the unwinding of the Yen carry trade, with investors selling overseas assets including cryptocurrencies to repay Yen loans, creating sustained fund withdrawal pressure.
- The rapid rebuilding of the U.S. Treasury General Account (TGA) balance and large-scale debt issuance directly withdrew nearly $200 billion in liquidity from the financial system, indirectly causing financial institutions to reduce risk exposure.
- Exchanges followed CME in raising margin requirements, forcing market deleveraging, triggering chain liquidations of high-leverage positions, and resonating with cross-asset liquidations in the precious metals market, amplifying the decline.
- The crypto market's own structure is fragile. Before the crash, stablecoin market cap growth stalled, and on-chain activity diverged from price, indicating that the rally was driven by leverage and highly sensitive to macro liquidity changes.
1. Historical Highs in US Stock Valuations: The "Ceiling Effect" on Risk Asset Pricing
When analyzing cryptocurrency market trends, a macro backdrop that cannot be ignored is that US stock valuations are in a historically high range. As the "pricing anchor" for global risk assets, the valuation level of US stocks not only reflects market expectations for US corporate earnings but also profoundly influences the valuation ceiling of the crypto market through channels such as asset comparison effects, investor risk appetite, and global capital flows. Multiple indicators confirm the current high valuation of US stocks. The Buffett Indicator shows the ratio of total stock market capitalization to GDP has climbed to an extreme historical high of 230%, far exceeding levels seen before the 2000 dot-com bubble and the 2007 financial crisis. The S&P 500's 12-month forward P/E ratio is 22.0x, significantly above its 30-year historical average of 17.1x and approaching the 25.2x seen during the dot-com bubble. The Shiller Cyclically Adjusted P/E Ratio is around 38x, second only to the 44x in 2000. The price-to-sales ratio has broken through 3.0x, reaching a new historical high. These indicators collectively point to one conclusion: US stocks are in a significantly overvalued range.
The high valuation of US stocks transmits to the crypto market through several mechanisms. From an asset comparison effect perspective, when US stock valuations are at historical highs, it implies lower future expected returns, prompting rational investors to reassess their overall allocation to risk assets. Crypto assets, as higher-volatility "peripheral risk assets," are often the first to be reduced. From the perspective of Federal Reserve policy constraints, high US stock valuations create a dilemma for the Fed, limiting its room for easing and potentially leading to a more hawkish stance for longer than the market expects, which is a headwind for all risk assets. From a profit-taking perspective, after years of gains, institutional investors are generally overweight US stocks. When valuations reach extreme levels, they systematically reduce risk exposure, a process that typically manifests as selling the assets with the largest gains and best liquidity—including Bitcoin. From a risk sentiment perspective, US stocks, as the bellwether for global risk assets, trigger investor caution towards all assets with excessive gains and difficult-to-quantify valuations when they are highly valued, making crypto assets the most susceptible to being sold off.
Looking back at history, every time valuations have reached current levels, they have ultimately ended with a painful mean reversion. The lessons of 1929, 2000, and 2007 are still vivid. The particularity of the current US stock valuation is that it is a direct product of the longest-lasting and largest-scale experiment in accommodative monetary policy over the past 15 years. When these policies begin to unwind while valuations are at historical highs, the reversion process could be more violent than before. For the crypto market, this means that even if the industry's own fundamentals continue to improve, macro-level valuation pressure will remain a significant headwind for the next 1-2 years. Only after US stock valuations return to a reasonable range through time digestion or price adjustment can the crypto market truly embark on a new, healthy upward cycle.
2. Yen Carry Trade Unwinding: The "Invisible Drain" on Global Liquidity
The reversal of the Yen Carry Trade is the trigger for this round of crypto market crash and the most critical macro driver. For a long time, the Bank of Japan's zero-interest-rate policy has made the yen the world's lowest-cost funding currency. International investors have borrowed yen on a large scale, converted it into US dollars or other high-interest currencies, and invested in global high-yield assets—including highly volatile cryptocurrencies.
In early 2026, the underlying logic of this carry trade model began to falter. As domestic inflationary pressures in Japan emerged, market expectations for the Bank of Japan to exit its negative interest rate policy surged dramatically. Japanese government bond yields experienced multiple sharp jumps, with the 10-year JGB yield breaking above 1.2%, hitting a multi-year high. This change directly compressed the interest rate differential between the yen and the US dollar: when the cost of borrowing yen rises while the expected return on dollar assets remains unchanged or even declines, the attractiveness of the carry trade plummets.
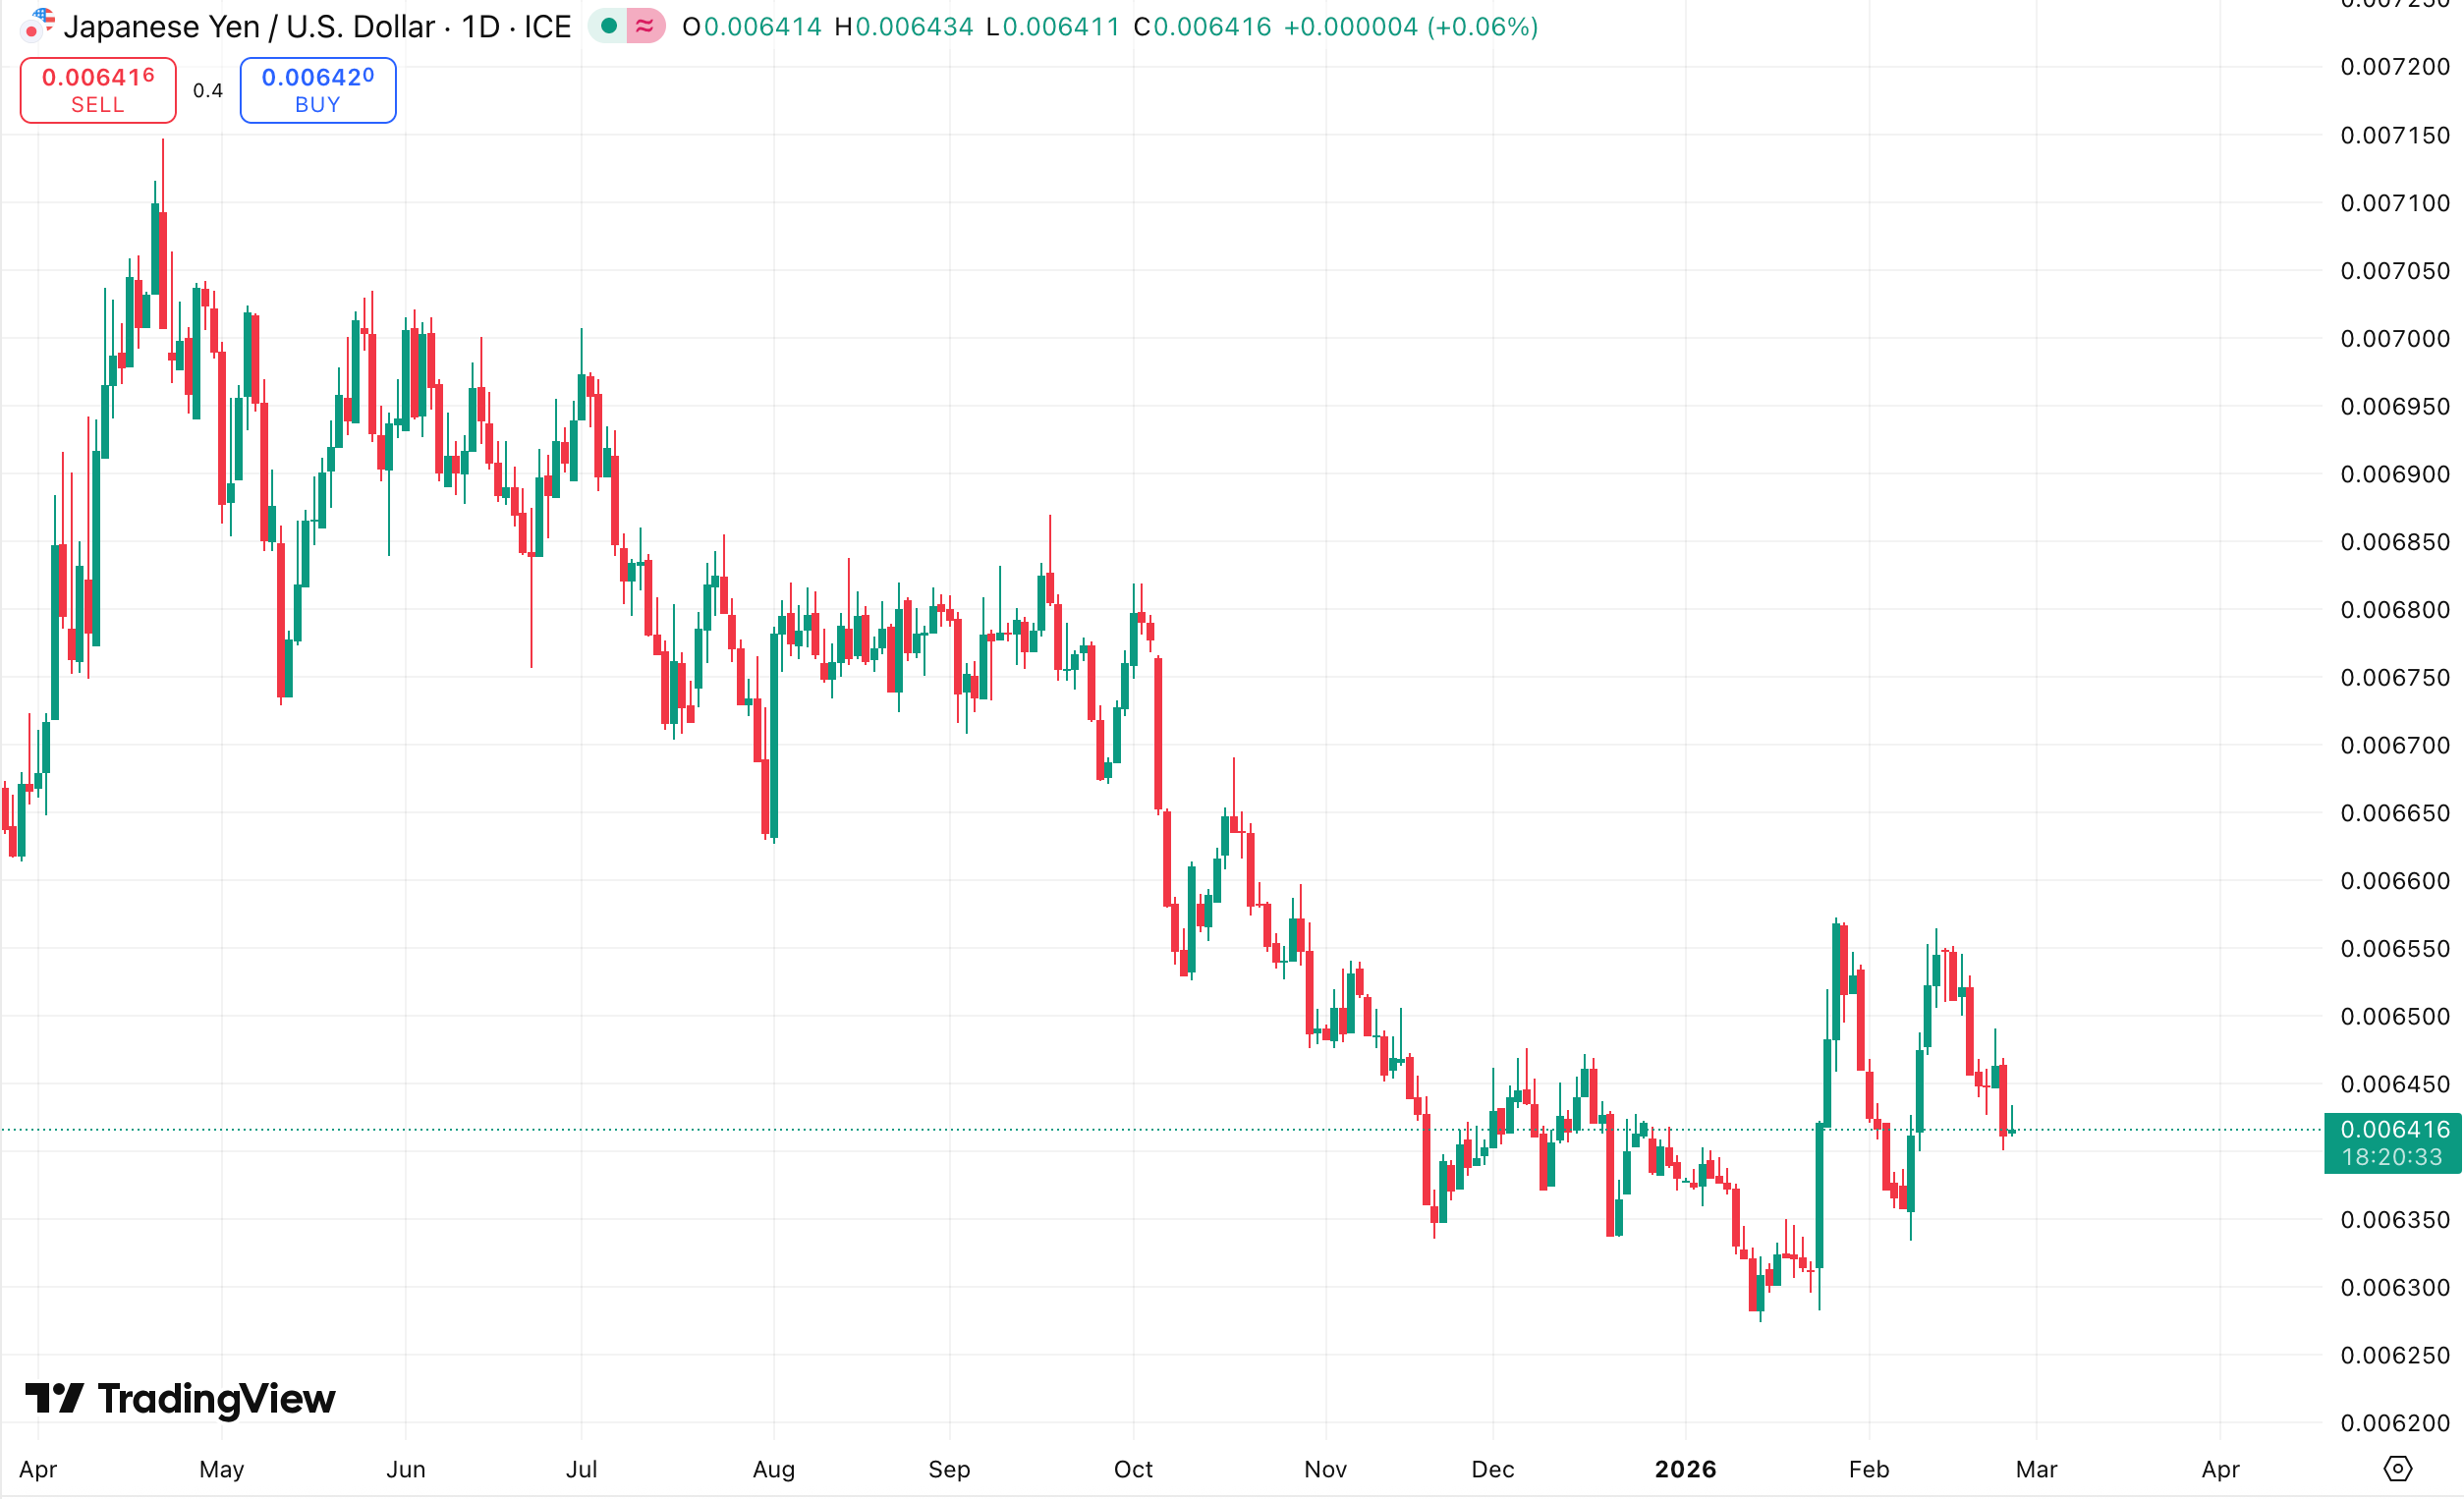
More critically, when the yen began to appreciate (the USD/JPY exchange rate fell from above 150 to the 140 range), carry traders faced not only narrowing interest rate differentials but also exchange rate losses. In this scenario, the most rational choice is to unwind: sell previously held overseas assets (including crypto assets like Bitcoin and Ethereum), convert back to yen, and repay the loans. The peculiarity of the crypto market lies in its 24/7 trading and high liquidity, making it the "ATM" that carry traders sell first. Data clearly shows that during the days of rapid yen appreciation in mid-February, Bitcoin exhibited a highly negative correlation with the yen exchange rate, a classic sign of carry trade unwinding.
It is worth noting that the scale of the yen carry trade is estimated to be in the trillions of dollars, and its unwinding process is often persistent. As long as the Japan-US interest rate differential does not widen again and the yen's appreciation trend is not reversed, this "drain" will continue to siphon funds from global risk asset markets. For a crypto market reliant on incremental capital inflows, this is undoubtedly pulling the rug out from under it.
3. TGA Account Rebuilding and Treasury Issuance: The Liquidity Siphon of Fiscal Policy
If the yen carry trade represents liquidity tightening at the international level, then changes in the US Treasury General Account (TGA) balance represent direct drainage within the dollar system. The TGA account is essentially the Treasury's "wallet": when the Treasury increases the TGA balance by issuing bonds or collecting taxes, it means funds flow from the commercial banking system into the Treasury account, leading to a decline in bank reserves and tightening market liquidity; conversely, when the Treasury spends (e.g., paying government contracts, social security), funds flow back into the market, increasing liquidity.
From February to March 2026, the market is facing a period of rapid TGA balance rebuilding. According to the US Treasury's financing plan, the TGA balance target is maintained at $850 billion by the end of March, reaching a peak of about $1.025 trillion during the April tax season. This means that within just two months, the Treasury will drain nearly $200 billion from the financial system. Simultaneously, to replenish the TGA and finance the fiscal deficit, the Treasury announced a large-scale quarterly refunding plan in early February, with bond issuance exceeding market expectations.
This combined operation of "issuing debt + increasing the TGA balance" directly led to a continuous decline in bank reserves. For the crypto market, the transmission mechanism is more indirect but equally fatal: reduced bank reserves → financial institutions contract credit → reduced financing capacity for hedge funds and market makers → forced compression of risk exposure → crypto assets face selling pressure. The reserve assets of stablecoin issuers are primarily US Treasuries; TGA rebuilding leads to increased volatility in Treasury yields, indirectly affecting stablecoin redemption pressure and liquidity support capacity.
Historical experience shows that sharp changes in the TGA balance are often highly correlated with risk asset price movements. When the TGA balance fell rapidly (fiscal spending) in early 2021, Bitcoin saw the peak of its bull market; the TGA rebuilding process in early 2026, however, corresponds to the crypto market's persistent decline and eventual crash. This is not a coincidence but an inevitable reflection of the liquidity cycle.
4. Margin Requirement Hikes and Derivatives Deleveraging: Forced Liquidations at the Exchange Level
Beyond macro-level liquidity tightening, the fragility of the crypto market's own derivatives structure was also a significant amplifier of the crash. In early February, as precious metals markets like gold and silver experienced extreme volatility, the Chicago Mercantile Exchange (CME) repeatedly raised margin requirements for gold and silver futures. Although this move directly targeted the precious metals market, its ripple effects quickly spread to the crypto market.
First, as the world's most important derivatives exchange, CME's margin adjustments have a demonstrative effect. Risk management departments at major crypto exchanges, observing rising market volatility, followed suit by increasing margin ratios for perpetual contracts and futures and lowering leverage limits. For a crypto market heavily reliant on leveraged trading, this was tantamount to forced deleveraging. A large number of highly leveraged positions were forced to liquidate, triggering further price declines, which in turn triggered more liquidations, forming a negative spiral.
Second, the crypto market and precious metals market share a common long-side group—macro hedge funds and trend traders. When these institutions suffer losses in the precious metals market due to margin hikes, they often need to sell other assets (including crypto assets) to replenish margins or cover losses. This cross-asset risk unwinding further exacerbated selling pressure in the crypto market.
More notably, during this crash, Bitcoin and Ethereum futures premiums quickly turned negative (backwardation), and perpetual contract funding rates remained persistently negative, indicating a shift from a market dominated by longs to one dominated by shorts. When funding rates are negative for an extended period, it means longs not only bear losses from price declines but also pay funding fees to shorts, further weakening long-side holding sentiment and prolonging the market's bottoming process. Historical data shows that only after funding rates return to neutral or turn positive and futures premiums recover can the market potentially see a genuine stabilization.
5. The Crypto Market's Own Structure: Dual Vulnerabilities of High Valuation and Liquidity Dependence
Against the backdrop of macro liquidity tightening, the crypto market's own characteristics of high valuation and high leverage amplified the severity of the decline. Although crypto assets lack traditional P/E ratio valuations, we can assess their valuation levels from multiple dimensions:
First, Bitcoin's dominance. Before this crash, Bitcoin's market cap dominance once fell below 40%, with substantial funds flowing into various altcoins and DeFi tokens. This is a typical late-bull-market characteristic—capital chasing high-risk, high-return tail-end assets rather than leading assets. When liquidity reverses, these high-beta assets are often the first to be hit, with declines far exceeding Bitcoin's.
Second, changes in total stablecoin market capitalization. Stablecoins are the "spare cash" of the crypto market; changes in their total market cap reflect the willingness of off-chain capital to enter. Data shows that since January 2026, the total market cap growth of USDT and USDC has stalled or even slightly declined, indicating that the speed of new capital inflow can no longer keep up with market expansion demand. When a market relies on existing capital and leverage to maintain highs, any liquidity shock can lead to a collapse.
Third, the divergence between on-chain activity and price. In the months before the crash, despite Bitcoin's price remaining high, metrics like the number of active on-chain addresses and transaction count did not hit new highs simultaneously and even declined. This indicates that the price increase was primarily driven by leveraged trading on exchanges, not by genuine fundamental improvement or adoption rate increase. Leverage-driven rallies often come and go quickly; once funding conditions tighten, prices rapidly revert.
The peculiarity of the crypto market lies in its participants' sensitivity to macro liquidity, which is far higher than other asset classes. This is because the crypto market lacks traditional "endogenous cash flows"; its price is entirely determined by the willingness of marginal buyers to enter. When macro liquidity is abundant, these marginal buyers (mainly risk-tolerant retail investors and hedge funds) have ample funds, pushing prices higher; when macro liquidity tightens, they are also the first funds to exit. This crash is the most vivid portrayal of this mechanism.
6. Outlook: Crypto Asset Repricing Under a Liquidity Indicator Framework
Looking ahead, the crypto market's trajectory will no longer be determined by a single factor but will enter a new phase dominated by macro factors. Investors need to establish an analytical framework centered on liquidity indicators, focusing on the following key variables:
First is the Federal Reserve's monetary policy path. Although the market is concerned about the hawkish stance of Fed Chair Warsh, it is more important to observe actual economic data. If the job market shows significant cooling and inflation continues to decline, the Fed's tightening pace may be slower than expected. The CME FedWatch Tool shows that market expectations for 2026 rate cuts have been significantly lowered, but this has already been partially priced in. The key lies in when the Fed signals a clear policy shift.
Second is the change in TGA balance and net liquidity. Investors should closely monitor the US Treasury's weekly TGA balance data, as well as changes in the Fed's balance sheet and ON RRP balance. Net liquidity (Fed Total Assets - TGA - ON RRP) is the most intuitive indicator for measuring available cash in the market. If net liquidity continues to decline, the crypto market will remain under pressure; conversely, if net liquidity bottoms out and rises, a phased rebound may occur.
Third is the evolution of the yen carry trade. The USD/JPY exchange rate and the Japan-US 2-year Treasury yield spread are two key observation points. If the yen's appreciation trend halts and the Japan-US yield spread stabilizes or even widens, carry trade unwinding pressure will ease, which is a positive signal for global risk assets, including crypto. Conversely, if the yen continues to appreciate, further deleveraging should be guarded against.
Finally, the crypto market's own structural indicators. Whether the total stablecoin market cap resumes growth, whether Bitcoin's dominance stabilizes, and whether perpetual contract funding rates turn positive are all important references for judging if the market has bottomed. Historical experience shows that only when funding rates are persistently positive, futures premiums recover, and stablecoins flow back into exchanges does it signal a genuine restoration of market confidence.
In terms of specific timing, the second quarter is typically a period of relative liquidity tightness during the year (TGA balance peaks during tax season), coupled with the ongoing Fed balance sheet runoff, the crypto market may continue its volatile bottoming trend. A real turning point may have to wait until the second half of the year—after the TGA balance begins to decline and the market forms a clearer expectation of the Fed's policy path.
7. Conclusion: Farewell to Reckless Rallies, Welcoming the Macro New Normal
The crypto market crash in the first quarter of 2026 is a systemic deleveraging event driven by macro liquidity and amplified by crypto's own structure. It marks the end of the phase of reckless, liquidity-driven rallies since 2023, ushering the crypto market formally into a macro new normal.
In this new normal, crypto assets, like other risk assets, will be profoundly influenced by macro variables such as global central bank balance sheets, fiscal policies, and exchange rate movements. Narratives like "the crypto market is desensitized to macro factors" or "digital gold's safe-haven properties" were disproven in this crash—when a real liquidity crisis hit, Bitcoin's decline was no smaller than that of tech stocks, and its correlation with the Nasdaq reached historical highs.
For investors, this means the need to establish a more macro analytical perspective, not just focusing on project fundamentals or technological progress. Liquidity indicators should become one of the core bases for investment decisions: monitor changes in net liquidity, watch for abnormal spikes in the SOFR rate, observe whether the MOVE index (Treasury volatility) is rising, and monitor whether high-yield credit spreads are widening. These macro variables will determine the beta direction of the crypto market, while project fundamentals only provide alpha opportunities after beta is determined.
Of course, crashes often breed new opportunities. After leverage is cleared out, speculators leave, and valuations return to rationality, projects with genuine long-term value will present buying opportunities. However, until a clear inflection point appears in the macro liquidity environment, caution is paramount. For the crypto market, cash is the ultimate scarce commodity, and liquidity is the only truth.


