
Primitive Ventures Founder Dovey Wan: Who Is Paying for This Bull Market?
- Core View: After Bitcoin's mainstream adoption, the market structure has drastically changed, leading to lower volatility.
- Key Factors:
- Institutional passive allocation has become the main force, while native capital sells on rallies.
- Miners are selling BTC to pivot to AI, increasing supply-side pressure.
- Correlation with U.S. stocks has strengthened, but an independent valuation framework is lacking.
- Market Impact: The financialization of crypto assets is deepening, leading to rising systemic risks.
- Timeliness Note: Medium-term impact
"The Clear Long Bull from the West" was written nearly six years ago. After two market cycles, crypto has largely fulfilled many of the "wish lists" from the past decade. The events described in that article are now unfolding rapidly: institutional allocations to Bitcoin, the full integration of various products linking to TradFi, Circle's high-profile IPO, and even the U.S. President publicly endorsing and posting memes. According to the old script, this should be the standard opening for a "high-beta bull market." However, what we've witnessed this cycle is a collapse in volatility, market-catalyzing events being front-run, and an industry that should be full of "surprises" losing its excitement as assets become fully financialized and mainstream.
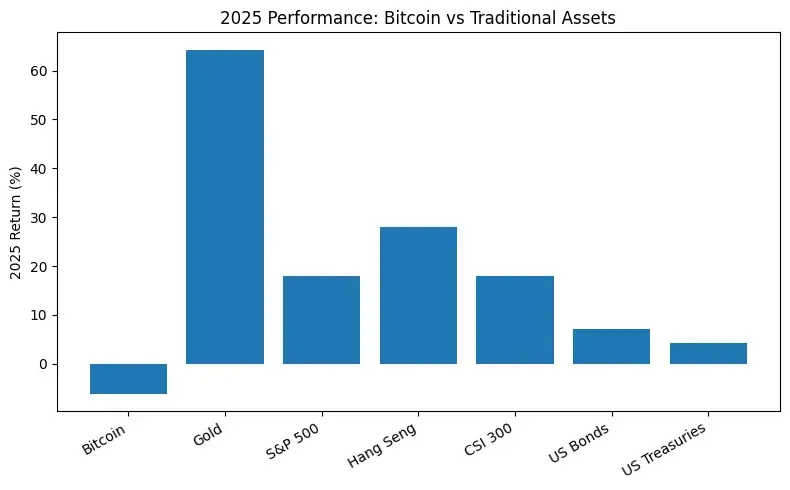
On a cross-asset level, even against a backdrop of favorable policies and institutional tailwinds, BTC significantly underperformed major TradFi assets like gold, U.S. stocks, Hong Kong stocks, and A-shares in 2025, becoming one of the few assets that failed to reach new highs in sync with global risk assets.
The Great Divergence Between Offshore and Onshore Capital
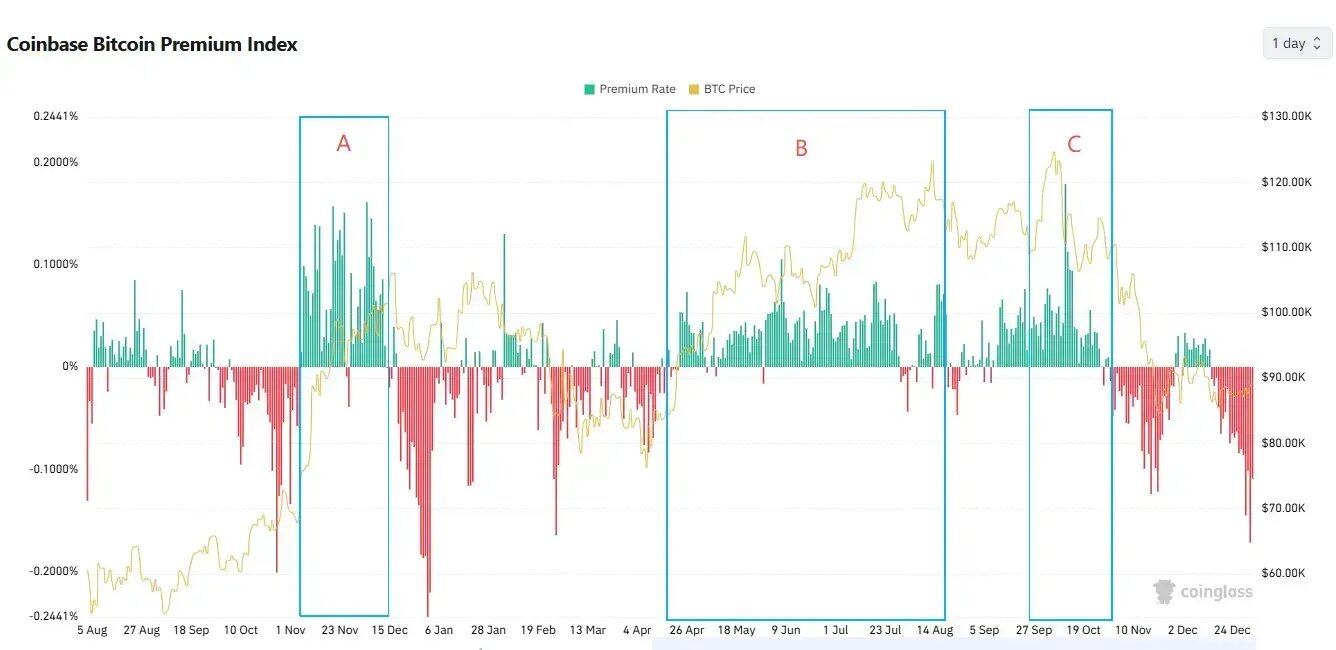
To understand the capital structure of this cycle, we first need to deconstruct the three key peaks of BTC in this period:
Phase A (November 2024 – January 2025): Trump's election and improved regulatory expectations triggered a full-market FOMO from both onshore and offshore capital, with BTC breaking through $100,000 for the first time.
Phase B (April – mid-August 2025): After a deleveraging correction, BTC surged again, breaking through $120,000 for the first time.
Phase C (Early October 2025): BTC recorded its local all-time high (ATH) for this cycle so far, followed shortly by the October 10th flash crash, entering a correction period.
Looking at the combination of spot and derivatives, these three phases share several common characteristics:
Spot: Onshore is the Primary Buyer, Offshore Prefers Selling into Strength
The Coinbase Premium maintained a positive premium during all three peak phases (A/B/C), indicating that the high-level buying pressure primarily came from onshore spot capital represented by Coinbase.
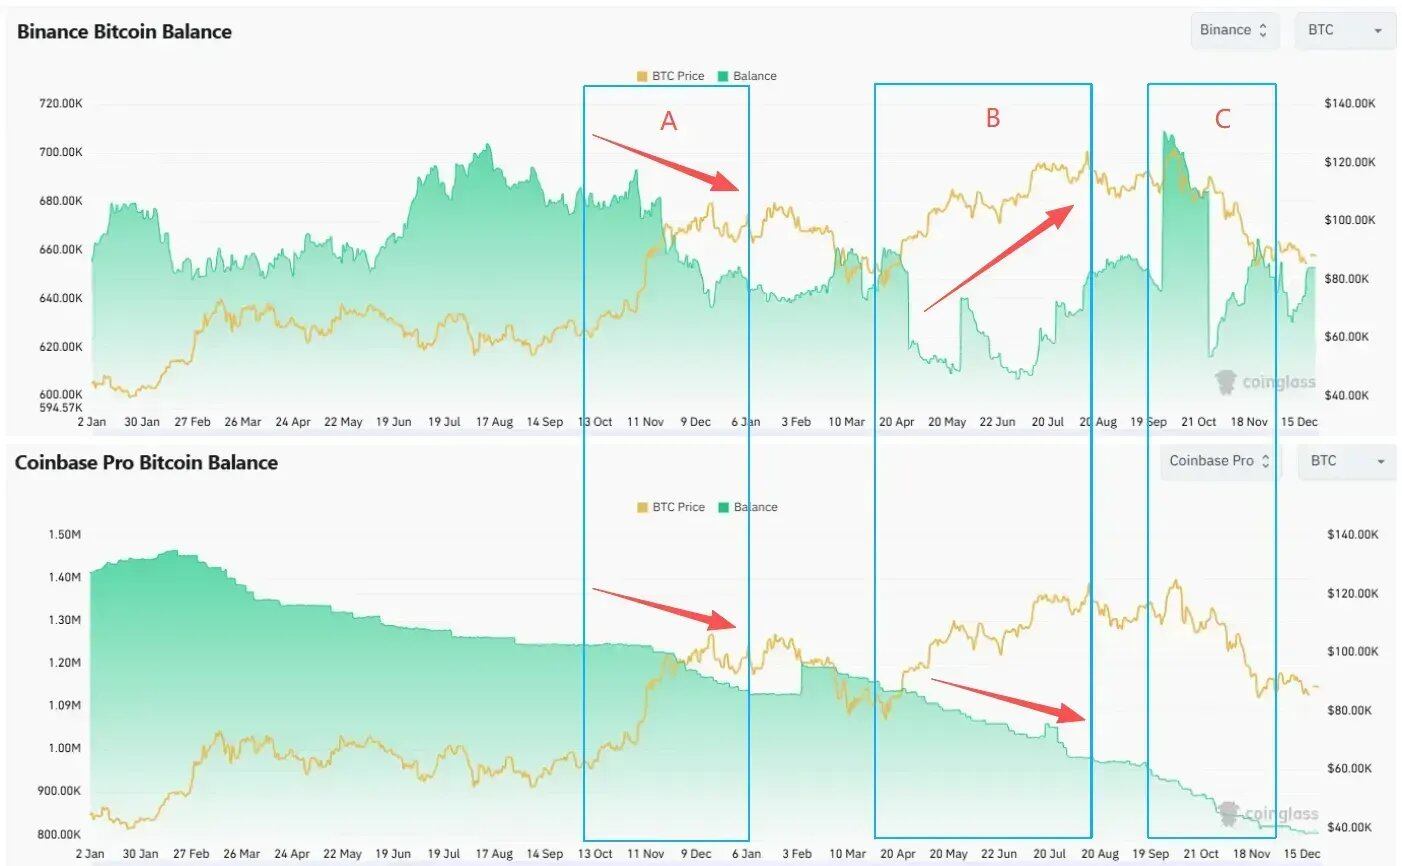
Coinbase BTC Balance has been on a continuous downtrend within the cycle, indicating a decrease in sellable supply on the CEX side. In contrast, Binance Balance significantly increased during phases B and C alongside price rebounds, corresponding to increased potential selling pressure from offshore spot capital.
Futures: Offshore Leverage is Active, Onshore Institutions Continue Reducing Positions
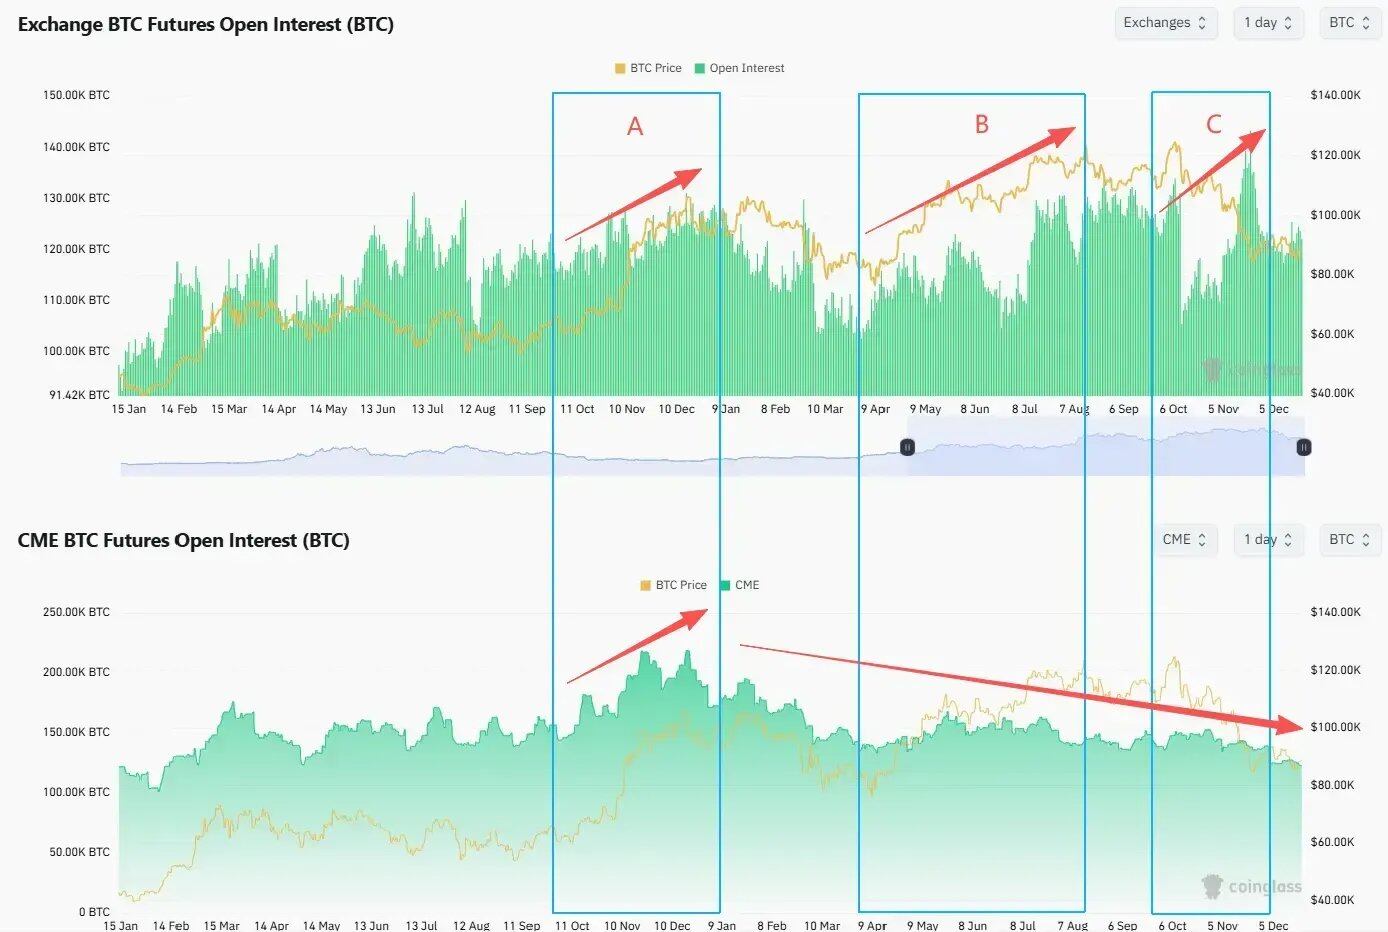
Offshore Open Interest (OI) denominated in BTC (using Binance BTC OI as an example) continued to rise during phases B and C, with leverage increasing. Even after the October 10th deleveraging event caused a short-term pullback, it quickly recovered to high levels and even reached new highs. In contrast, onshore futures OI represented by CME has been on a continuous downtrend since early 2025 and did not rebound in sync when prices hit new highs.
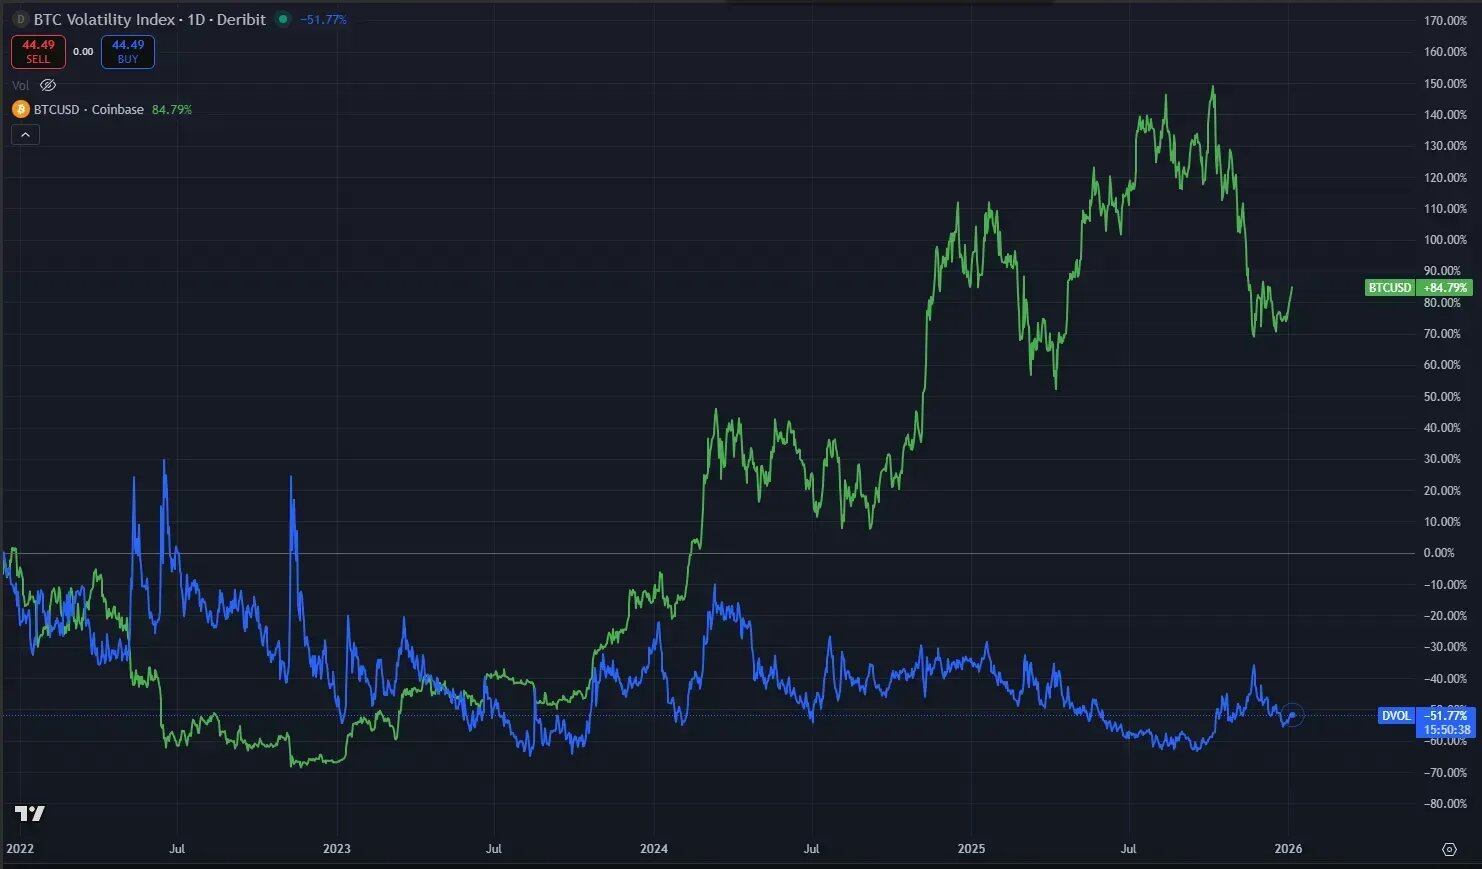
Simultaneously, BTC volatility diverged from its price, especially in August 2025 when BTC first broke $120,000, yet Deribit DVOL was at a phase low. The implied volatility did not price in a premium for the new high, indicating cautious pricing by the options market regarding trend continuation.
Spot represents portfolio rebalancing behavior for major asset allocation. The divergence in behavior between the two sides reflects a disagreement over long-term confidence in the asset. The CME and options players are the smart money most sensitive to the scent of blood, with an extremely keen sense of smell. The difference in their trading setups and timing is starkly apparent.
The "Institutions" with More Money Than Sense?
At the beginning of 2025, two key policies laid the foundation for the structural entry of onshore buying pressure:
- Repeal of SAB 121: Banks no longer need to record BTC held in custody as an equivalent liability on their balance sheets, making it feasible for large custodial banks like BNY Mellon and JPMorgan to offer BTC custody services.
- FASB Fair Value Accounting Effective (January 2025): Corporate holdings of BTC are no longer "impairment-only, no gains recorded," but can be measured at fair market value. For CFOs, this transforms BTC from a "high-volatility intangible asset" into a "reserve asset option" that can truly reflect value in financial statements.
These two changes provided the accounting and compliance prerequisites for subsequent allocation behaviors by DATs, corporate treasuries, and some institutional funds. This is also why we started receiving a large number of financing pitches from newly entering DAT players in Q1 2025. The core competency of DAT founding teams is essentially one: fundraising ability. So-called institutions are not necessarily smarter than retail; they simply have lower capital costs and more financial tools for continuous fundraising.
According to Glassnode statistics, the amount of BTC held by DAT companies rose from approximately 197,000 BTC at the beginning of 2023 to about 1.08 million BTC by the end of 2025, a net increase of about 890,000 BTC over two years. DATs have become one of the most important structural buyers this cycle. The operational logic of DATs can be summarized as NAV premium arbitrage:
- When a company's stock price trades at a premium to the Net Asset Value (NAV) of its held crypto assets, it can raise capital through At-The-Market (ATM) offerings or convertible bond issuances at a high valuation.
- The raised funds are used to purchase crypto assets like BTC, increasing the BTC-per-share value and further supporting the stock price premium.
- During an uptrend, the larger the premium, the easier the fundraising, creating an incentive for companies to "buy more as prices rise."
Taking MSTR as an example, its large-scale BTC acquisitions and largest convertible bond issuances in 2024–2025 were highly concentrated during periods when BTC was in a strong uptrend, approaching or setting new historical highs:
- In November–December 2024, as BTC challenged the $100,000 range, MSTR completed its largest single issuance ever: a $3 billion 0% convertible bond.
- Subsequently, it purchased over 120,000 BTC at an average cost above $90,000, effectively creating significant structural buy-side pressure around the $98,000 level.
Therefore, for DATs, adding positions at high prices is not chasing the rally; it is a necessary outcome to maintain stock price premiums and balance sheet structure.
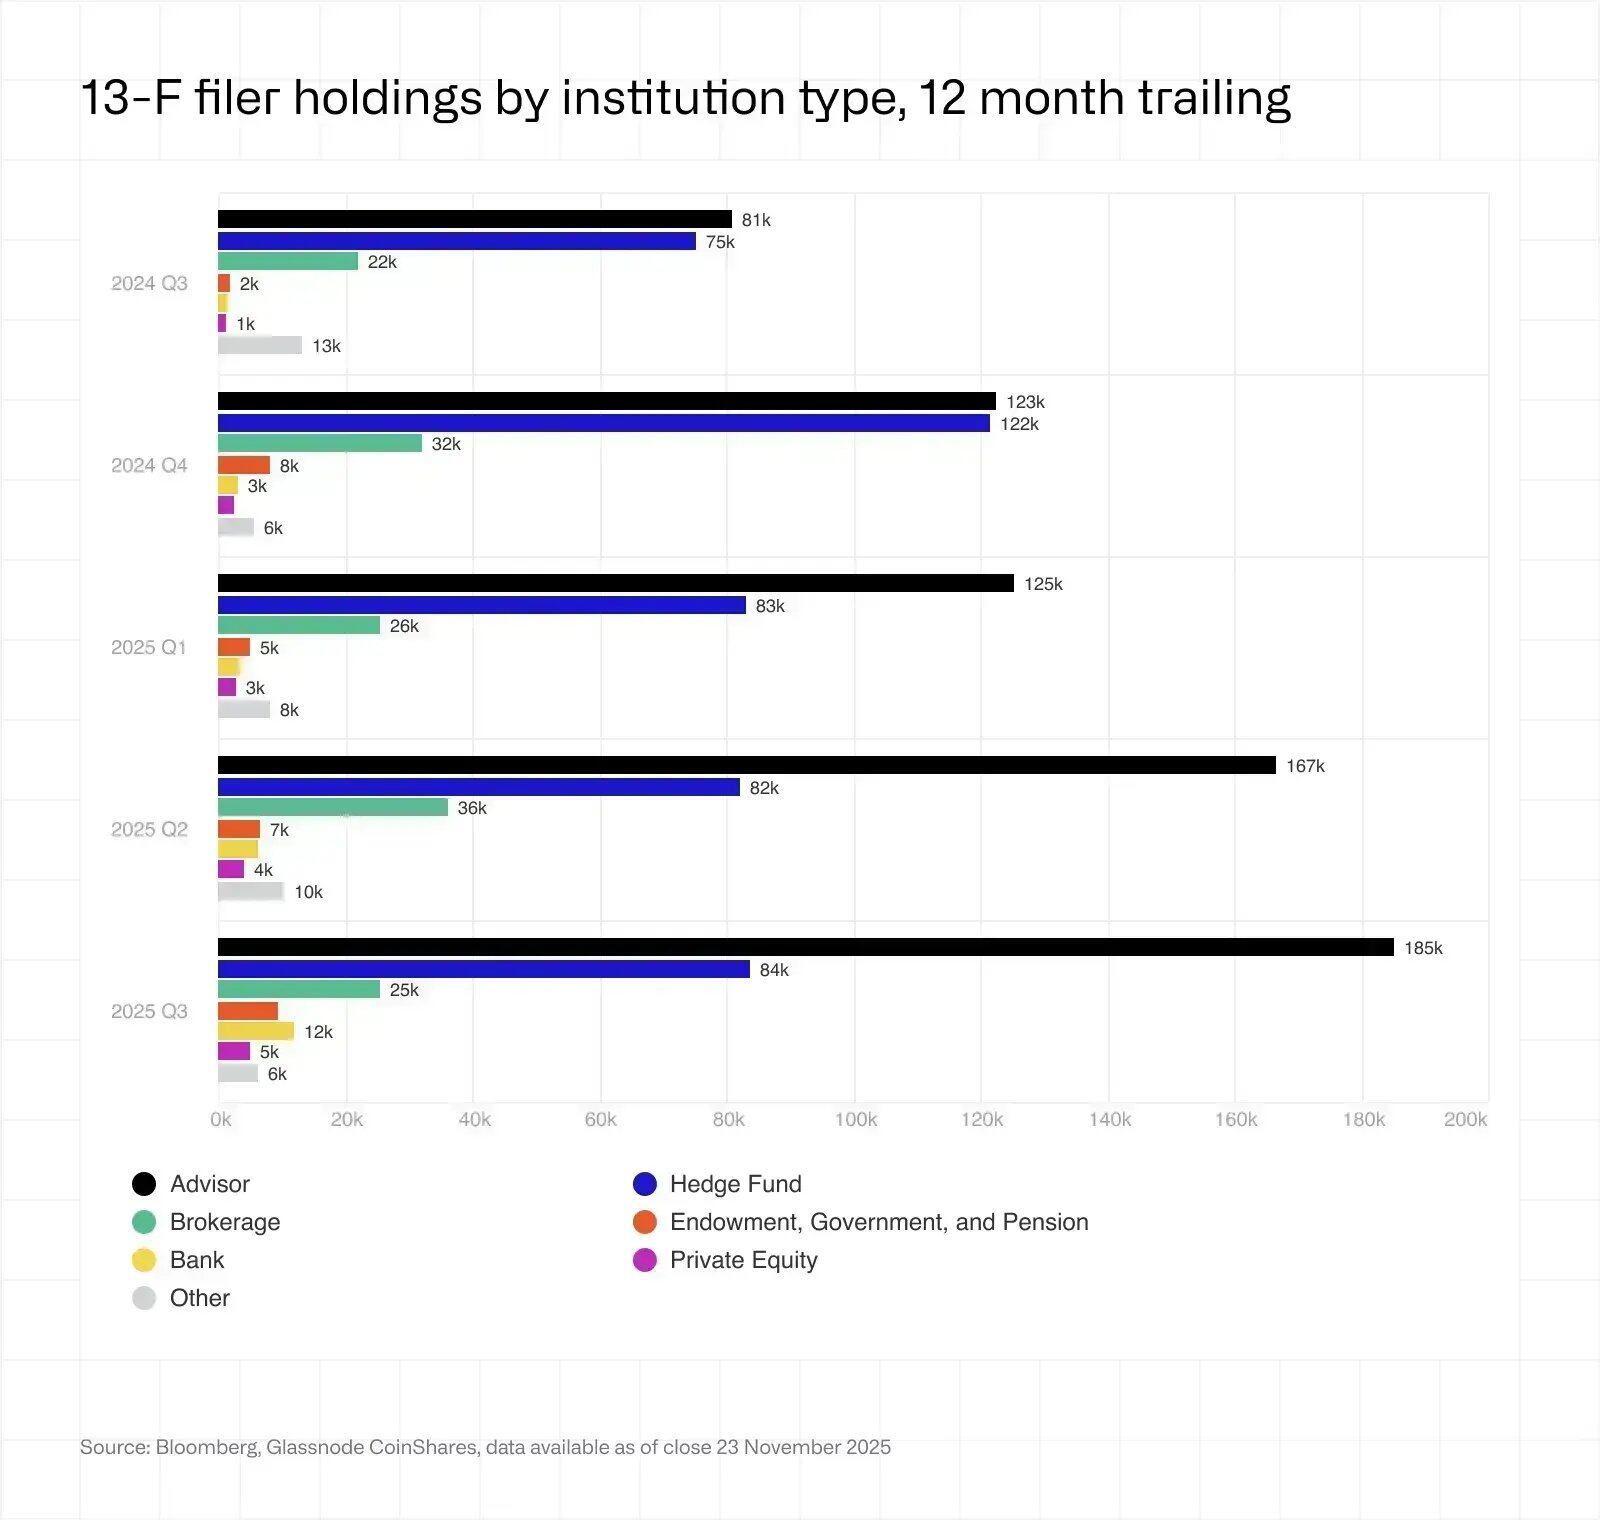
Another frequently misunderstood aspect is ETF flows. The investor structure of ETFs exhibits the following characteristics:
- Institutional holdings (narrowly defined as 13F filers) account for less than a quarter, meaning the overall ETF AUM is still dominated by non-institutional capital.
- Among these institutions, the main types are Financial Advisors (including wrap accounts and RIAs) and Hedge Funds: Advisors focus on medium-term asset allocation with smooth accumulation patterns (passive capital).
- Hedge funds are more price-sensitive, leaning towards arbitrage and medium-to-high-frequency trading. They have been net sellers overall since Q4 2024, a trend highly consistent with the decline in CME OI (active capital).
A slight breakdown of the ETF capital structure reveals that institutions are not the majority. These institutions are not deploying their own balance sheet money; asset managers and hedge funds are certainly not "diamond hands" in the traditional sense.
As for other types of institutions, they are not necessarily smarter than retail either. The business models of institutions are essentially two-fold: earning management fees or earning carry. Our industry's top-tier VC from the 2016 vintage has a DPI of only 2.4x (meaning a $100 investment in 2014 returned $240 by 2024), significantly underperforming Bitcoin's gains over the past decade. The advantage of retail investors is always their ability to go with the flow and pivot quickly after understanding structural market changes, without being burdened by path dependency. Most institutional investors succumb to path dependency and declining self-iteration capabilities, while most exchanges fail due to misappropriation of user assets and security vulnerabilities.
The Absent Retail
Looking at the website traffic of leading CEXs like Binance and Coinbase: Overall traffic has been on a continuous downtrend since the peak of the 2021 bull market, showing no significant recovery even as BTC reached new highs. This stands in stark contrast to the frenzy seen at Robinhood. For more on this, you can read our piece from last year: "Where are the marginal buyers?"
"Where are the marginal buyers?"
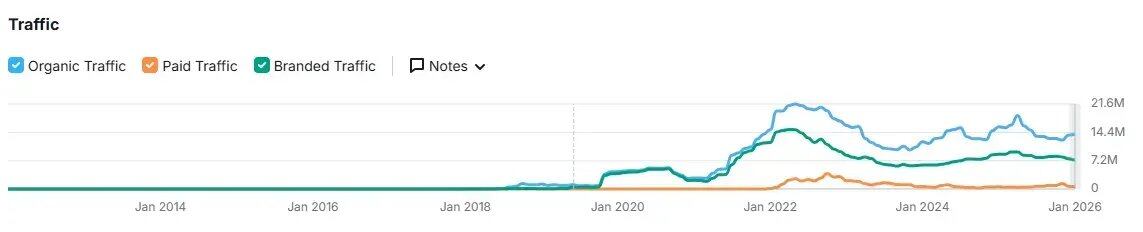
Binance Traffic
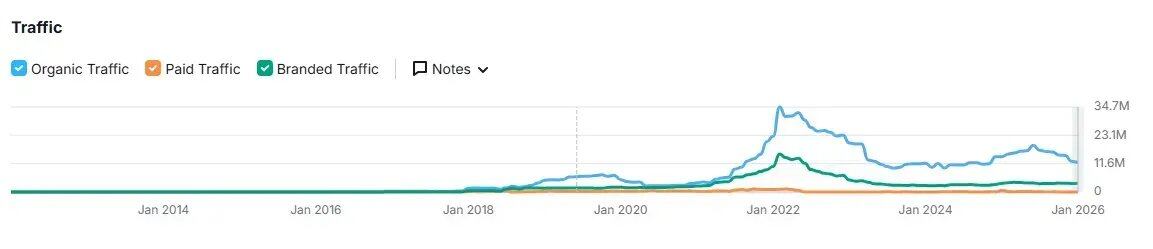
Coinbase traffic
The "wealth effect" in 2025 was more concentrated outside of crypto. S&P 500 (+18%), Nasdaq (+22%), Nikkei (+27%), Hang Seng (+30%), KOSPI (+75%), and even A-shares rose nearly 20%, not to mention Gold (+70%) and Silver (+144%). Additionally, crypto faced competition this cycle: AI stocks offered a stronger wealth effect narrative, U.S. stocks' 0DTE (Zero-Day Options) provided an even more casino-like experience than perps, and new retail entrants were gambling on various macro-political events on platforms like Polymarket and Kalshi.
Furthermore, even the high-frequency speculative Korean retail traders retreated from Upbit this cycle, turning to YOLO into KOSPI and U.S. stocks. Upbit's average daily trading volume in 2025 fell by ~80% compared to the same period in 2024, while during the same period, the Korean stock market index KOSPI rose over 70–75% for the year. Korean retail net buying of U.S. stocks reached a record $31 billion.
The Emerging Sellers
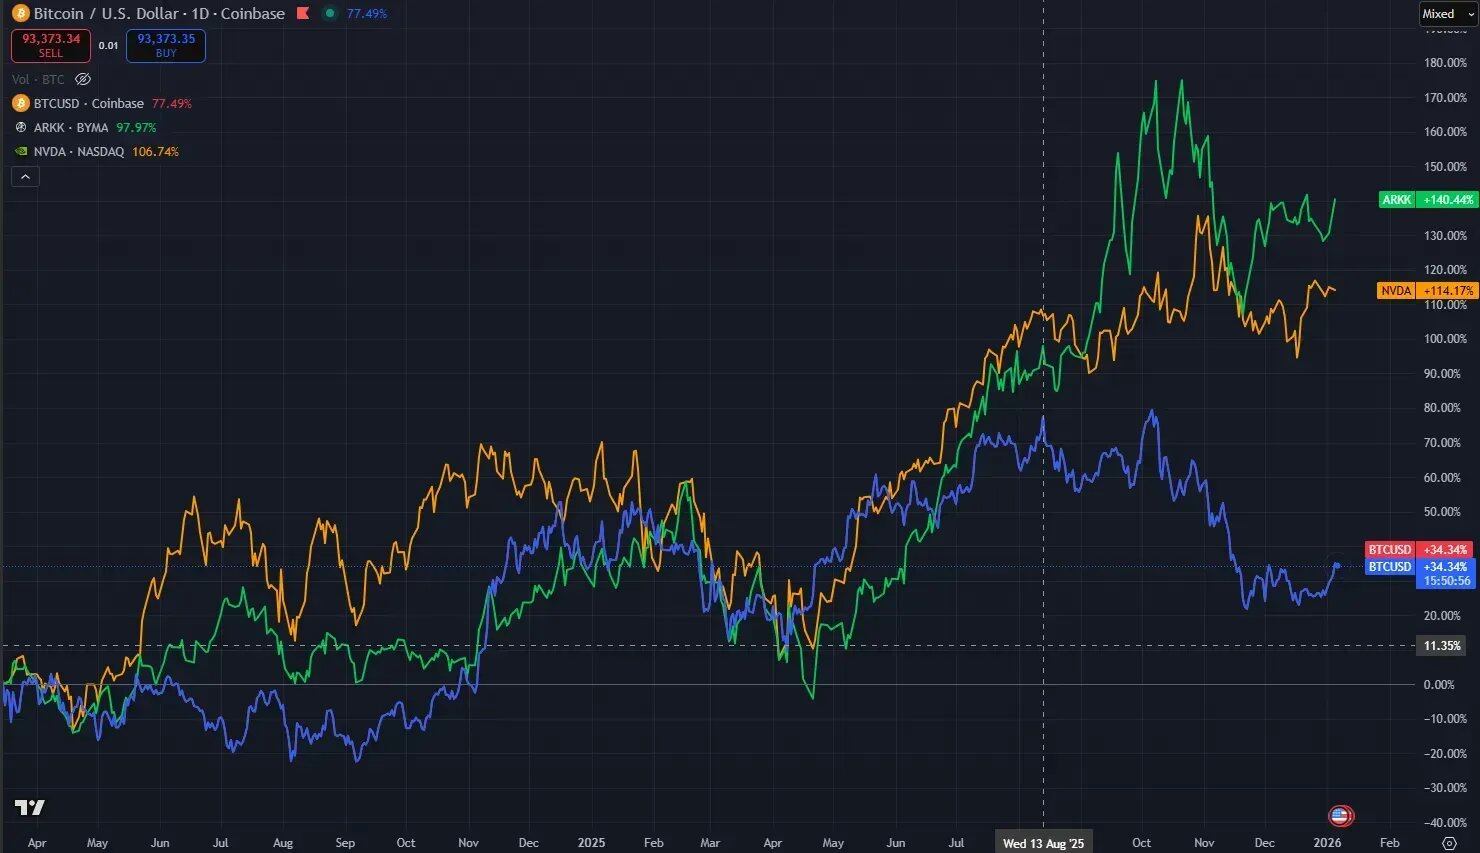
At a time when BTC's movements are increasingly synchronized with U.S. tech stocks, a clear disconnect emerged in August 2025: After following ARKK and NVDA to a peak in August, BTC subsequently fell behind and experienced the October 11th crash, from which it has not recovered. Coincidentally, at the end of July 2025, Galaxy disclosed in its earnings report and press release that it had executed the batch sale of over 80,000 BTC on behalf of an early BTC holder within 7–9 days. These signs indicate that crypto-native capital is undergoing massive turnover with institutional capital.
With the maturation of BTC wrapper products (like IBIT, etc.), the完善的 financial infrastructure now provides the best channel for BTC OG whales to achieve liquid exits. The behavior of OGs has evolved from "selling directly on exchanges at market price" to utilizing BTC structured products for exits or asset rotation into the broader world of TradFi assets. Galaxy's biggest business growth in 2025 came from helping BTC whales transition from BTC to iBit. The collateral mobility of iBit is far superior to that of native BTC, and it is safer and easier to custody. As assets become mainstream, the high capital efficiency of "paper Bitcoin" far exceeds that of "real Bitcoin," a necessary path in the financialization of other precious metals.
Miners: From "Paying Electricity Bills" to "Raising CAPEX for AI"
From around the 2024 halving to the end of 2025, miner reserves experienced their most sustained and significant downtrend since 2021: By the end of 2025, miner reserves were approximately 1.806 million BTC, with the hash rate down about 15% year-over-year, indicating industry consolidation and structural transformation.
More importantly, the motivation for miners to sell BTC this cycle has extended beyond the traditional "covering electricity costs":
- Within the framework of the so-called "AI escape plan," some mining companies transferred BTC equivalent to about $5.6 billion to exchanges to raise capital expenditure for building AI data centers.
- Companies like Bitfarms, Hut 8, Cipher, and Iren are converting existing mining facilities into AI/HPC data centers, signing 10–15 year long-term compute power leases, viewing electricity and land as "golden resources in the AI era."
- Riot, which had long adhered to a "long-term holding" strategy, also announced a policy shift in April 2025, beginning to sell its monthly BTC production.
- Estimates suggest that by the end of 2027, approximately 20% of Bitcoin miners' power capacity will be diverted to run AI.
Financialized Paper Bitcoin
Bitcoin and the crypto-digital assets it represents are undergoing a slow migration from the inside out, shifting from value-discovery-driven active trading dominated by crypto-native capital towards passive allocation and balance sheet management represented by ETFs, DATs, sovereign, and long-term capital—often managing positions in financialized "paper Bitcoin." The underlying asset, Bitcoin, is gradually becoming a risk asset component stuffed into various portfolios and bought according to weight. The mainstreaming of Bitcoin is complete, but it brings with it leverage cycles and systemic fragility similar to traditional finance.
- Capital Structure Level: Incremental buy-side pressure comes more from passive capital, long-term asset allocation, and corporate/sovereign balance sheet management. The marginal role of crypto-native capital in price formation has diminished, often becoming net sellers into strength during most phases.
- Asset Attribute Level: Correlation with U.S. stocks (especially high-beta tech and AI themes) has significantly increased, but due to the lack of a valuation framework, it becomes an amplifier of macro liquidity.
- Credit Risk Level: Through proxies like DAT stocks, spot ETFs, and structured products, cryptocurrencies have become further highly financialized. Asset circulation efficiency has significantly improved, but exposure has also increased to risks such as DAT unwind, collateral haircuts, and cross-market credit crunches.
Where is the Path Forward?
Under the new liquidity structure, the traditional narrative of "four-year halving = one complete cycle" is no longer sufficient to explain BTC's price behavior. The dominant variables for the coming years will stem more from two axes:
- Vertical Axis: Macro liquidity and credit environment (interest rates, fiscal policy, AI investment cycle).
- Horizontal Axis: Premium and valuation levels of DATs, ETFs, and related BTC proxies.
Within these four quadrants:
- Loose + High Premium: High FOMO phase, similar to the environment from late 2024 to early 2025.
- Loose + Discount: Macro relatively friendly, but DAT/ETF premiums are squeezed out, suitable for crypto-native capital to engage in structural rebuilding.
- Tight + High Premium: Highest risk, where DATs and related leveraged structures are most prone to violent unwinding.
- Tight + Discount: A true cycle reset.
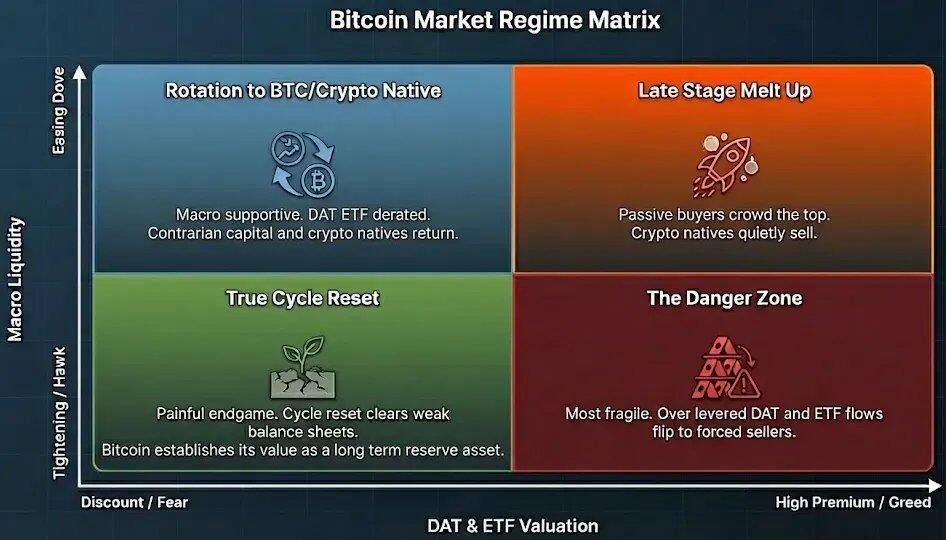
In 2026, we will gradually move from the right-side quadrants towards the


