Originally Posted by David Duong , Global Head of Research at Coinbase
Original translation: Tim, PANews
Overview
We believe the crypto bull market has room to grow into early Q4 2025, driven by a resilient liquidity environment, favorable macro conditions, and friendly regulatory policies. We believe Bitcoin, in particular, will continue to outperform market expectations as it directly benefits from existing macro tailwinds. That said, barring significant energy price fluctuations (or other factors that could negatively impact inflation trends), the immediate risk of derailing the current path of US monetary policy is relatively low. Meanwhile, technical demand from crypto treasuries will continue to provide strong support for the crypto market.
However, seasonality persists in the crypto market. Historical data shows that the price of Bitcoin against the US dollar fell in September for six consecutive years between 2017 and 2022. While this trend led many investors to believe that seasonality significantly impacted cryptocurrency performance, this assumption was not true in 2023 and 2024. In fact, our research shows that the statistical validity of such seasonal indicators is limited due to small sample sizes and a wide range of possible outcomes.
A more salient question in the crypto market is whether we are in the early or late stages of the crypto treasury cycle. As of September 10th, public crypto treasuries held over 1 million Bitcoin (worth $110 billion), 4.9 million Ethereum (worth $21.3 billion), and 8.9 million Solana (worth $1.8 billion), while latecomers have begun targeting tokens with lower risk gradients. We believe we are currently in the Player vs. Player (PvP) phase of the cycle, which will continue to drive capital flows to large-cap cryptocurrencies. However, this also likely signals a consolidation of smaller crypto treasury participants.
Maintain a constructive outlook
At the beginning of this year, we believed the crypto market would bottom in the first half of 2025 and reach a new all-time high in the second half of 2025. This view was contrary to market consensus at the time, as market participants were concerned about a potential recession, questioned price increases, and expressed confusion about the recovery cycle. However, we believe these views were misjudged and stand by our macroeconomic outlook.
As we head into the fourth quarter, we maintain a constructive outlook on the crypto market, which we expect to continue to be supported by strong liquidity, a favorable macroeconomic environment, and encouraging regulatory progress. On the monetary policy front, we expect the Federal Reserve to implement two interest rate cuts, on September 17 and October 29, as the U.S. labor market has shown sufficient signs of weakness. Rather than forming a local high, we believe this will activate idle funds in the OTC market. In fact, we pointed out in August that a rate cut could push a significant portion of the $7.4 trillion in funds in money market funds off the sidelines and into the market.
Nevertheless, a significant shift from the current inflation trajectory, such as a resurgence in energy prices, would pose risks to this outlook. (Note: We believe the actual risk of tariffs is far lower than some estimates suggest.) However, the OPEC+ producer alliance recently agreed to increase oil production again, and global oil demand is showing signs of slowing. However, the possibility of increased sanctions on Russia could also push oil prices higher. Currently, we do not expect oil prices to breach the critical point that would tip the economy into stagflation.
The crypto treasury story is not over yet, and the competition is heating up.
We believe that technical demand for crypto treasuries is expected to provide continued support for the crypto market. Indeed, the crypto asset reserve phenomenon has reached a critical watershed. We are no longer in the early adoption phase of the past 6-9 months, nor do we believe this trend is nearing its end. Instead, we have entered what we call the "PvP phase," a competitive phase where success increasingly depends on execution, differentiation, and timing, rather than simply imitating MicroStrategy's strategy.
While early adopters like MicroStrategy once enjoyed significant premiums to net asset value (NAV), increased competition, execution risk, and regulatory restrictions have led to a discount to NAV. We believe the scarcity premium enjoyed by early adopters has dissipated. Despite this, Bitcoin-focused crypto treasuries currently hold over 1 million BTC, representing approximately 5% of the token's circulating supply. Similarly, top Ethereum crypto treasuries hold approximately 4.9 million ETH (valued at $21.3 billion), representing over 4% of the total circulating supply.
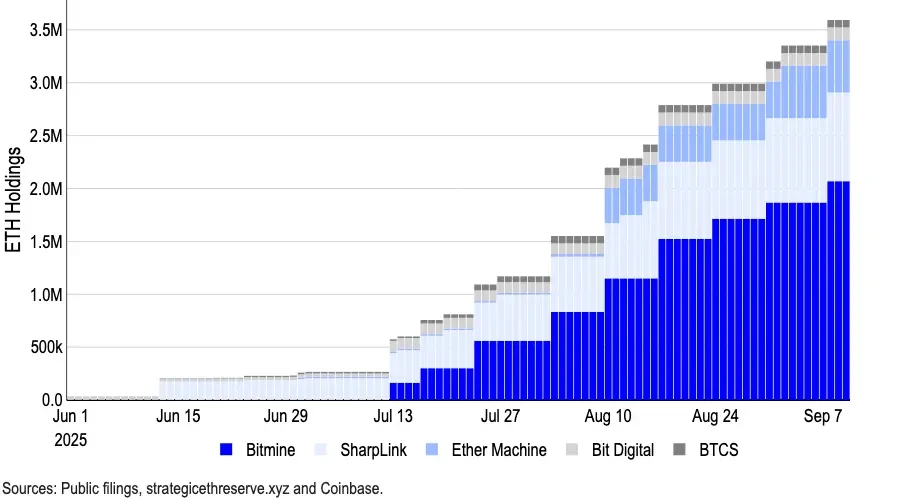
In August, it was reported that 154 US-listed companies had raised approximately $98.4 billion to purchase cryptocurrencies by 2025, a significant increase from the $33.6 billion raised by the top 10 companies at the beginning of the year (based on data from Architect Partners). Capital investment in other tokens is also growing, particularly SOL and other altcoins. (Forward Industries recently raised $1.65 billion to fund its SOL crypto treasury, which is backed by Galaxy Digital, Jump Crypto, and Multicoin Capital.)
The rapid growth of crypto treasuries has drawn increasing scrutiny. Indeed, recent reports indicate that Nasdaq is tightening its regulations on crypto treasury stocks, requiring shareholder approval for certain transactions and promoting enhanced disclosure. However, Nasdaq has clarified that it has not yet issued any formal new regulatory announcements specifically addressing this issue.
We currently believe the crypto treasury cycle is maturing, but neither in the early nor late stages. In our view, the era of easy money and guaranteed premiums to net book value is undoubtedly over. In this player-versus-player (PvP) phase, only the most disciplined and strategically positioned players will emerge victorious. We expect the crypto market to continue benefiting from unprecedented capital flows, which are shifting from traditional investment vehicles to crypto, thereby enhancing returns.
Risking seasonality?
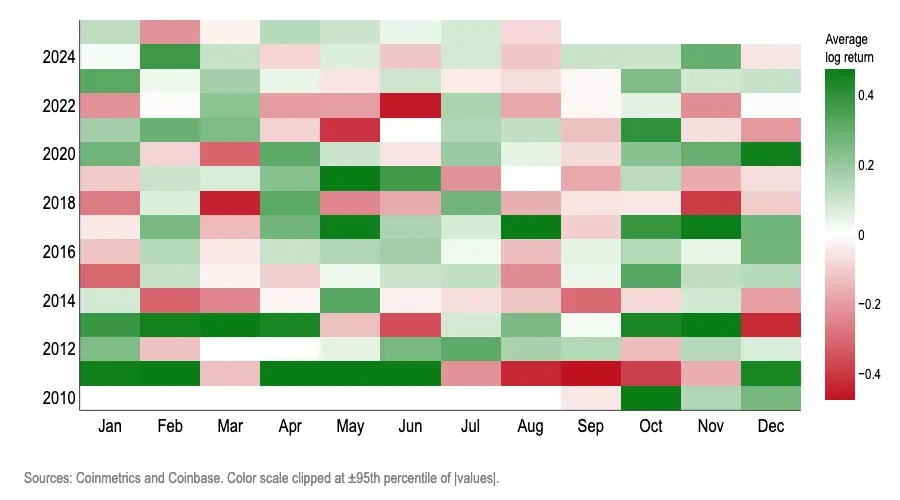
Meanwhile, the issue of seasonal weakness continues to weigh heavily on the minds of crypto market participants. Between 2017 and 2022, Bitcoin's price depreciated against the US dollar in September for six consecutive years, with an average return of -3% for the month over the past decade. This has left many investors with the impression that seasonal factors significantly impact cryptocurrency performance, and that September is often a bad time to hold risky assets. However, trading based on this perception proved erroneous in both 2023 and 2024.
Indeed, we believe that monthly seasonality is not a particularly useful trading signal for Bitcoin. Whether using spectral analysis, logistic odds ratios, out-of-sample forecasts, pseudo-experimental re-ranking tests, or control variable tests, all results convey the same message: the month is not a statistically reliable indicator of the direction of Bitcoin's monthly logarithmic return. (Note: We use logarithmic returns to measure geometric or compound growth, as they better reflect long-term trends and account for Bitcoin's higher volatility.)
The following test found that the “calendar month” is unreliable for predicting monthly signals of Bitcoin’s logarithmic return:
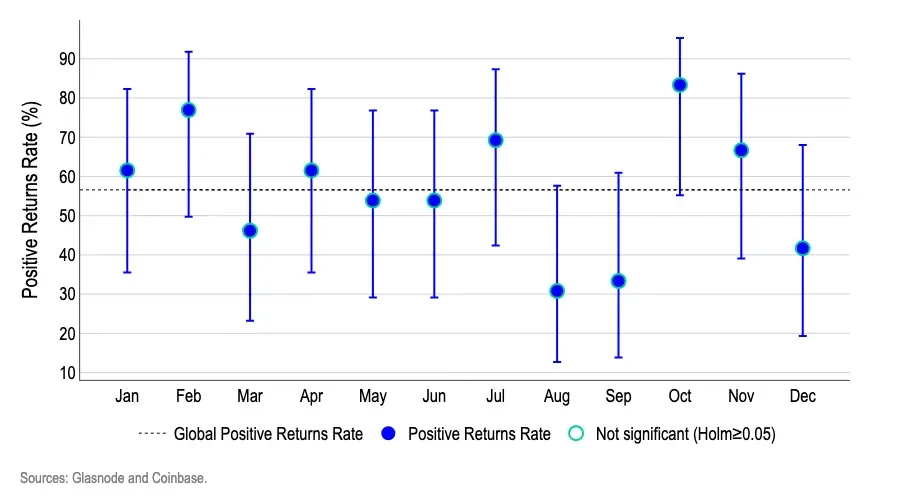
1. Wilson Confidence Intervals: Figure 3 shows that after accounting for small sample uncertainty, no month crosses the threshold of significant seasonality. For months that appear "overweight" (February/October) or "underweight" (August/September), the error bars not only overlap with the overall mean but also with each other, suggesting that the data fluctuations are due to random variance rather than persistent calendar effects.
- Each dot represents the rate at which BTC ends the month in the black; the vertical lines and bars represent the 95% Wilson confidence interval bands, a statistical method suitable for small sample data, as each month only contains about 12-13 data points. This interval can provide a more accurate uncertainty threshold for such small samples.
- The dotted line represents the average of the overall rate of increase. Since we observed data for 12 months simultaneously, we used the Holm multiple testing correction method to avoid misinterpreting random data from a single month as regular changes.
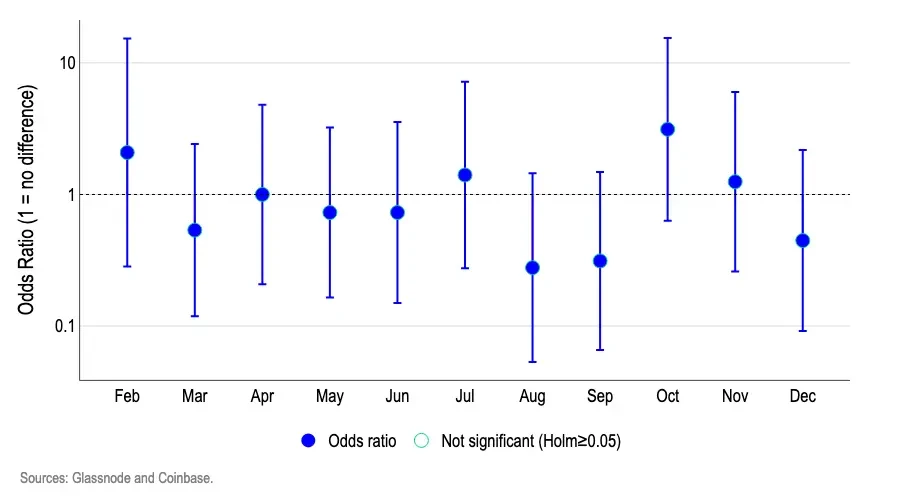
2. Logistic Regression Analysis: We used a logistic regression model to examine whether certain months are more likely to favor Bitcoin's upward or downward movement than the base month (January). Figure 4 shows that the odds ratios for each month are mostly concentrated around 1.0. More importantly, their 95% confidence intervals all cross the critical value of 1.0.
- A value of 1.0 means "the probability of obtaining a positive log return is the same as in January", above 1.0 means "the probability is higher", and below 1.0 means "the probability is lower".
- For example, an odds ratio of 1.5 roughly means "the odds of an up month are about 50% higher than in January," while 0.7 means "about 30% lower."
Since most of the confidence interval bands cross the reference line of 1.0 and no month shows statistical significance after adjusting for Holm’s multiple test, we cannot conclude that “calendar month” is a valid indicator for predicting the direction of Bitcoin’s log return.
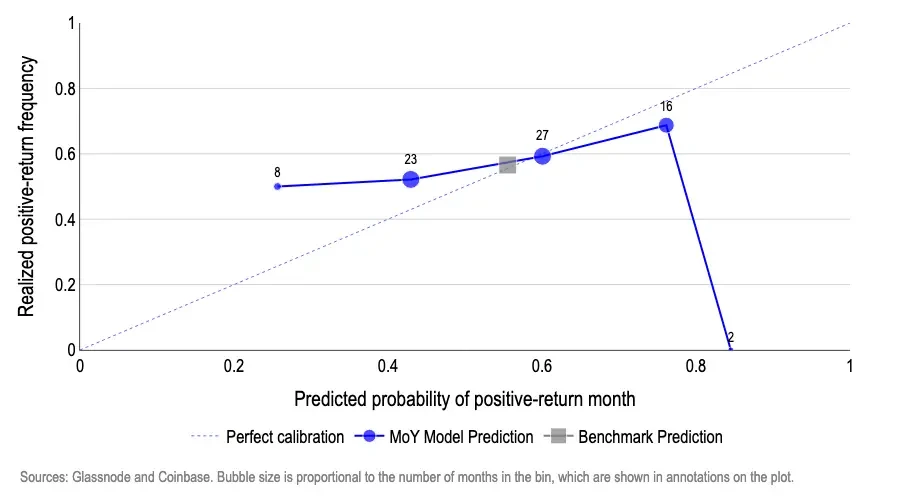
3. Out-of-sample forecasting: At each step, we re-estimate both models (initially trained on half the dataset) using only data up to that month:
- The baseline model is a logistic model with an intercept only, which simply predicts a constant probability equal to the historical proportion of positive return months to date (i.e., the base rate).
- The calendar month model is a logistic regression model that includes a month dummy variable and predicts the probability of the current calendar month being a rising month based on the performance characteristics of historical months.
Our results are presented in Exhibit 5, where (1) the horizontal axis represents the predicted probability of a month with positive log returns; (2) the vertical axis represents the percentage of months with actual positive returns. When plotting the predicted values, a perfectly calibrated model should have data points that lie along a 45-degree line, meaning that when the model predicts a 50% probability of a "positive month," 50% of the months should actually experience a positive return.
The month-on-month model shows significant deviations. For example:
- When the predicted probability of an increase was about 27%, the actual frequency was around 50% (too pessimistic); about 45-60% of the predictions were only roughly accurate.
- There is an overconfidence phenomenon in the high numerical range. For example, when the predicted value is about 75%, the actual occurrence is about 70%. In the extreme range, the predicted value is as high as about 85% but the actual occurrence rate is 0%.
In contrast, a model that consistently uses the historical base probability (approximately 55-57% monthly probability of an increase) as its forecast benchmark produces predictions that fall near the 45-degree line with little deviation. This is due to the fact that Bitcoin's monthly probability of an increase remains relatively stable over time. In short, this result suggests that calendar months have little predictive power in out-of-sample forecasts.
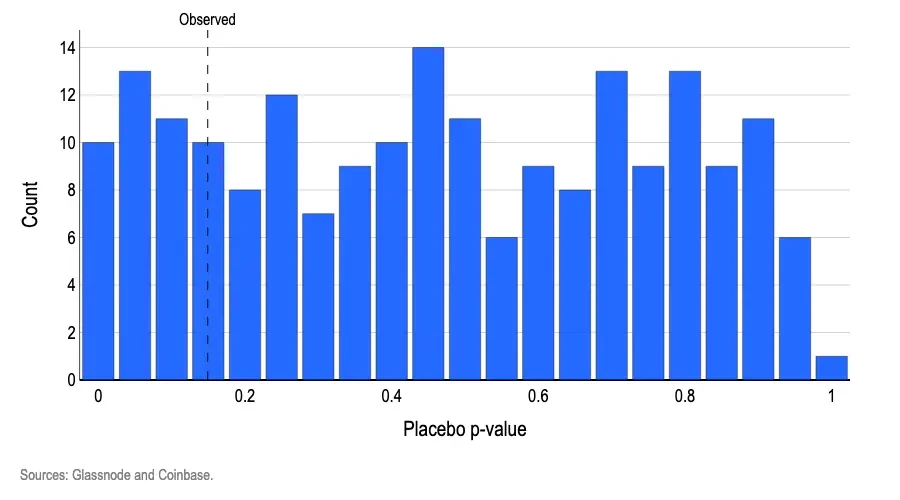
4. Pseudo-experimental Re-permutation Test: To test whether "month labels" help distinguish between positive and negative log returns, we fitted a simple logistic model with month dummies and conducted a within-group joint test (standard likelihood ratio joint test) to determine whether these dummies provide a better fit than the baseline model without month. The observed p-value obtained was 0.15, meaning that even if the month factor were unrelated, there would be approximately a 15% probability of a pattern at least this significant occurring by chance. We then randomly re-permuted the month labels thousands of times, re-running the same joint test after each re-permutation.
Thus, we find that approximately 19% of random permutations produce p-values as small as or smaller than the observed p-value (Exhibit 6).
Simply put, this result is very common under purely random conditions, further confirming the conclusion that there is no month signal. For the month labels to be statistically valid, two conditions must be met: the p-value of the joint test result on the real data should be less than 0.05, and the proportion of cases with p-values below this threshold in the data generated by random permutation should not exceed 5%.
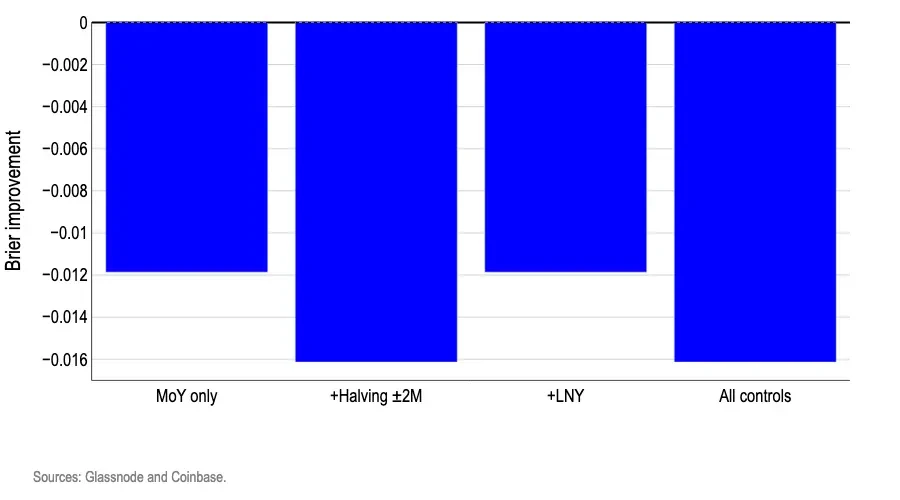
5. Control Variables: Adding real-world calendar markers does not unlock a tradable margin advantage and often worsens the predictive power of up and down signals. We re-estimated the "monthly upside probability" using the same month dummies. We then added real-world control variables for two major events: these events 1) may affect Bitcoin's log return and 2) do not occur in a specific month each year: Lunar New Year and the Bitcoin halving window (two months before and after). We only include control variables that occur in different calendar months each year to avoid redundant dummies that could destabilize model estimates.
This test aims to examine two common questions: (i) whether so-called "monthly effects" are actually cyclical events in disguise, such as liquidity changes during the Lunar New Year or the Bitcoin halving; and (ii) whether even weak monthly patterns may have predictive value after accounting for these drivers. We used half the dataset as a training set and half as a test set, and scored the monthly probability forecasts using the Brier score, a metric that assesses forecast accuracy by calculating the average squared difference between the predicted probability and the actual price fluctuation (i.e., the degree to which the predicted value deviates from the actual value).
The bar chart in Exhibit 7 shows Brier's improvement compared to a simple baseline that uses a single value: the historical ratio of rising months within the training window. All bars are below the zero line, meaning that each control variant underperforms the constant probability baseline. In short, introducing additional calendar markers on top of the month labels only adds noise.
Conclusion
The influence of seasonal factors on the market is deeply ingrained in investors' minds, even becoming a self-fulfilling prophecy. However, our model shows that if the probability of a monthly rise or fall is roughly consistent with the long-term historical average, it will outperform all trading strategies based on calendar cycles. This clearly demonstrates that calendar patterns do not contain truly valid predictive information and cannot be used to predict the direction of Bitcoin's monthly trend. Since calendar months cannot reliably predict the positive or negative direction of logarithmic returns, their ability to predict the magnitude of returns is even more remote. The historic drop in September and the so-called Bitcoin "October Upturn" may have statistical value, but neither meets the standard of statistical validity.
- 核心观点:加密牛市将持续至2025年第四季度。
- 关键要素:
- 流动性充足与宏观条件有利。
- 加密财库持有超100万枚BTC。
- 季节性因素统计无效。
- 市场影响:推动资金流向大型加密货币。
- 时效性标注:中期影响。