
ETF inflows slow, BTC at a crossroads
- 核心观点:比特币处于关键价格区间震荡。
- 关键要素:
- 11.4万美元为上涨关键阻力位。
- ETF资金流入减弱至日±500 BTC。
- 衍生品市场平衡吸收抛售压力。
- 市场影响:突破或跌破将决定短期走势方向。
- 时效性标注:短期影响。
Original article by Chris Beamish, CryptoVizArt, and Glassnode
Original translation: AididiaoJP, Foresight News
Bitcoin prices have been fluctuating between $110,000 and $116,000, with profit-taking and weakening ETF inflows weighing on upward momentum. Derivatives have a significant influence, with futures and options acting as a balancing force in the market. Reclaiming $114,000 is key to further gains, while a break below $108,000 could lead to further pressure.
summary
Bitcoin remains stuck in the "gap" range between $110,000 and $116,000 after retreating from its all-time high in August. The rebound from $107,000 was supported by bargain-hunting buyers, but selling pressure from short-term holders has so far limited upward momentum.
Profit-taking by holders of 3-6 months and loss-taking by recent buyers at highs are creating resistance. To sustain the rally, prices need to stabilize above $114,000 to rebuild confidence and attract inflows.
On-chain liquidity remains constructive but trending downwards, while ETF inflows have slowed to approximately ±500 BTC per day, weakening the traditional finance demand that previously drove rallies in March and December 2024.
With spot demand weakening, derivatives have become the primary driver. Futures basis and trading volumes remain balanced, while options open interest is rising, indicating a more risk-on market structure.
The market is at a crossroads, where reclaiming $114,000 could spark new upward momentum, while a break below $108,000 could expose the lower bound of the next cluster at around $93,000.
Range oscillation
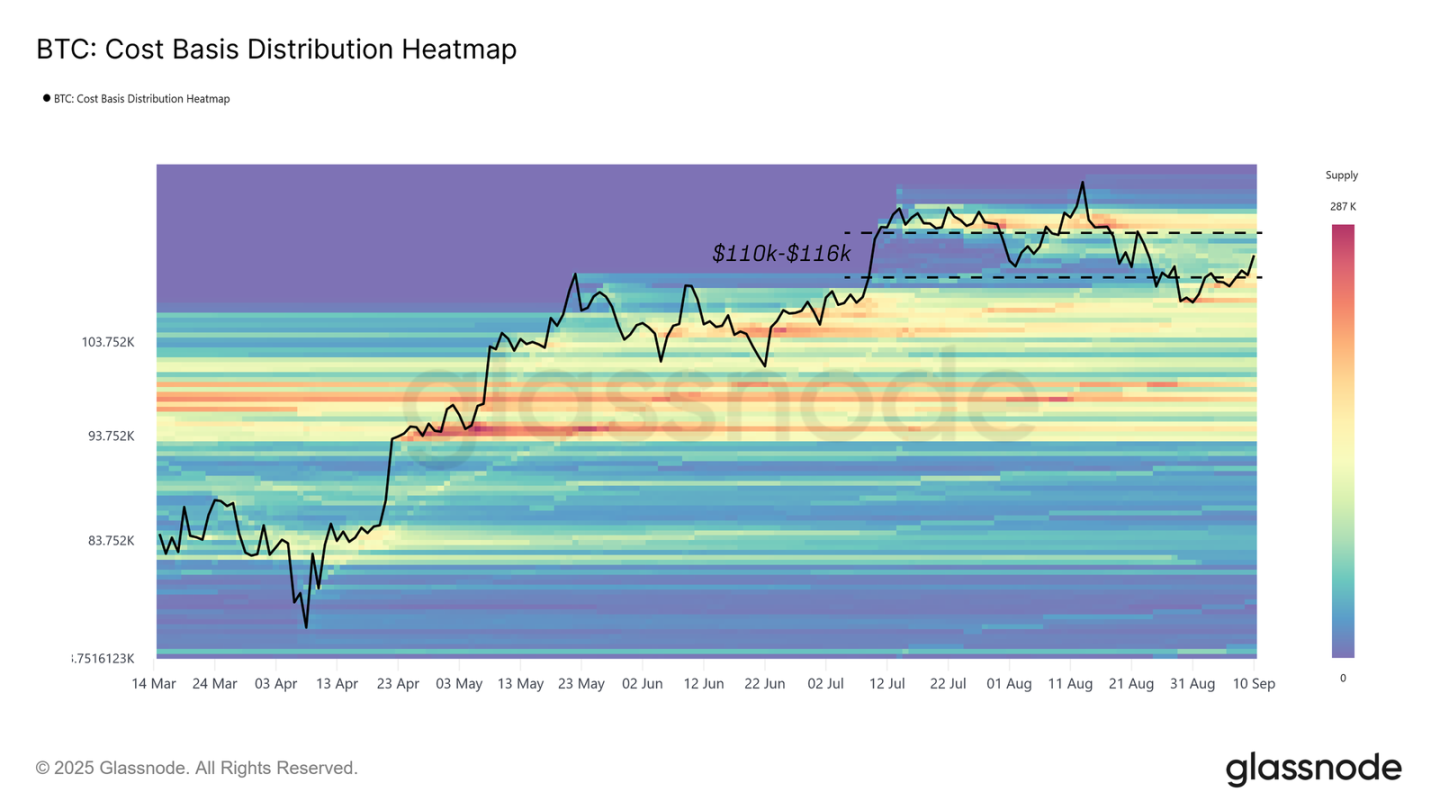
After reaching a new all-time high in mid-August, market momentum has continued to weaken, pulling Bitcoin below the cost basis of recent high-priced buyers and back into the "gap" range of $110,000 to $116,000. Prices have since fluctuated within this range, gradually filling the gap as supply redistributes. The key question now is whether this is a healthy consolidation or the first stage of a deeper correction.
As shown in the cost basis distribution, the rebound from $108,000 was supported by significant buying pressure on the chain, a "buy the dip" structure that helped stabilize the market.
This report examines seller dynamics and momentum across on-chain and off-chain indicators, focusing on the forces most likely to drive Bitcoin's next decisive breakout from this range.
Mapping supply clusters
First, we plot the cost basis of the cluster around the current price, as these levels often anchor short-term price action.
According to the heatmap, there are currently three different investor groups influencing price movements:
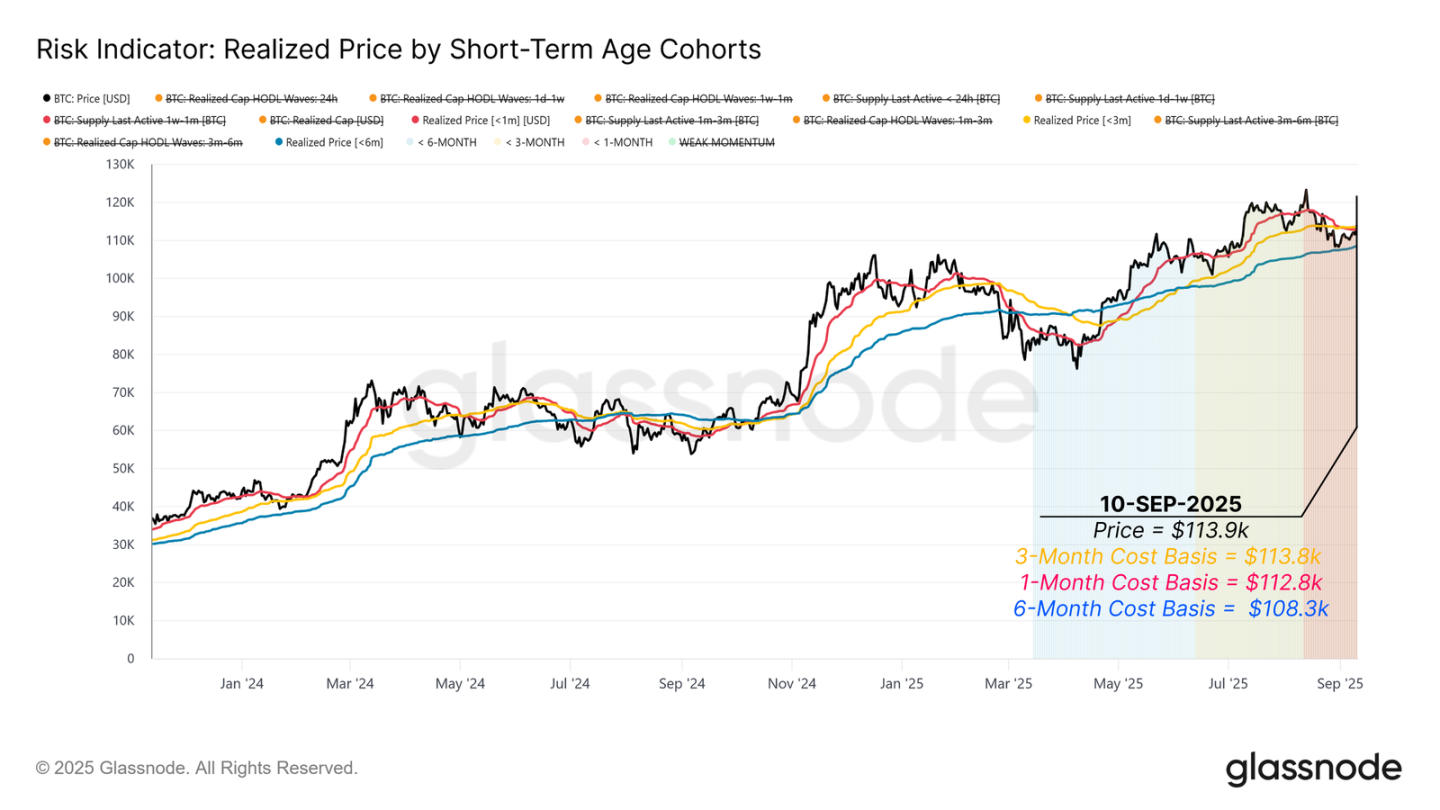
- Those who bought at the high end of the market over the past three months have a cost basis of nearly $113,800.
- Dip-buying in the past month has gathered around $112,800.
- For short-term holders over the past six months, the cost basis is anchored around $108,300.
These price levels define the current trading range. Reclaiming $113,800 would restore profits to buyers at the highs and propel the bullish trend to continuation. However, a break below $108,300 could plunge short-term holders back into losses, potentially triggering renewed selling pressure and opening the way for a drop to the lower boundary of the next major supply cluster at $93,000.
Experienced short-term holders took profits
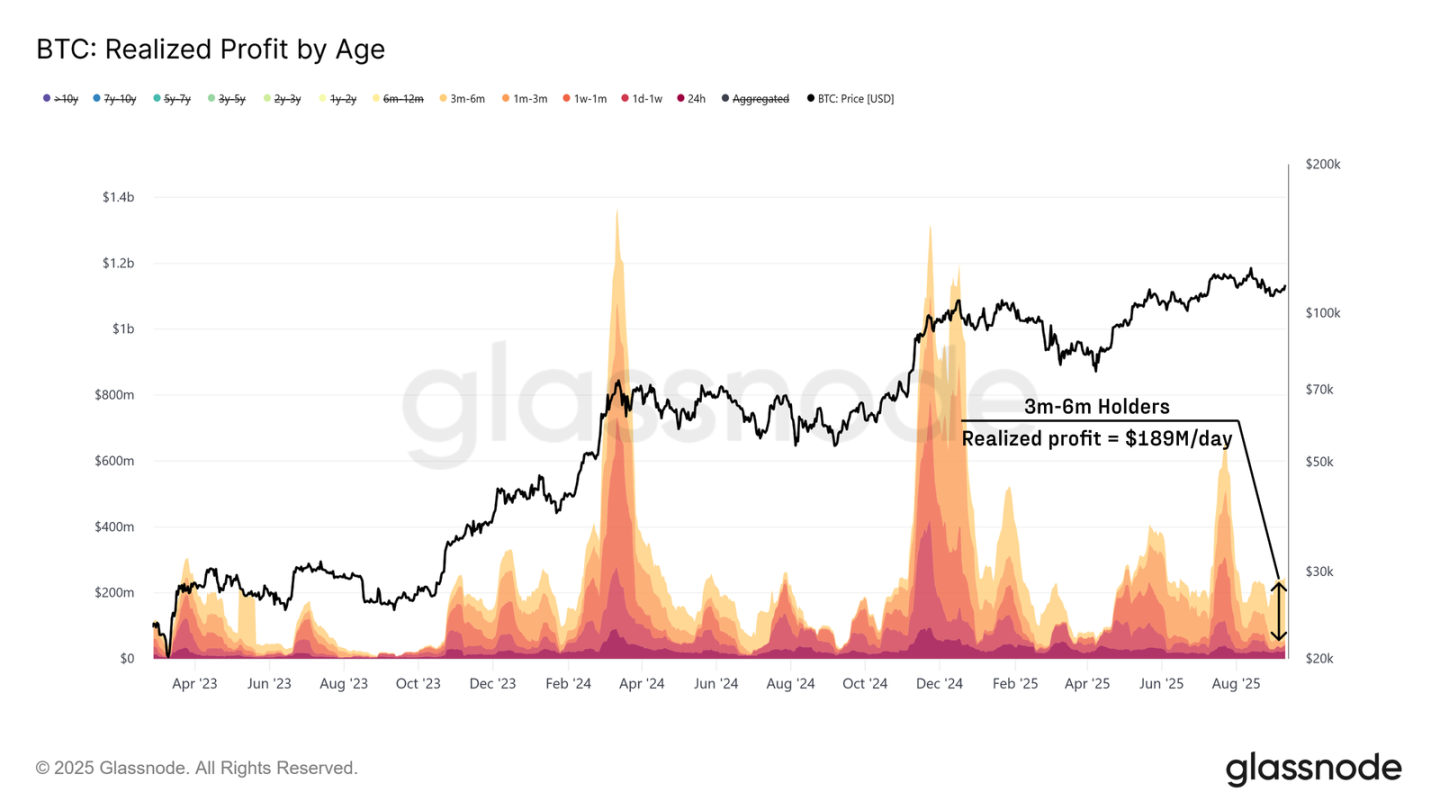
Having identified the immediate supply clusters shaping the range around the current price, we next examined the behavior of different groups of holders during the rally from $108,000 to $114,000.
While bargain hunters provided support, selling pressure primarily came from experienced short-term holders. Holders with a 3-6 month trading period realized approximately $189 million in profits daily, representing approximately 79% of all short-term holder profits. This suggests that investors who bought early during the February-May decline are taking profits on the recent rebound, creating significant resistance.
Buyers at high prices realize losses
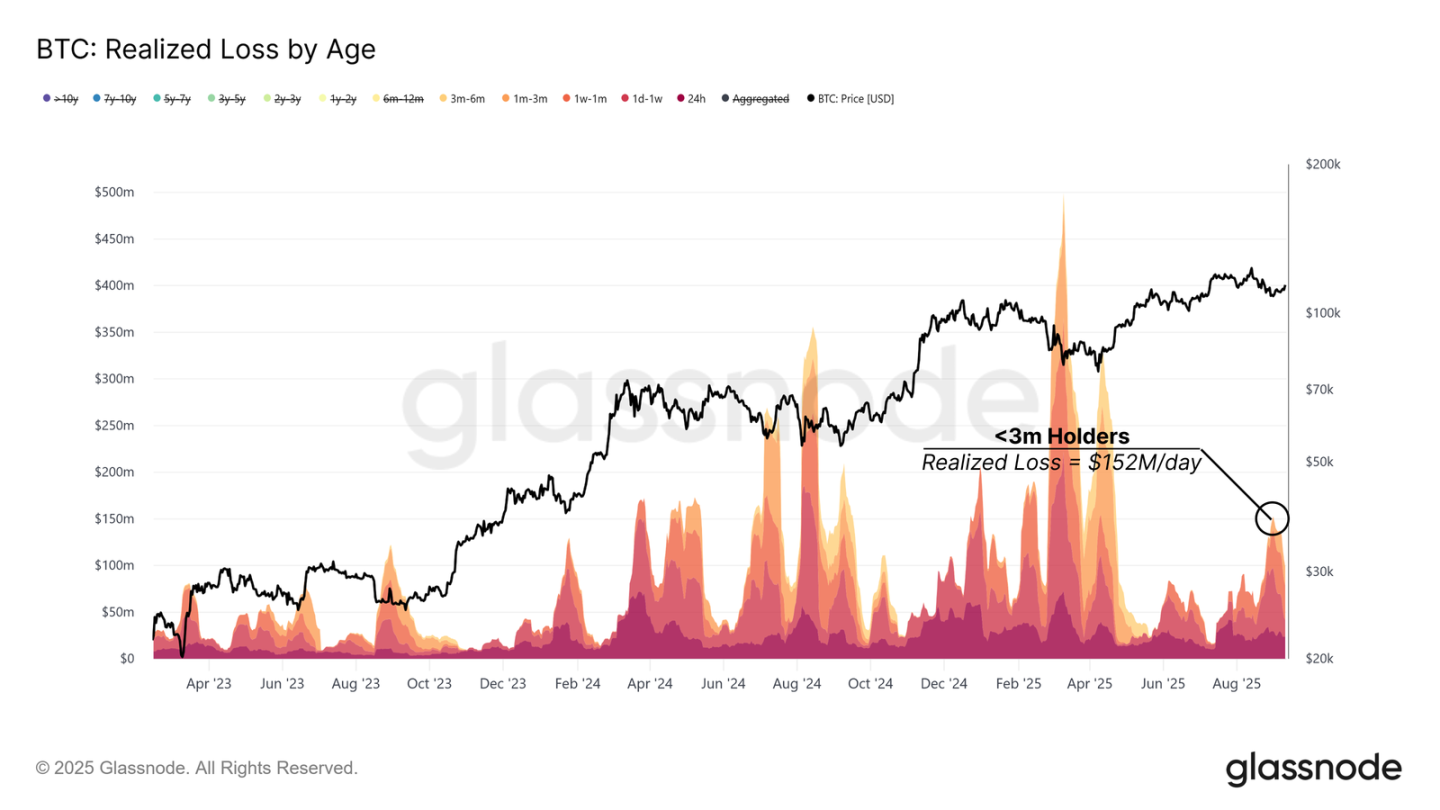
Besides profit-taking by seasoned short-term investors, recent buyers at the top have also weighed on the market by realizing losses during the same rally.
The group of holders as of 3 months ago is realizing losses of up to $152 million per day. This behavior mimics earlier periods of stress in April 2024 and January 2025, when buyers at the top capitulated in a similar fashion.
For a mid-term rally to resume, demand must be strong enough to absorb these losses. This would be confirmed if prices stabilize above $114,000, restoring confidence and encouraging new inflows.
Liquidity absorbs seller pressure
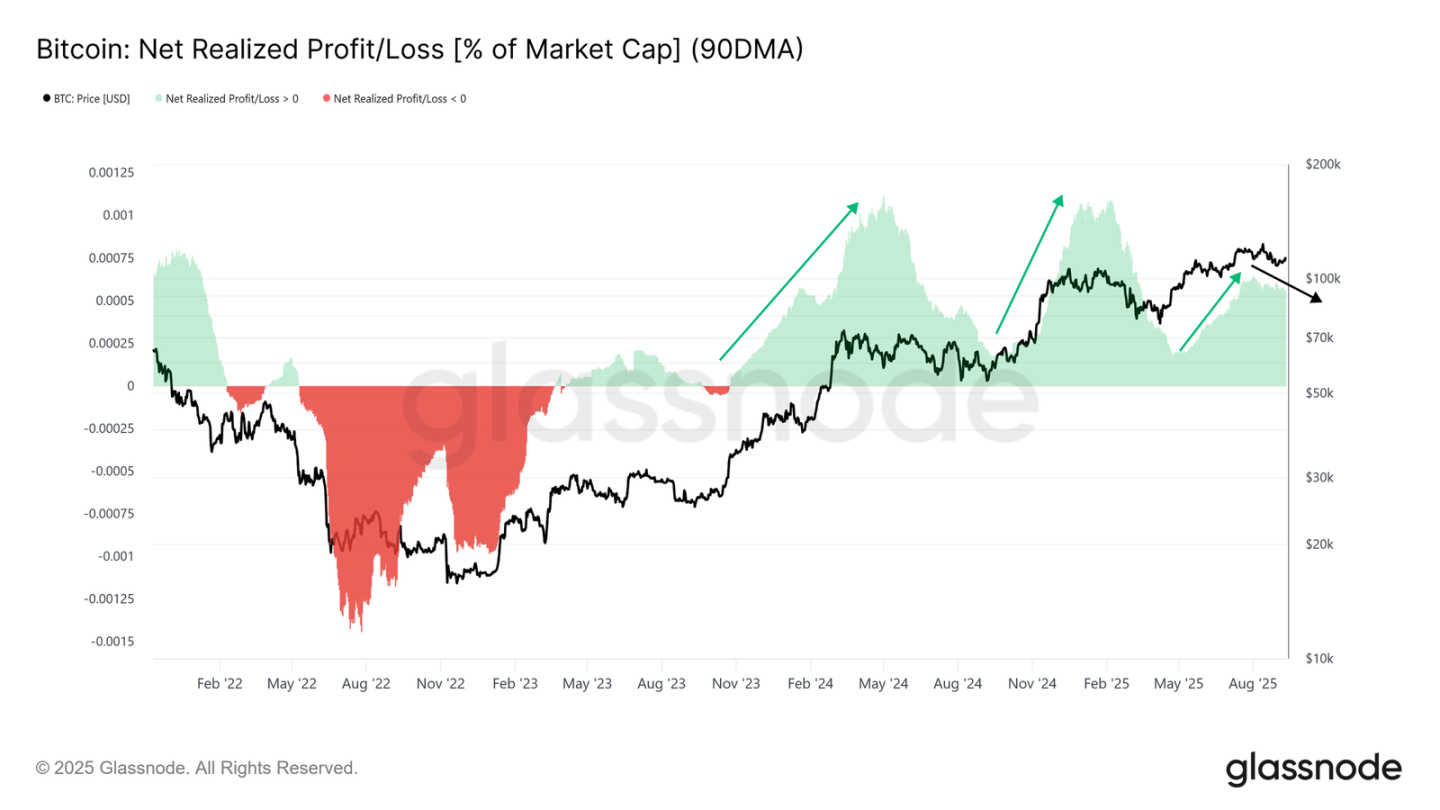
With both profit-taking and loss realization weighing on the market, the next step is to assess whether the new liquidity is strong enough to absorb these sellers.
Net realized profits, expressed as a percentage of market capitalization, provide this measure. The 90-day simple moving average peaked at 0.065% during the August rally and has been trending downward since then. While weaker than at the peak, current levels remain elevated, suggesting continued support from inflows.
As long as prices remain above $108,000, the liquidity backdrop remains constructive. However, a deeper decline could exhaust these inflows and hinder further rallies.
Traditional financial capital flows lose momentum
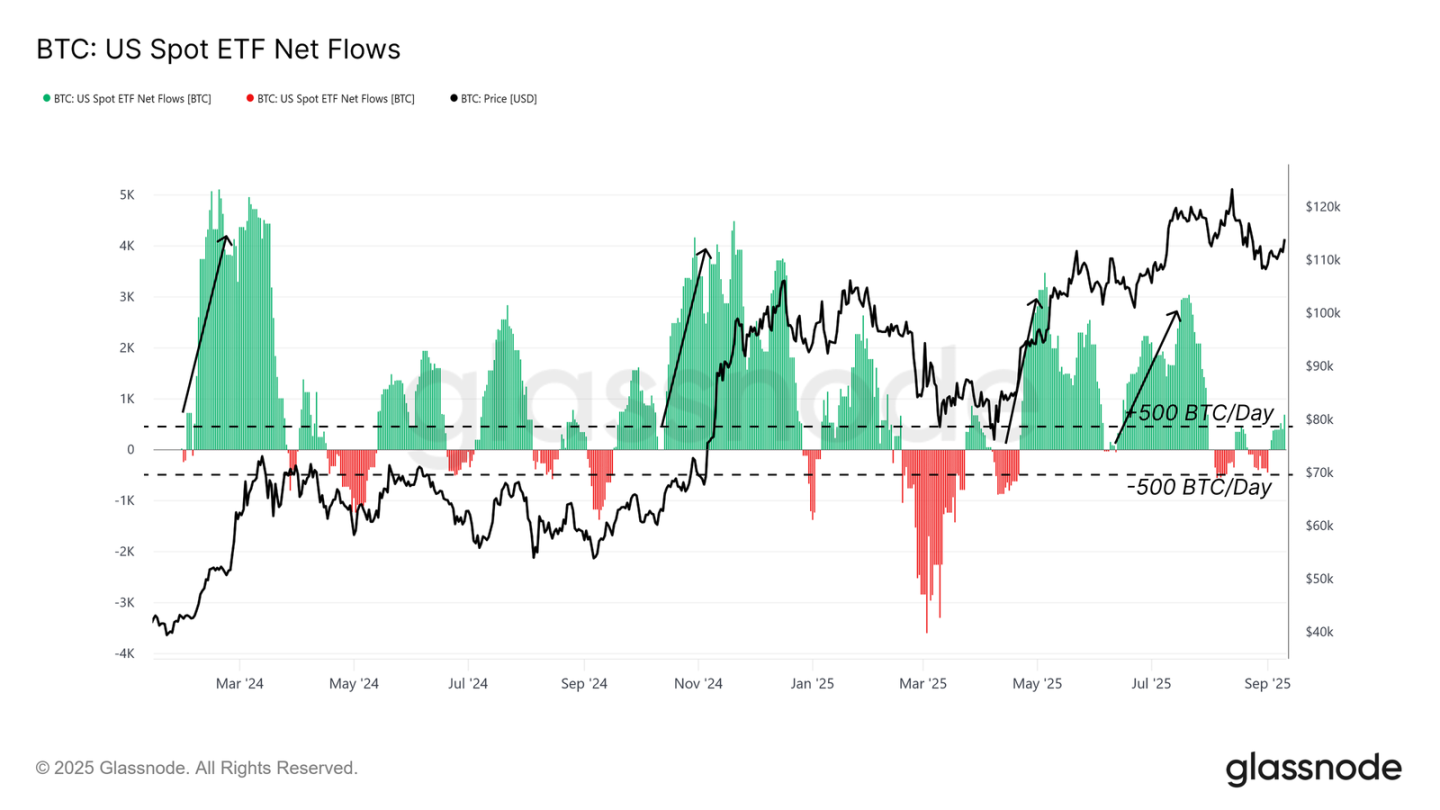
In addition to on-chain capital flows, it is also crucial to assess external demand through ETFs, which have been the main driver of this cycle.
Since early August, net inflows into US spot ETFs have declined significantly, currently hovering around ±500 BTC per day. This is significantly lower than the inflow intensity that supported the earlier rallies in this cycle, highlighting the loss of momentum among traditional financial investors. Given the key role ETFs play in driving the rally, their slowdown increases the fragility of the current structure.
Derivatives become the focus
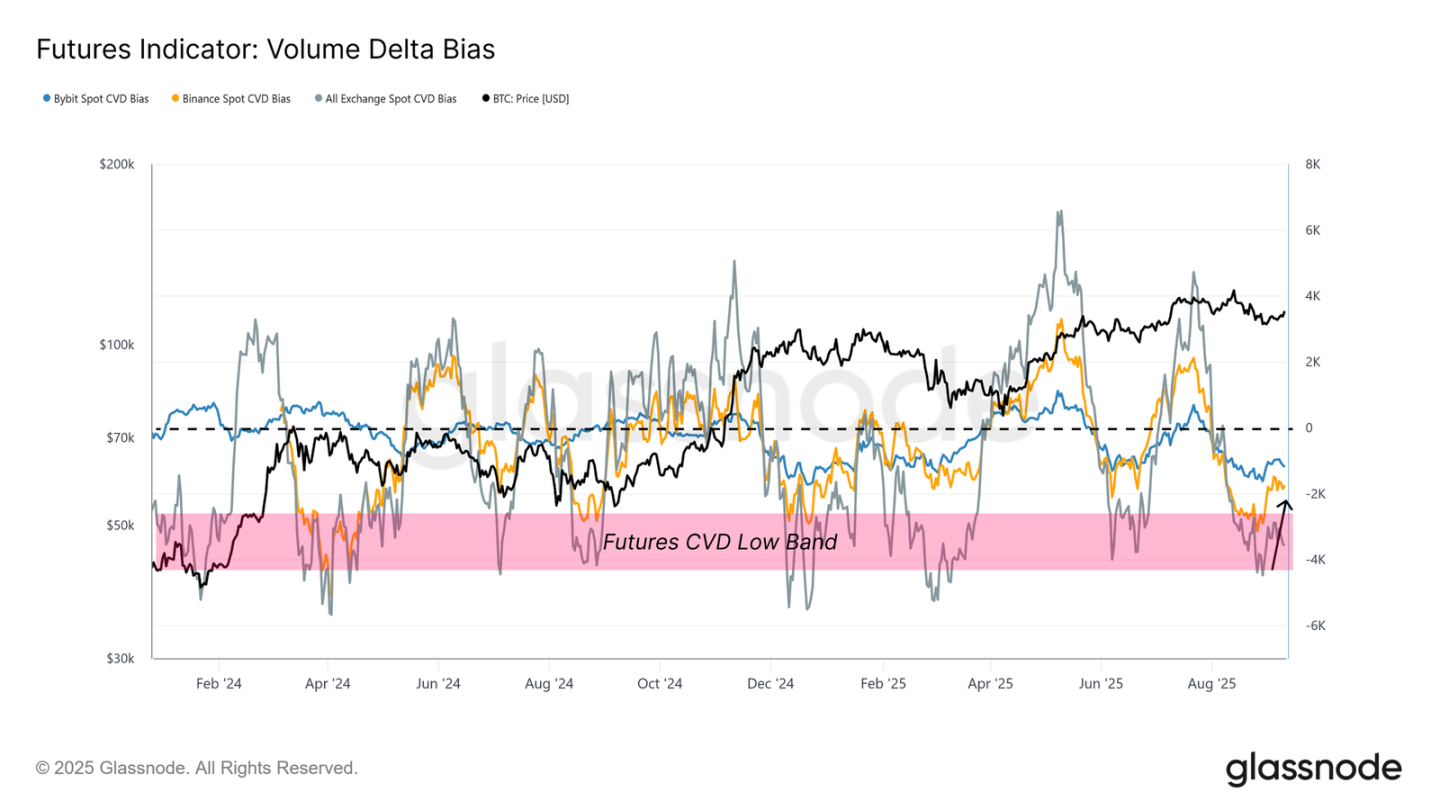
With on-chain liquidity weakening and ETF demand waning, attention is now turning to derivatives markets, which tend to set the tone when spot flows weaken.
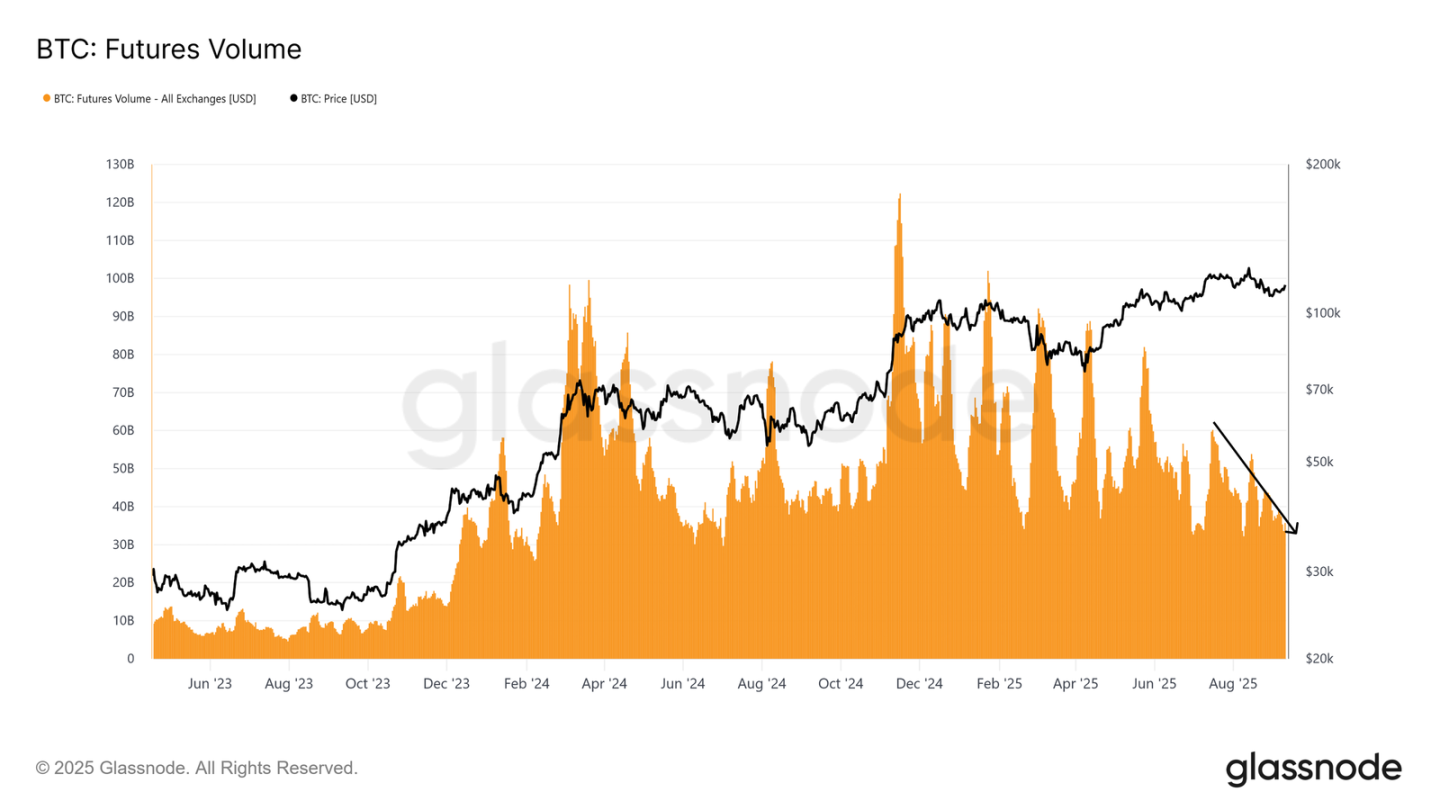
Volume Delta Skewness, which measures the deviation of cumulative volume from its 90-day median, recovered during the rally from $108,000, indicating seller exhaustion on exchanges like Binance and Bybit. This suggests that futures traders helped absorb recent selling pressure.
Looking ahead, the evolution of derivatives positions will be critical to navigating the market in this environment of low spot liquidity.
Balanced futures market
Digging deeper into the futures market, we find that the market appears balanced rather than overheated.
Despite higher prices, the 3-month annualized futures basis remains below 10%, reflecting steady demand for leverage without the extremes typically seen before liquidations. This suggests a healthier market structure, more aligned with accumulation than speculation.
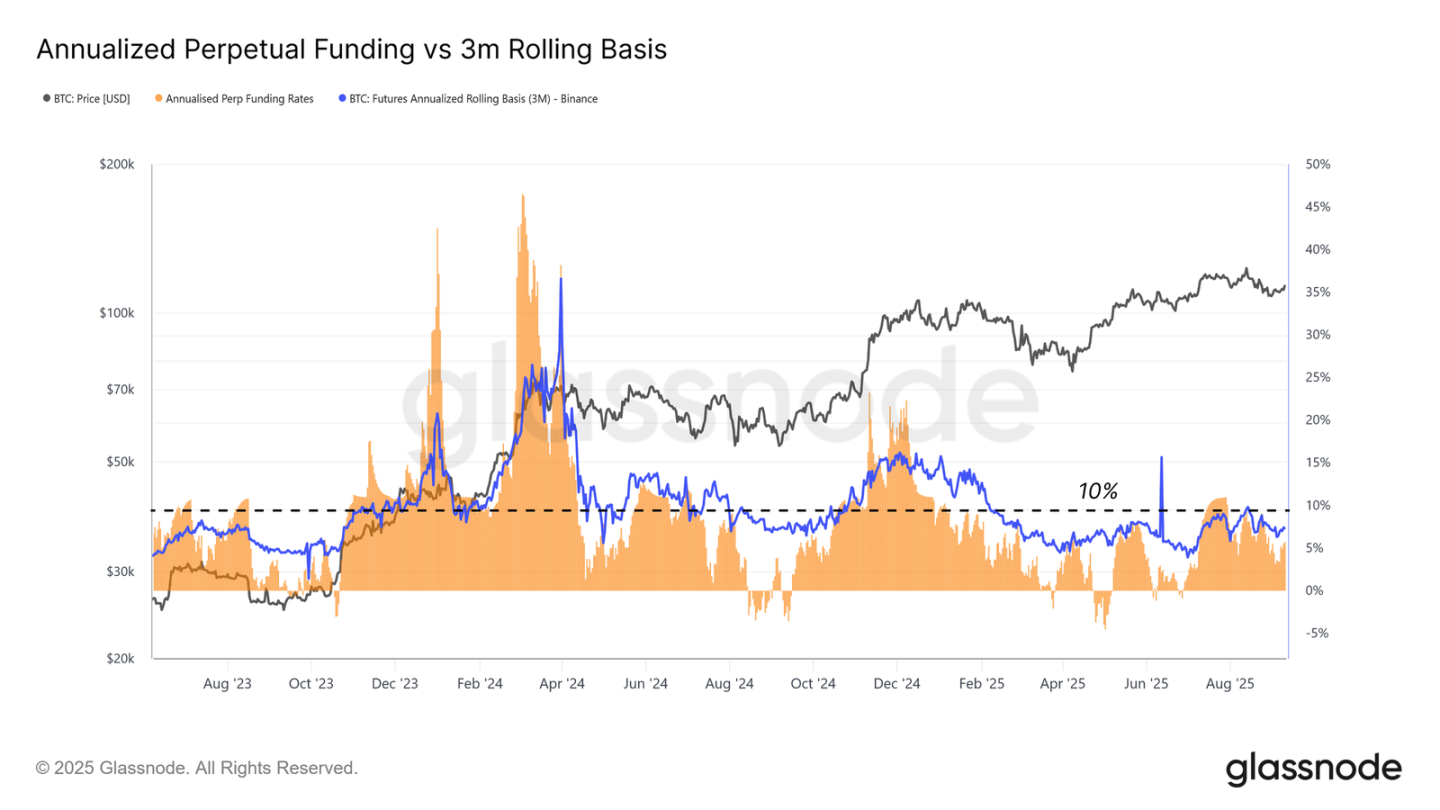
Perpetual futures trading volume also remains subdued, consistent with a typical post-mania lull. The lack of aggressive leverage spikes suggests the rally is built on more stable foundations rather than speculative excesses.
The growing role of options in risk management
Finally, options markets provide further insights into how participants manage risk and construct positions.
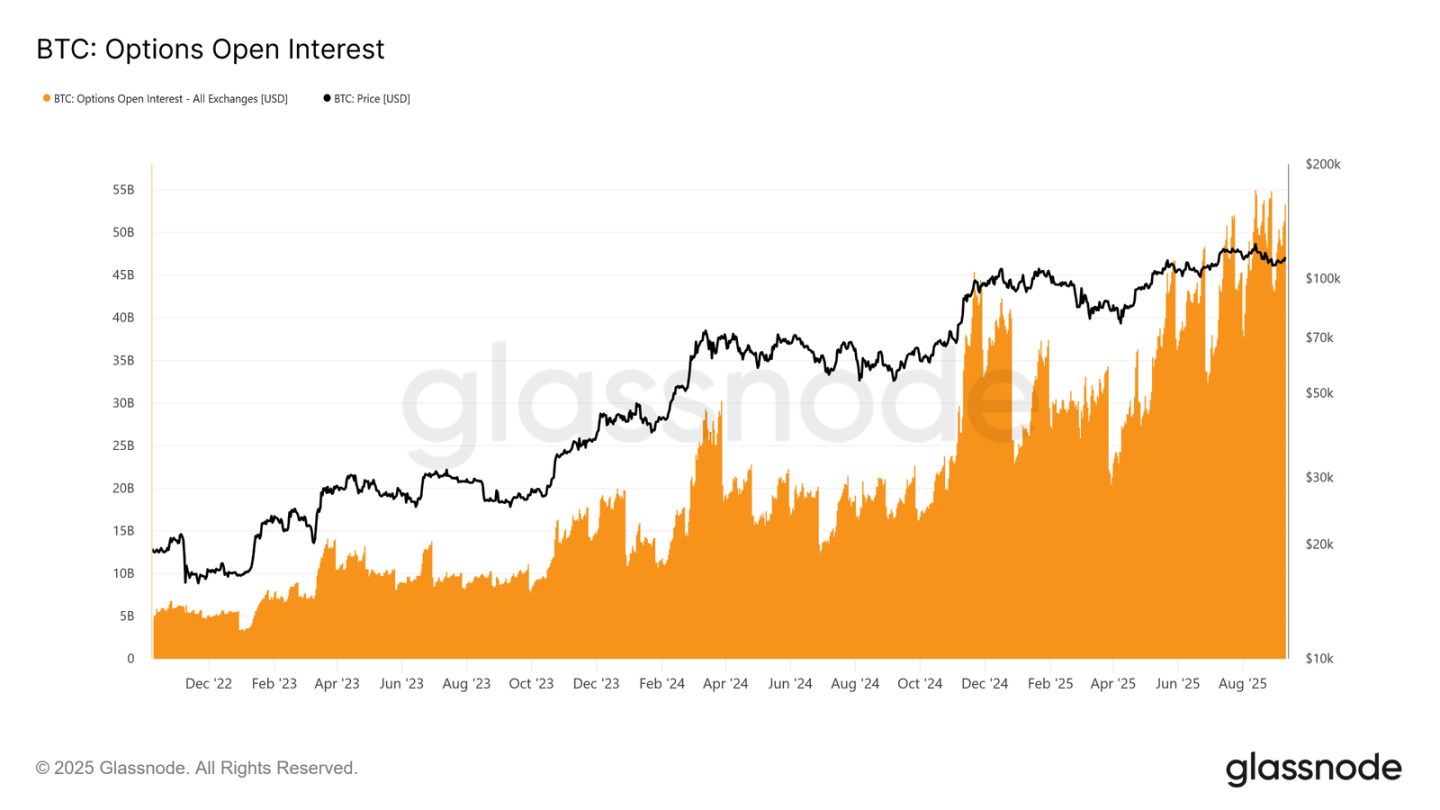
Bitcoin options open interest has reached a record high, reflecting its growing importance. With ETFs providing physical access, many institutions prefer to use options to manage risk, either through protective puts, covered calls, or risk-limited strategies.
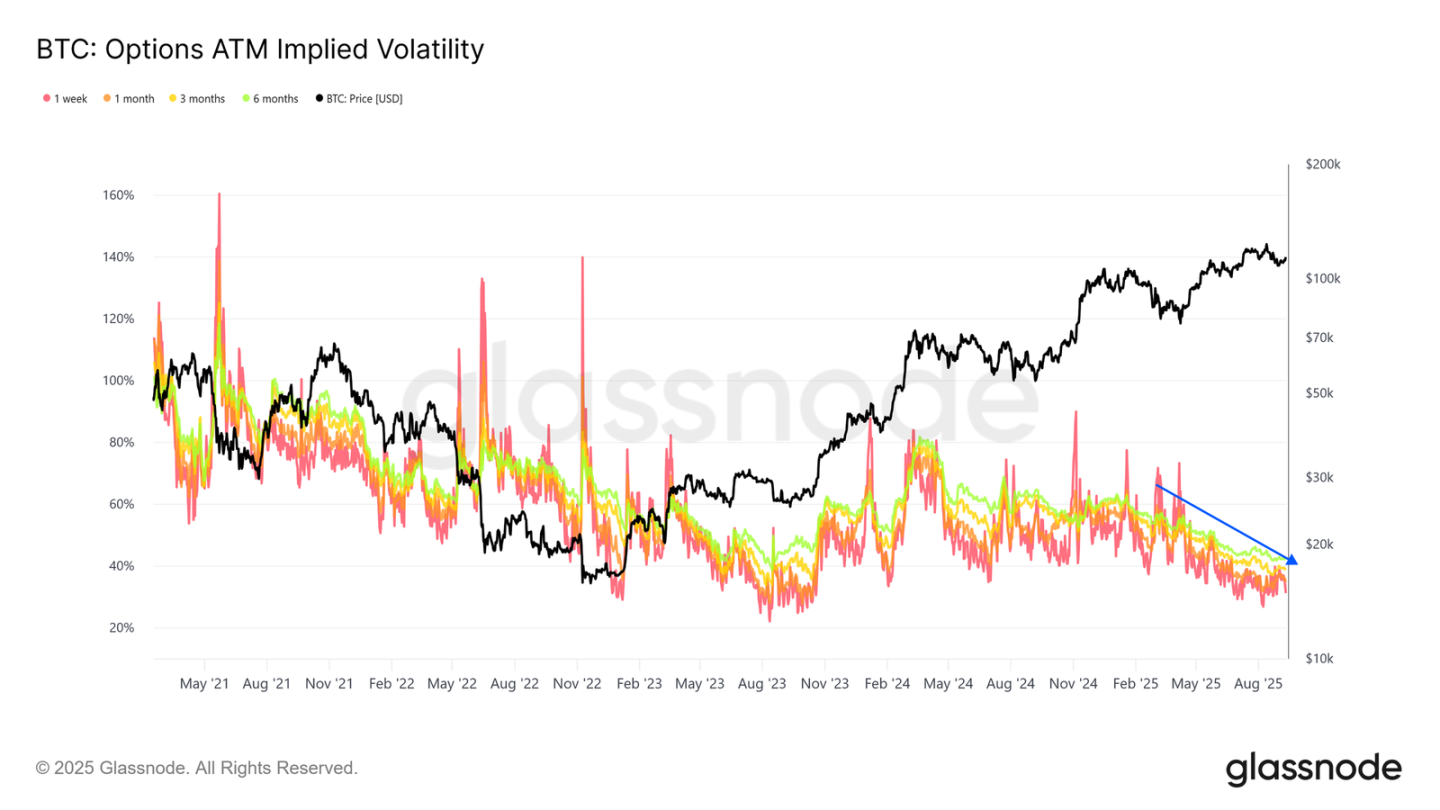
Implied volatility continues to decline, a sign of a more mature and liquid market. Volatility selling (a common traditional finance strategy) has put steady downward pressure on implied volatility levels, leading to more stable price action compared to past cycles.
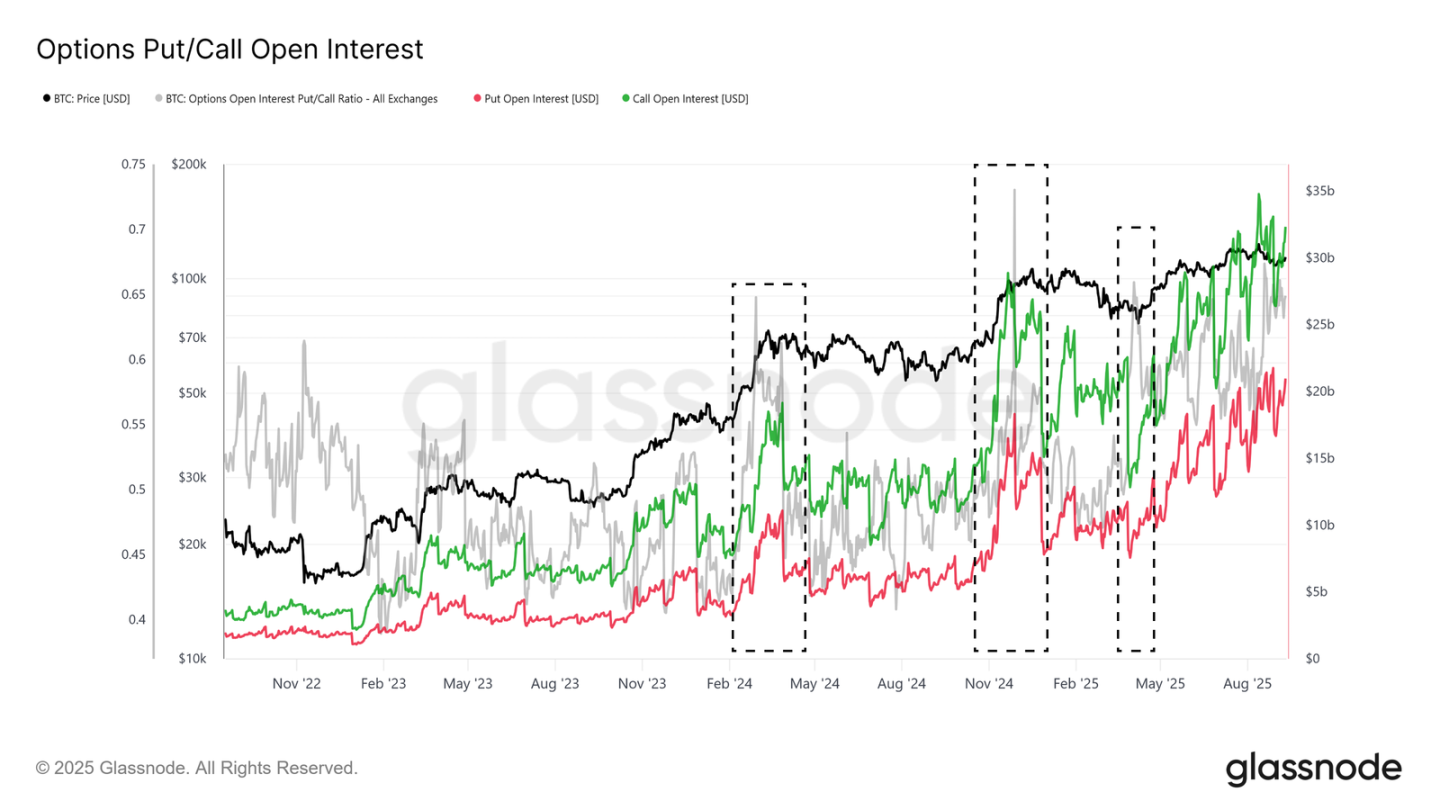
Open interest composition shows a significant outweighing of call options by puts, particularly during the topping phase, highlighting the market's bullish bias while still managing downside risk. Taken together, these developments suggest a healthier, more risk-managing market structure, potentially dampening any impending exuberance and bearish moves.
in conclusion
The Bitcoin market is currently characterized by a delicate balance between seller pressure and weakening inflows. Profit-taking by seasoned short-term holders, coupled with loss-taking by recent buyers at highs, has capped upward momentum and made the $110,000 to $116,000 range the primary battleground.
On-chain liquidity remains constructive but trending downward, while ETF flows, once the cornerstone of this bull cycle, have lost strength. Consequently, derivatives markets have become more important, with futures and options activity helping to absorb selling and influence price direction. Both futures basis and options positions reflect a more balanced structure than in past overheated phases, suggesting the market is advancing on a firmer foundation.
Looking ahead, reclaiming and holding $114,000 will be crucial to restoring confidence and attracting new inflows. Failure to do so could put renewed pressure on short-term holders, with $108,000 and ultimately $93,000 as key downside levels. In short, Bitcoin is at a crossroads, with derivatives support maintaining market structure while broader demand must strengthen to fuel the next sustained rally.


