
The Battle to Secure Bitcoin's $100,000 Price Reignites? Key Range Analysis and Market Change Signals
- 核心观点:比特币处于关键盘整区间,方向未定。
- 关键要素:
- 投资者在10.8-11.6万美元区间逢低吸筹。
- 短期持有者盈利比例反弹至60%,仍脆弱。
- ETF资金流入大幅放缓,需求减弱。
- 市场影响:短期波动加剧,需突破关键位确认趋势。
- 时效性标注:短期影响。
Original author: CryptoVizArt, UkuriaOC, Glassnode
Original translation: Chopper, Foresight News
summary
- Bitcoin is currently trading near $112,000, consolidating within the $104,000-$116,000 range. The Unspent Output Realized Price Distribution (URPD) indicates that investors have accumulated funds within the $108,000-$116,000 range. This suggests active bargain-hunting activity, but does not rule out further declines in the short to medium term.
- The price fell below the 0.95th percentile cost basis, marking the end of the three-and-a-half-month frenzy and returning to the $104,000-$114,000 range. Based on historical data, this range is often a sideways consolidation channel before the next clear trend forms.
- During the sell-off, the profit percentage of short-term holders (STH) plummeted from a high of 42% before rebounding to 60%. This rebound has left the market in a neutral but fragile state. A resumption of the uptrend would only be confirmed if prices reclaim the $114,000-$116,000 range.
- Off-chain sentiment is cooling: futures funding rates remain neutral but vulnerable, and ETF inflows have slowed significantly. Bitcoin ETF flows primarily reflect directional spot demand, while Ethereum ETF flows are a mix of spot demand and spot-futures arbitrage.
Range accumulation: accumulation behavior within the blank range
Since hitting an all-time high in mid-August, Bitcoin has entered a volatile downward trend, dropping to $108,000 before rebounding to around $112,000. With rising volatility, a key question arises: Is this the beginning of a true bear market, or just a short-term correction? We will analyze this using both on-chain and off-chain indicators.
The Unspent Transaction Output Realized Price Distribution (URPD) is an important starting point for analysis. It can show the current generation price of Bitcoin's unspent transaction outputs (UTXOs), providing insight into investors' cost range for building a position.
Comparing the snapshot on August 13 with the current structure, it can be seen that investors have taken advantage of the pullback opportunity to accumulate shares in the "blank range" of $108,000-116,000. This "buy on the dip" behavior is positive for the long-term trend, but it does not eliminate the risk of further pullbacks in the short to medium term.

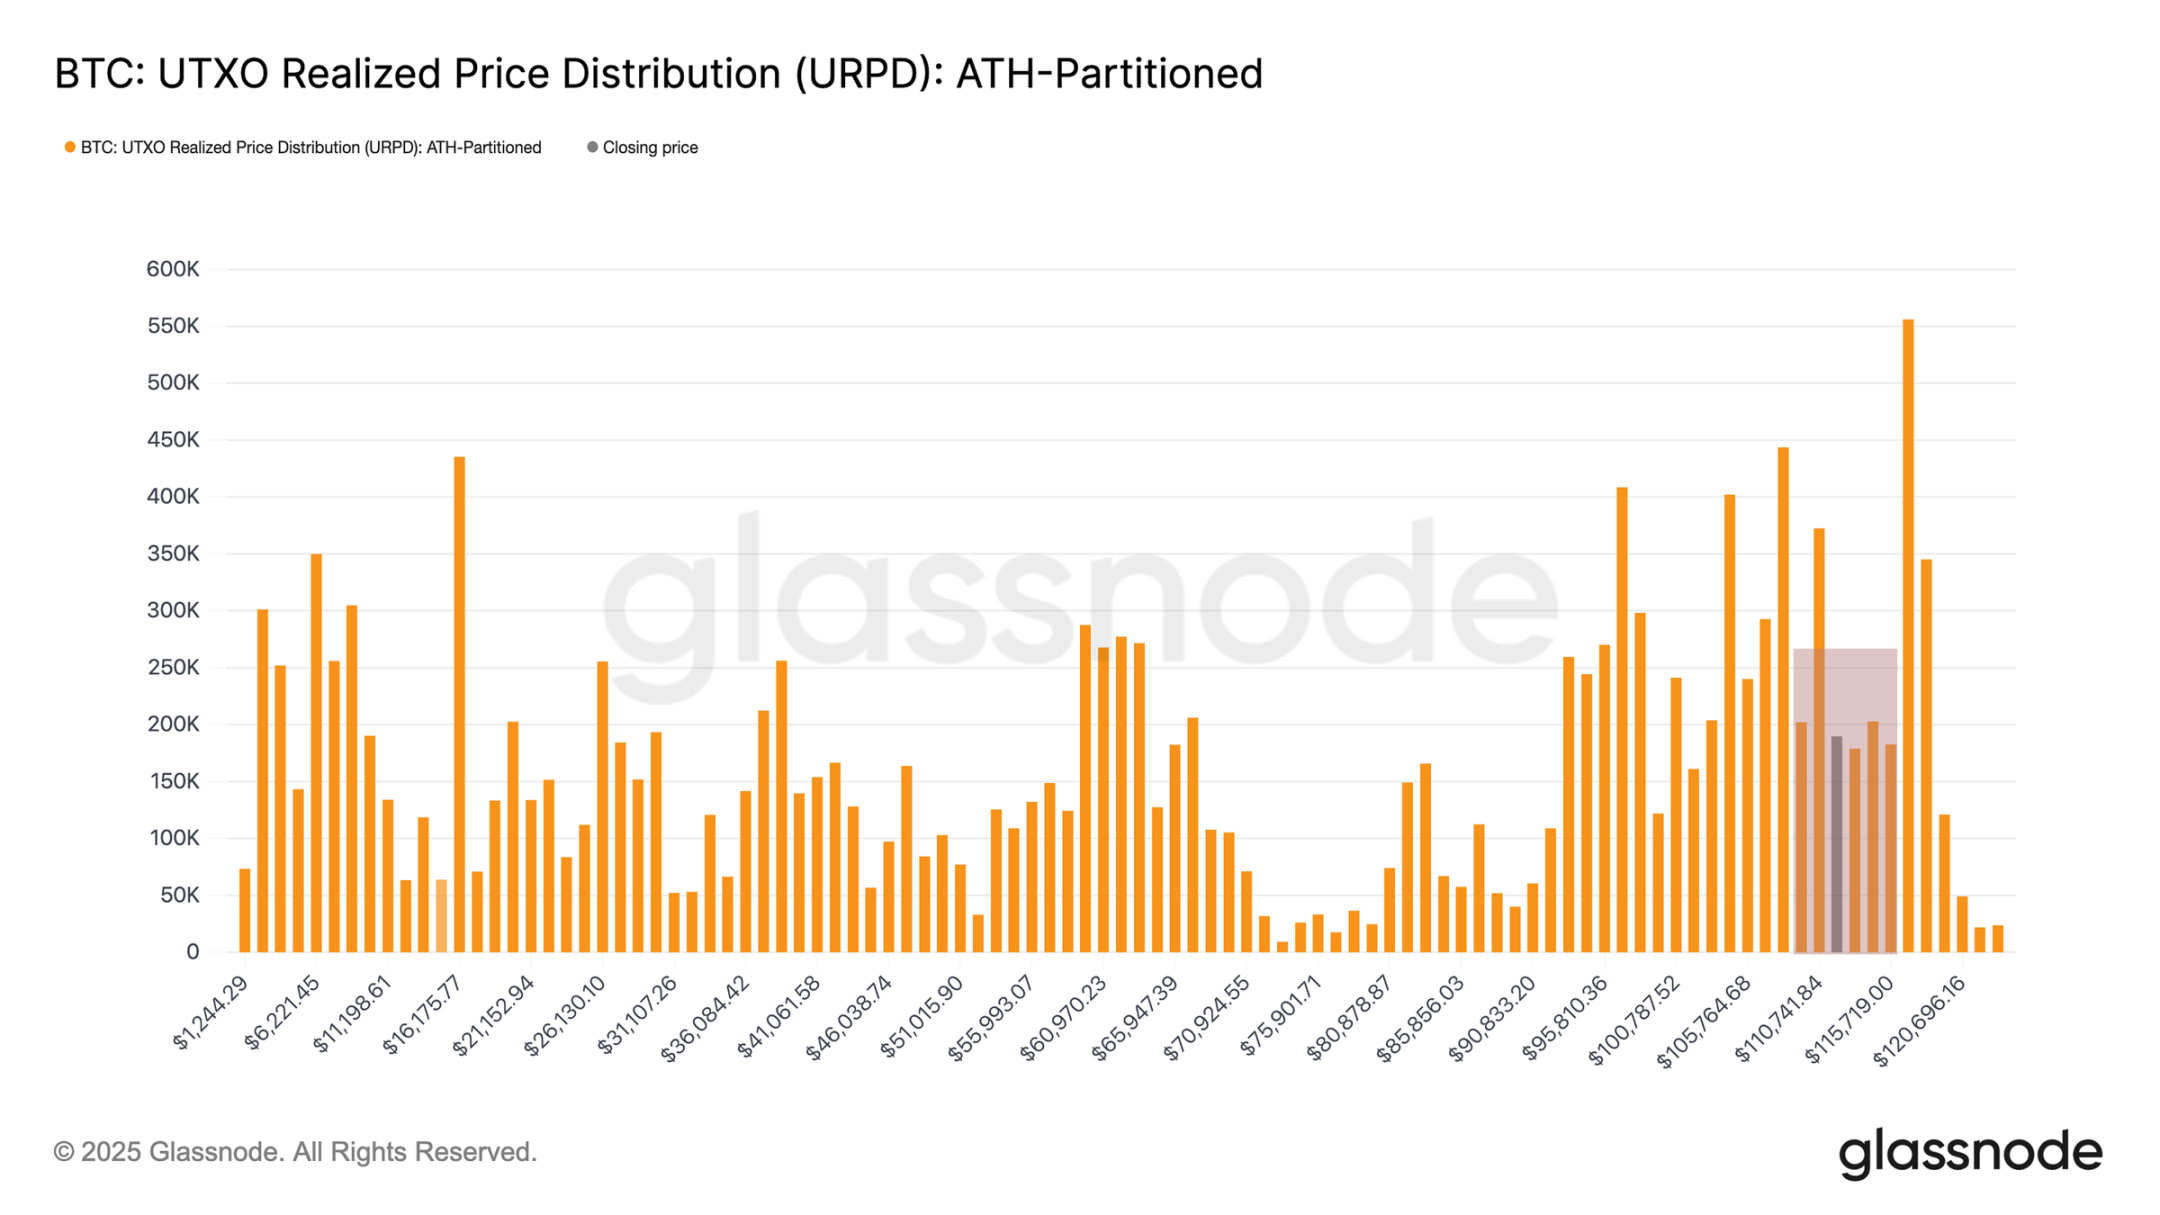
UTXO realized price distribution chart
From mania to exhaustion: the shift in cycle phases
While the URPD reflects aggressive dip-buying, the likelihood of continued market weakness needs to be considered within the broader cyclical context. The mid-August rally to new highs marked the third multi-month frenzy phase in this cycle, characterized by strong price momentum driving the vast majority of positions into profit-taking. Sustaining such phases requires a steady flow of capital to offset persistent profit-taking pressure, a dynamic that is often difficult to sustain over the long term.
This trend is captured by the 0.95th percentile cost benchmark (the price threshold at which 95% of chips are profitable). After the recent frenzy lasted about three and a half months, demand finally showed signs of fading, and Bitcoin fell below this benchmark range on August 19.
Currently, the price fluctuates between the 0.85-0.95 percentile cost basis, or $104,100-$114,300. Historically, this range is a consolidation channel after a frenzy peak, often resulting in a volatile sideways trend. Therefore:
- A drop below $104,100 could repeat the trend of "hitting a new high followed by exhaustion" in this cycle;
- Recovering $114,300 will indicate that demand has stabilized and the market has regained control of the trend.
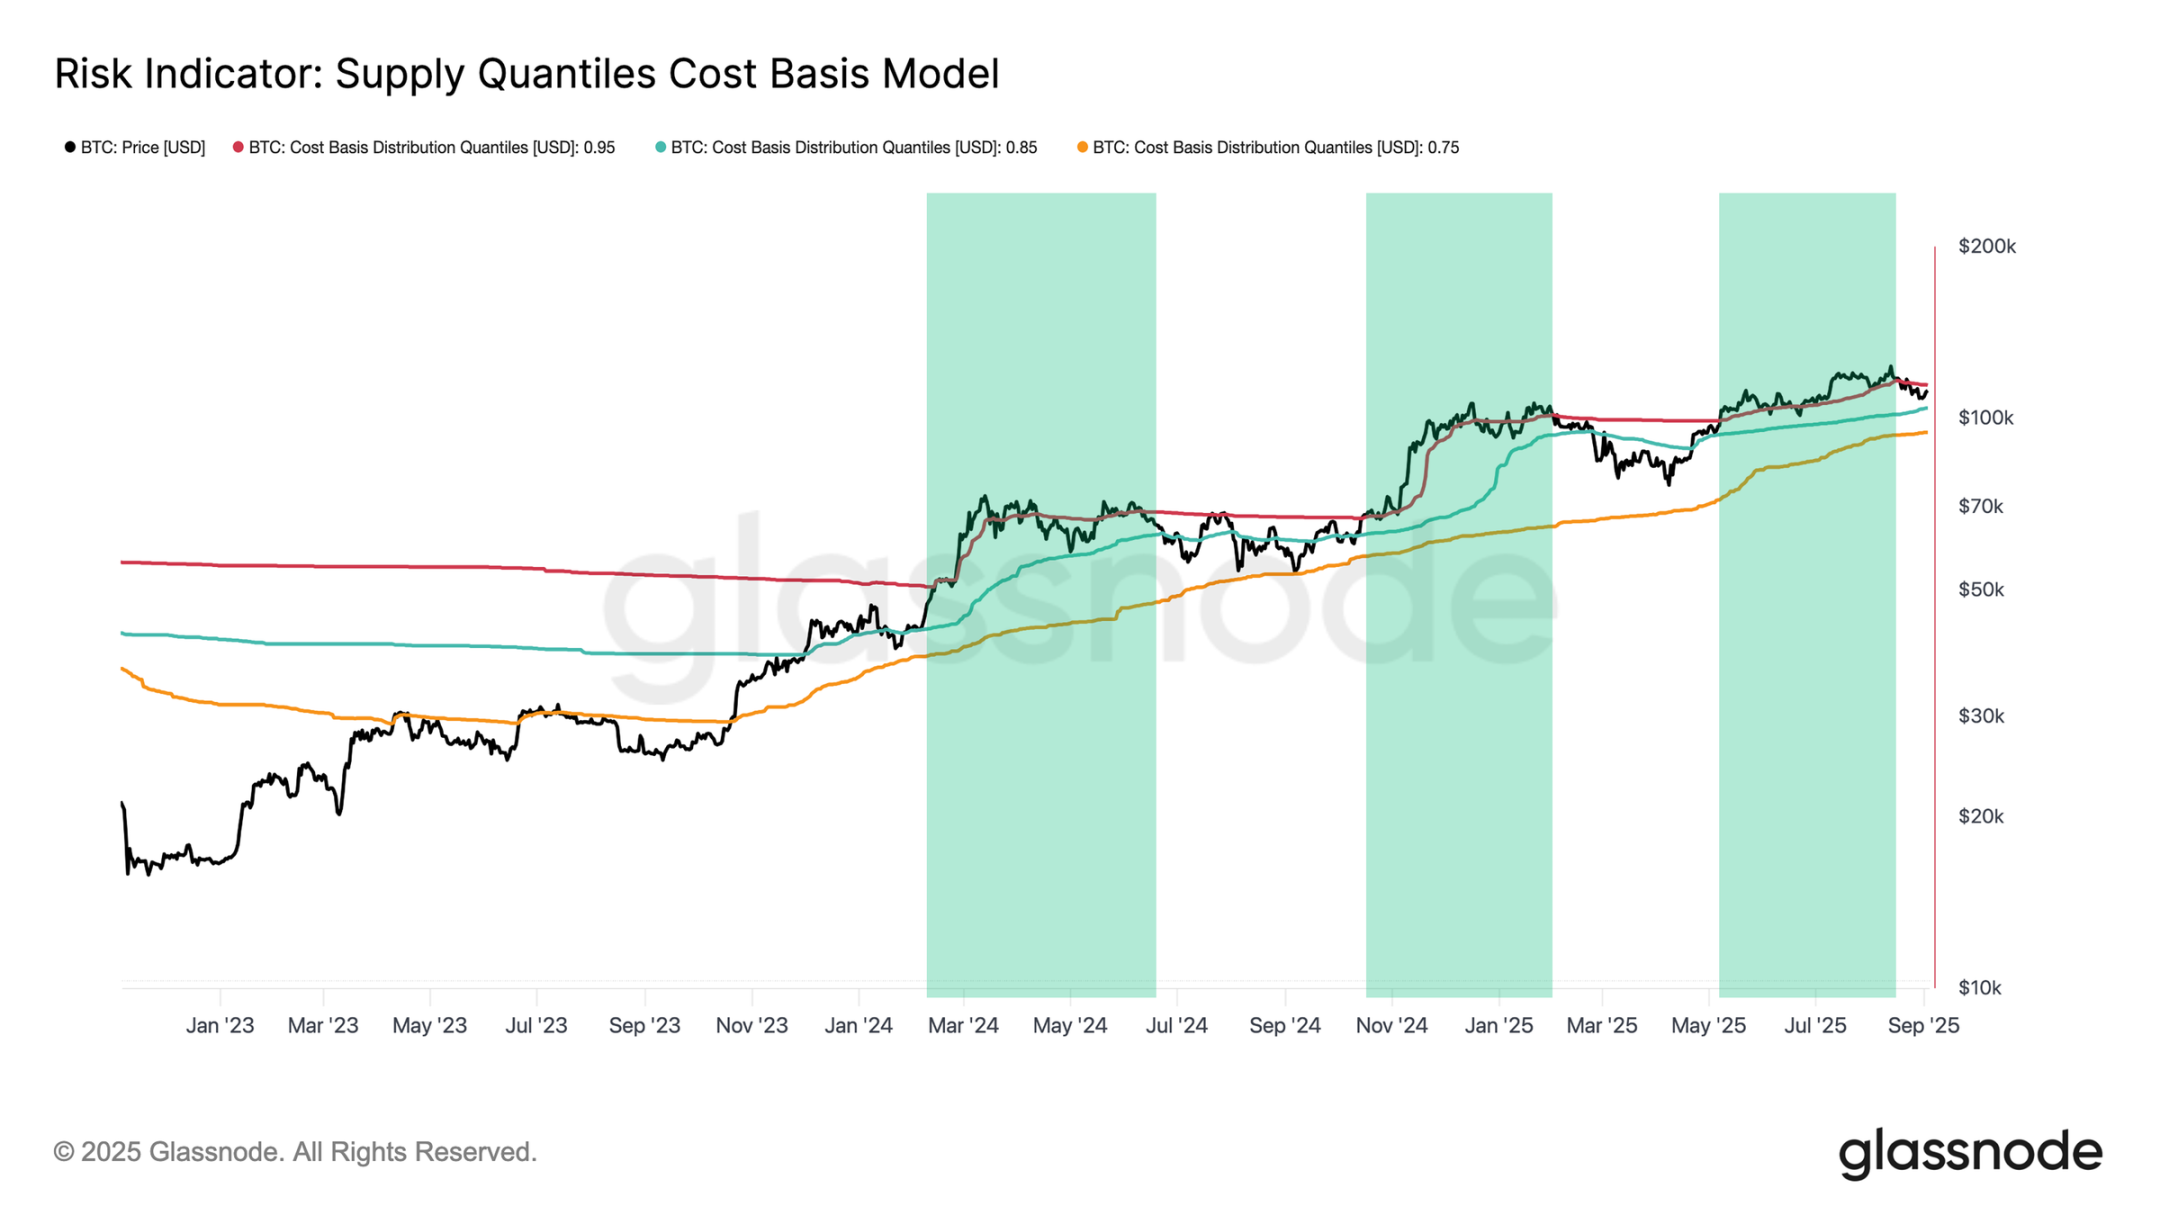
Chip Percentile Cost Benchmark Risk Indicator Chart
Short-term holders under pressure: a barometer of market sentiment
Given Bitcoin's current critical range, recent buyer behavior is crucial. Unrealized profits and losses (PLs) among short-term holders are often a core psychological factor influencing local tops and bottoms, and sudden shifts in P/L can directly influence their trading decisions.
The percentage of profitable short-term holders provides a clear indicator of this dynamic. During the price drop to $108,000, the percentage of profitable short-term holders plummeted from over 90% to 42%, a classic sign of cooling from "overheating" to "stress." Such sharp reversals typically trigger panic selling by buyers at elevated levels, which, once exhausted, drives a price rebound, explaining the recent rally from $108,000 to $112,000.
At current prices, the proportion of short-term holders who are profitable has rebounded to over 60%, which is neutral compared to the extreme levels of recent weeks, but this rebound remains fragile. Only a sustained recovery of the $114,000-$116,000 range (at which point over 75% of short-term holders will be profitable) will build sufficient confidence to attract new funds and drive the next leg of the rally.
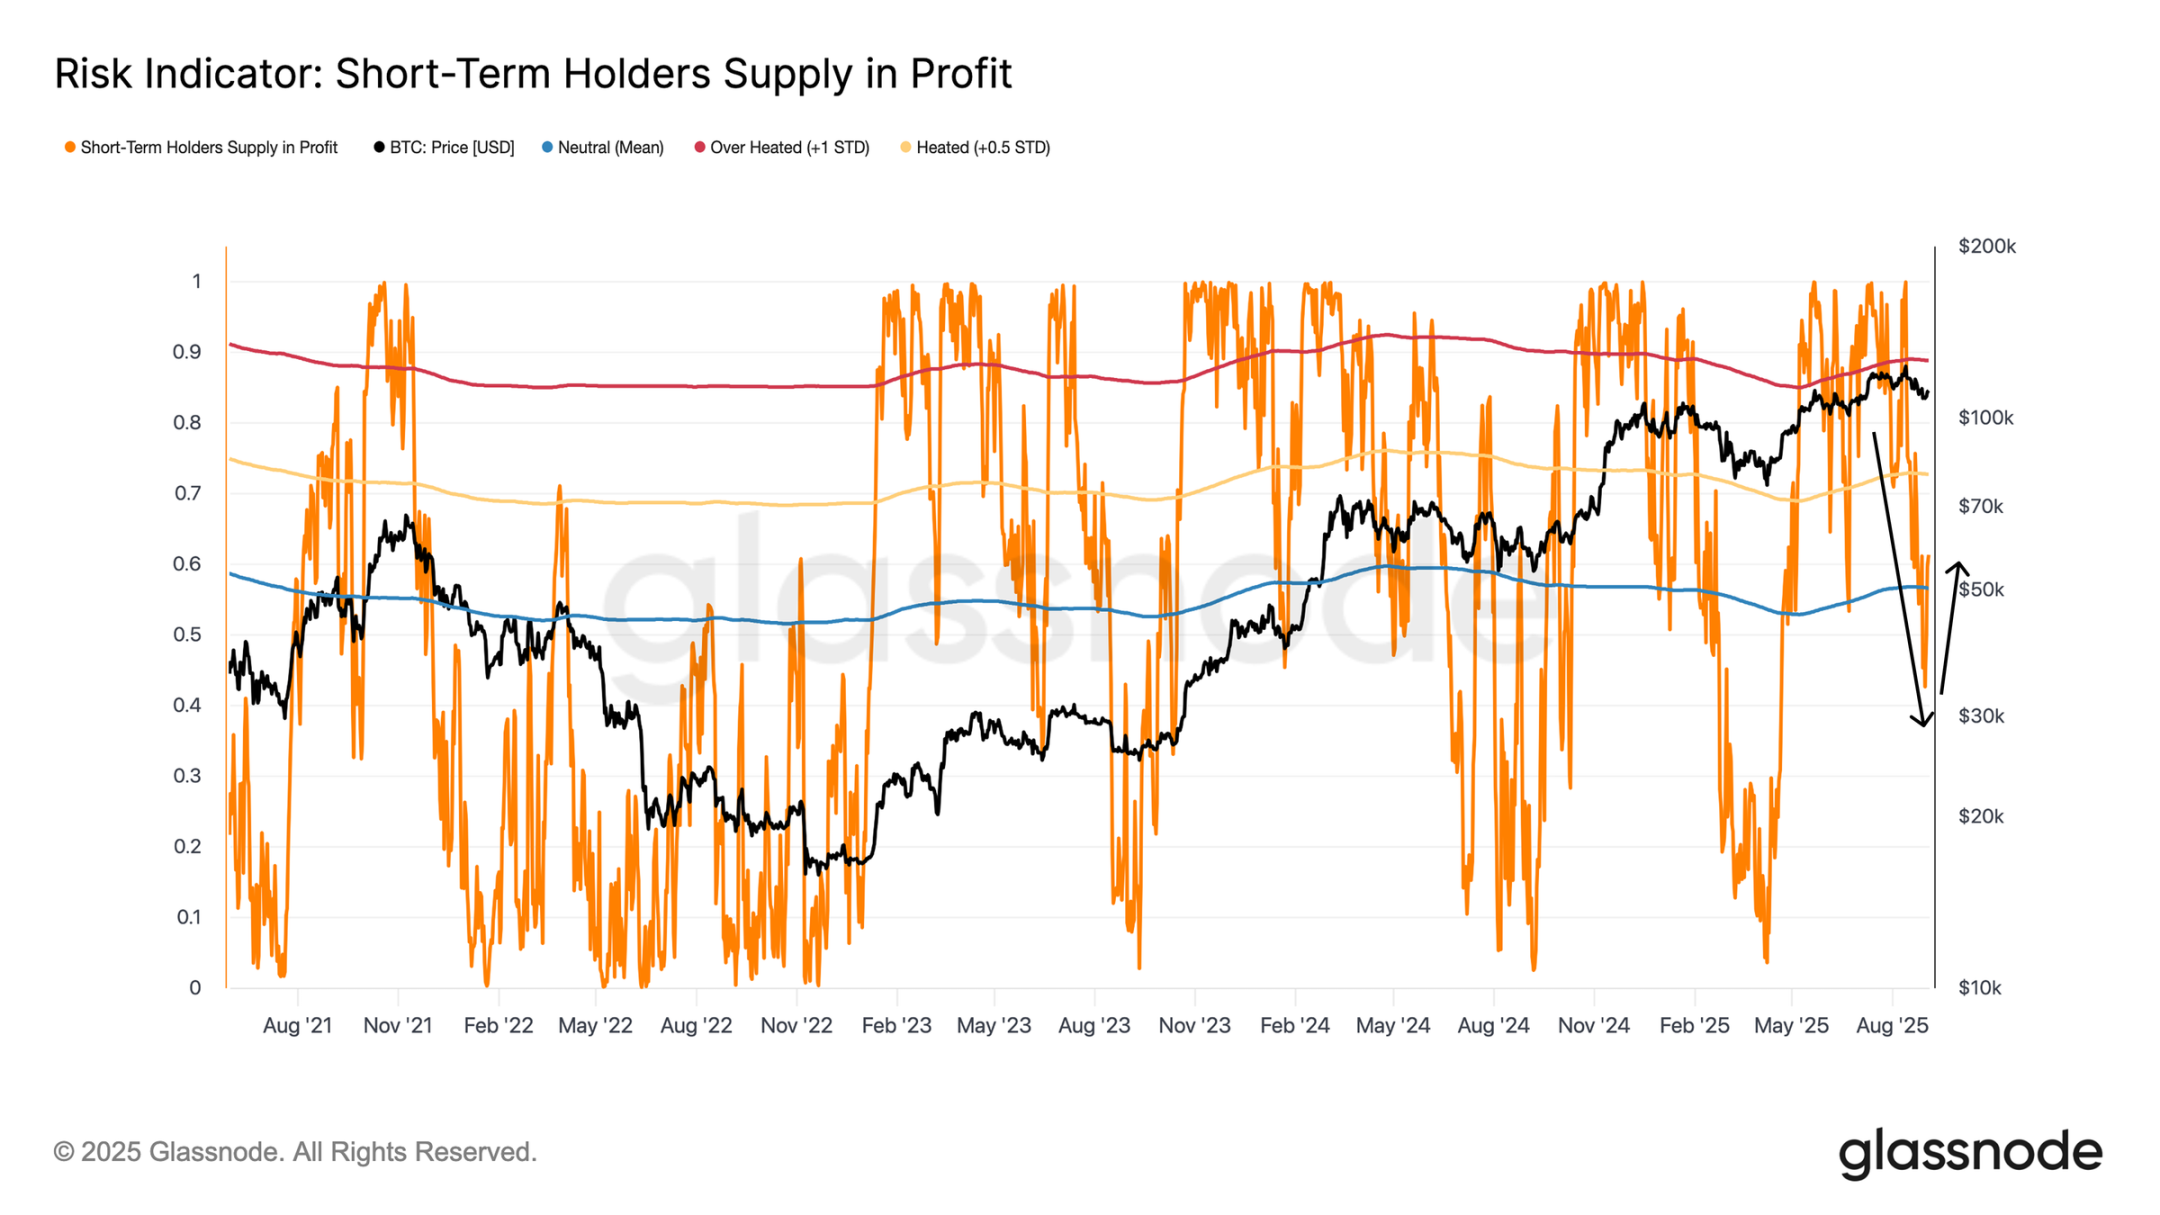
Short-term holders' profit ratio risk indicator chart
Sentiment Detection: Signals in Futures and ETF Markets
After analyzing on-chain price patterns and short-term holder profitability, the next step is to determine whether off-chain indicators are consistent with these signals or whether there are disagreements.
Among off-chain indicators, futures markets (particularly perpetual swaps) are the most sensitive to shifts in overall sentiment. Funding rates (the hourly interest paid by longs to shorts for holding their positions) are a direct indicator of speculative demand: high rates indicate an overheated market, while drifting toward zero or negative values suggests weakening momentum.
In this cycle, $300,000/hour is the benchmark dividing bull and bear sentiment. The current funding rate is approximately $366,000/hour, placing the market in a neutral range—neither reaching the overheated peaks of over $1 million/hour seen in March and December 2024, nor cooling below $300,000/hour seen in the first and third quarters of 2025. A further drop below this benchmark would confirm a general weakening of futures market demand.
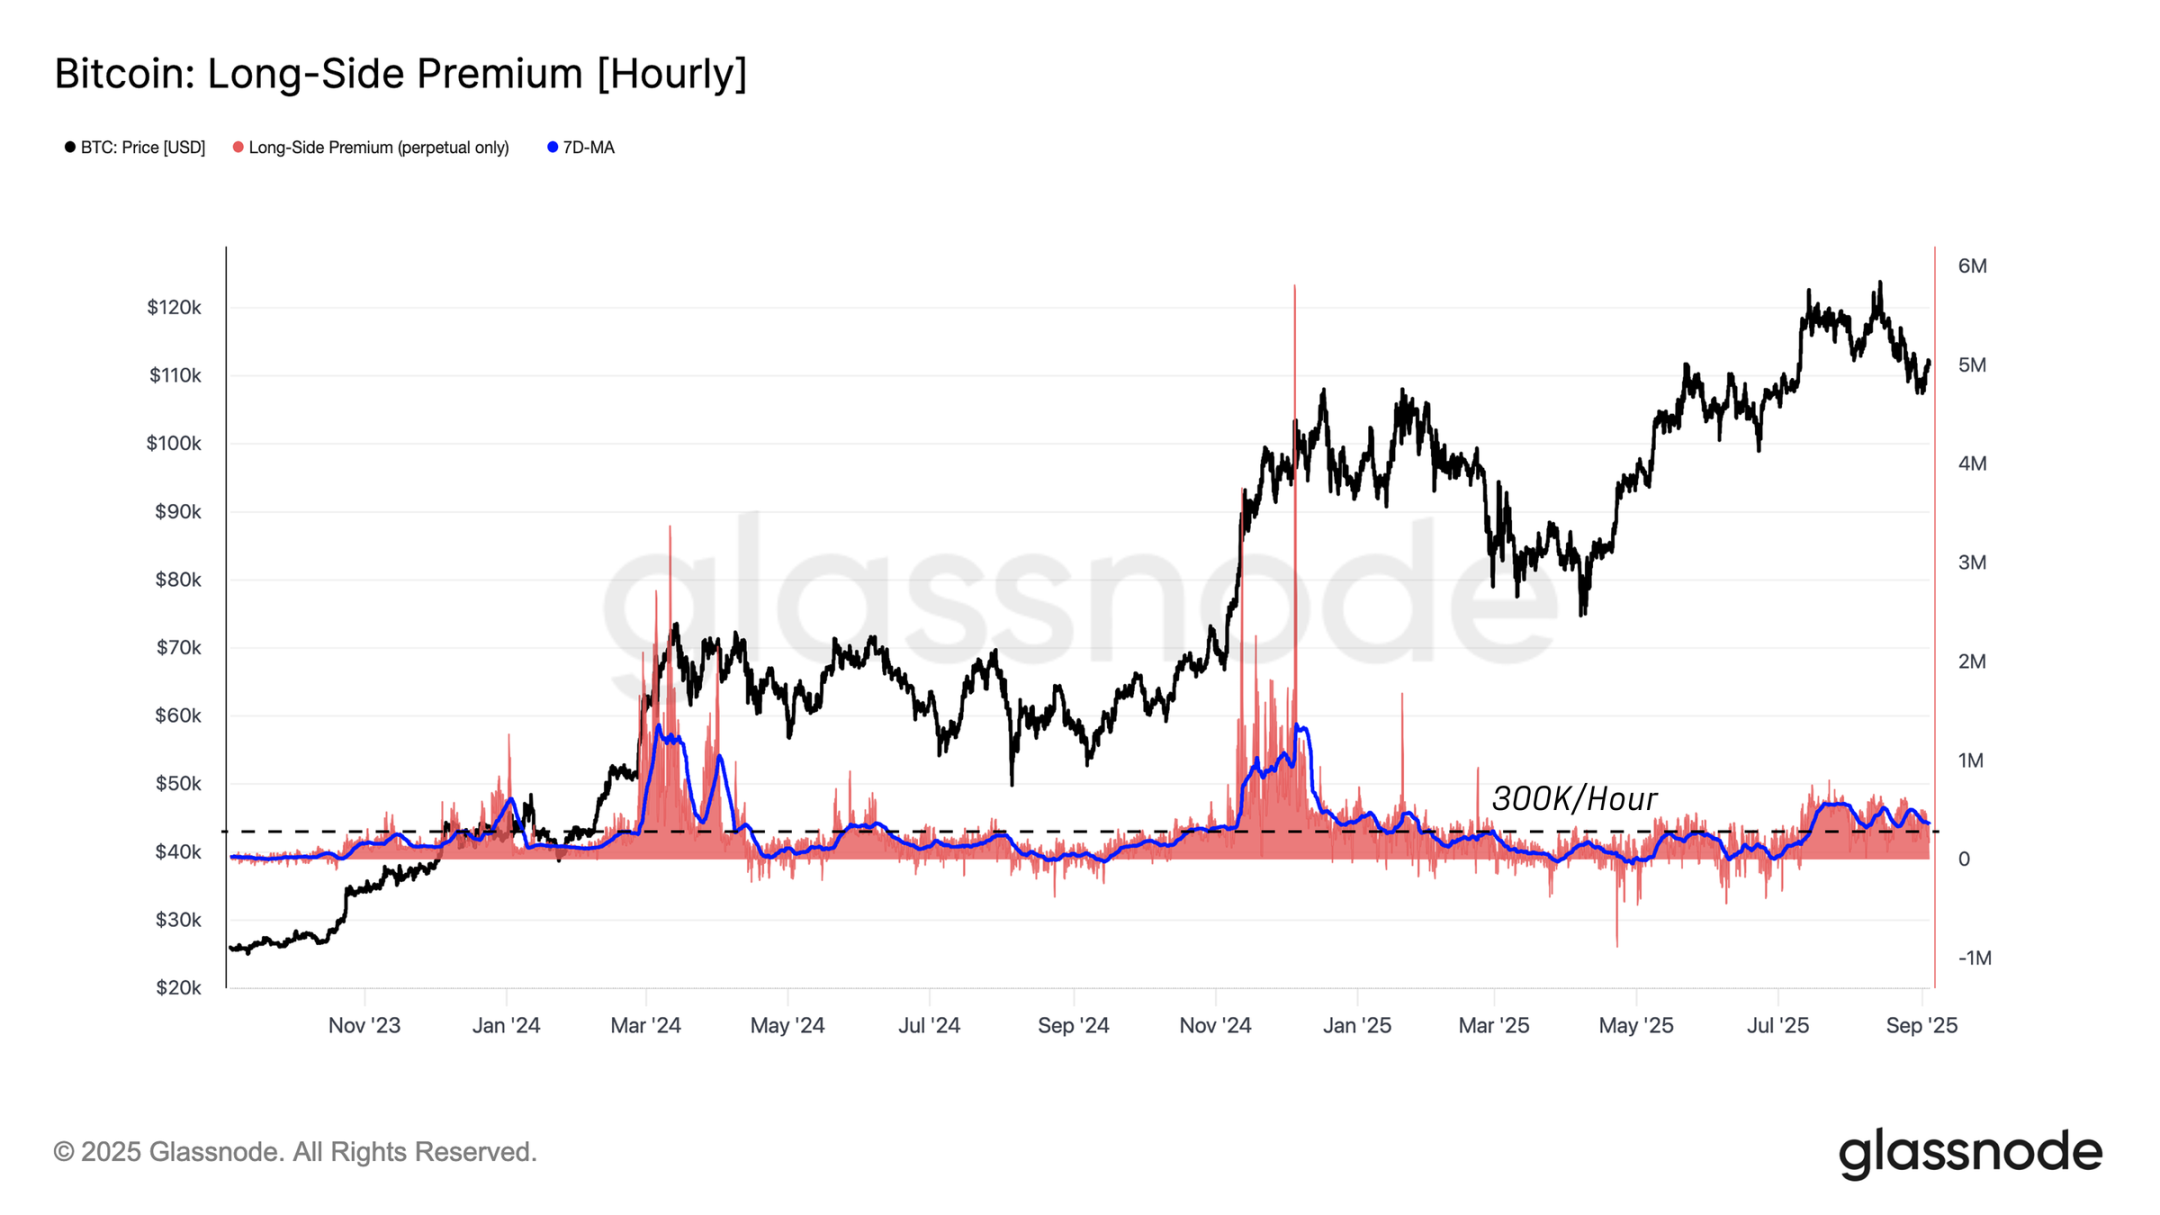
Bitcoin Long Premium Hourly Chart
Traditional financial demand cools: ETF fund flows shrink
In addition to the futures market, spot ETF fund flows are a key indicator of demand from traditional financial institutions. 14-day average net inflow data shows that from May to August 2025, Ethereum ETFs saw average daily net inflows of 56,000 to 85,000 ETH, a key driver of their record highs. However, over the past week, this rate has plummeted to an average of 16,600 ETH per day, highlighting weakening demand amidst price corrections.
Bitcoin has exhibited a similar trend: net inflows, which had consistently exceeded 3,000 BTC per day since April, began to cool in July, with the current 14-day average net inflow dropping to just 540 BTC. Overall, traditional financial purchasing power in both markets has significantly contracted, coinciding with the overall price correction in recent weeks.
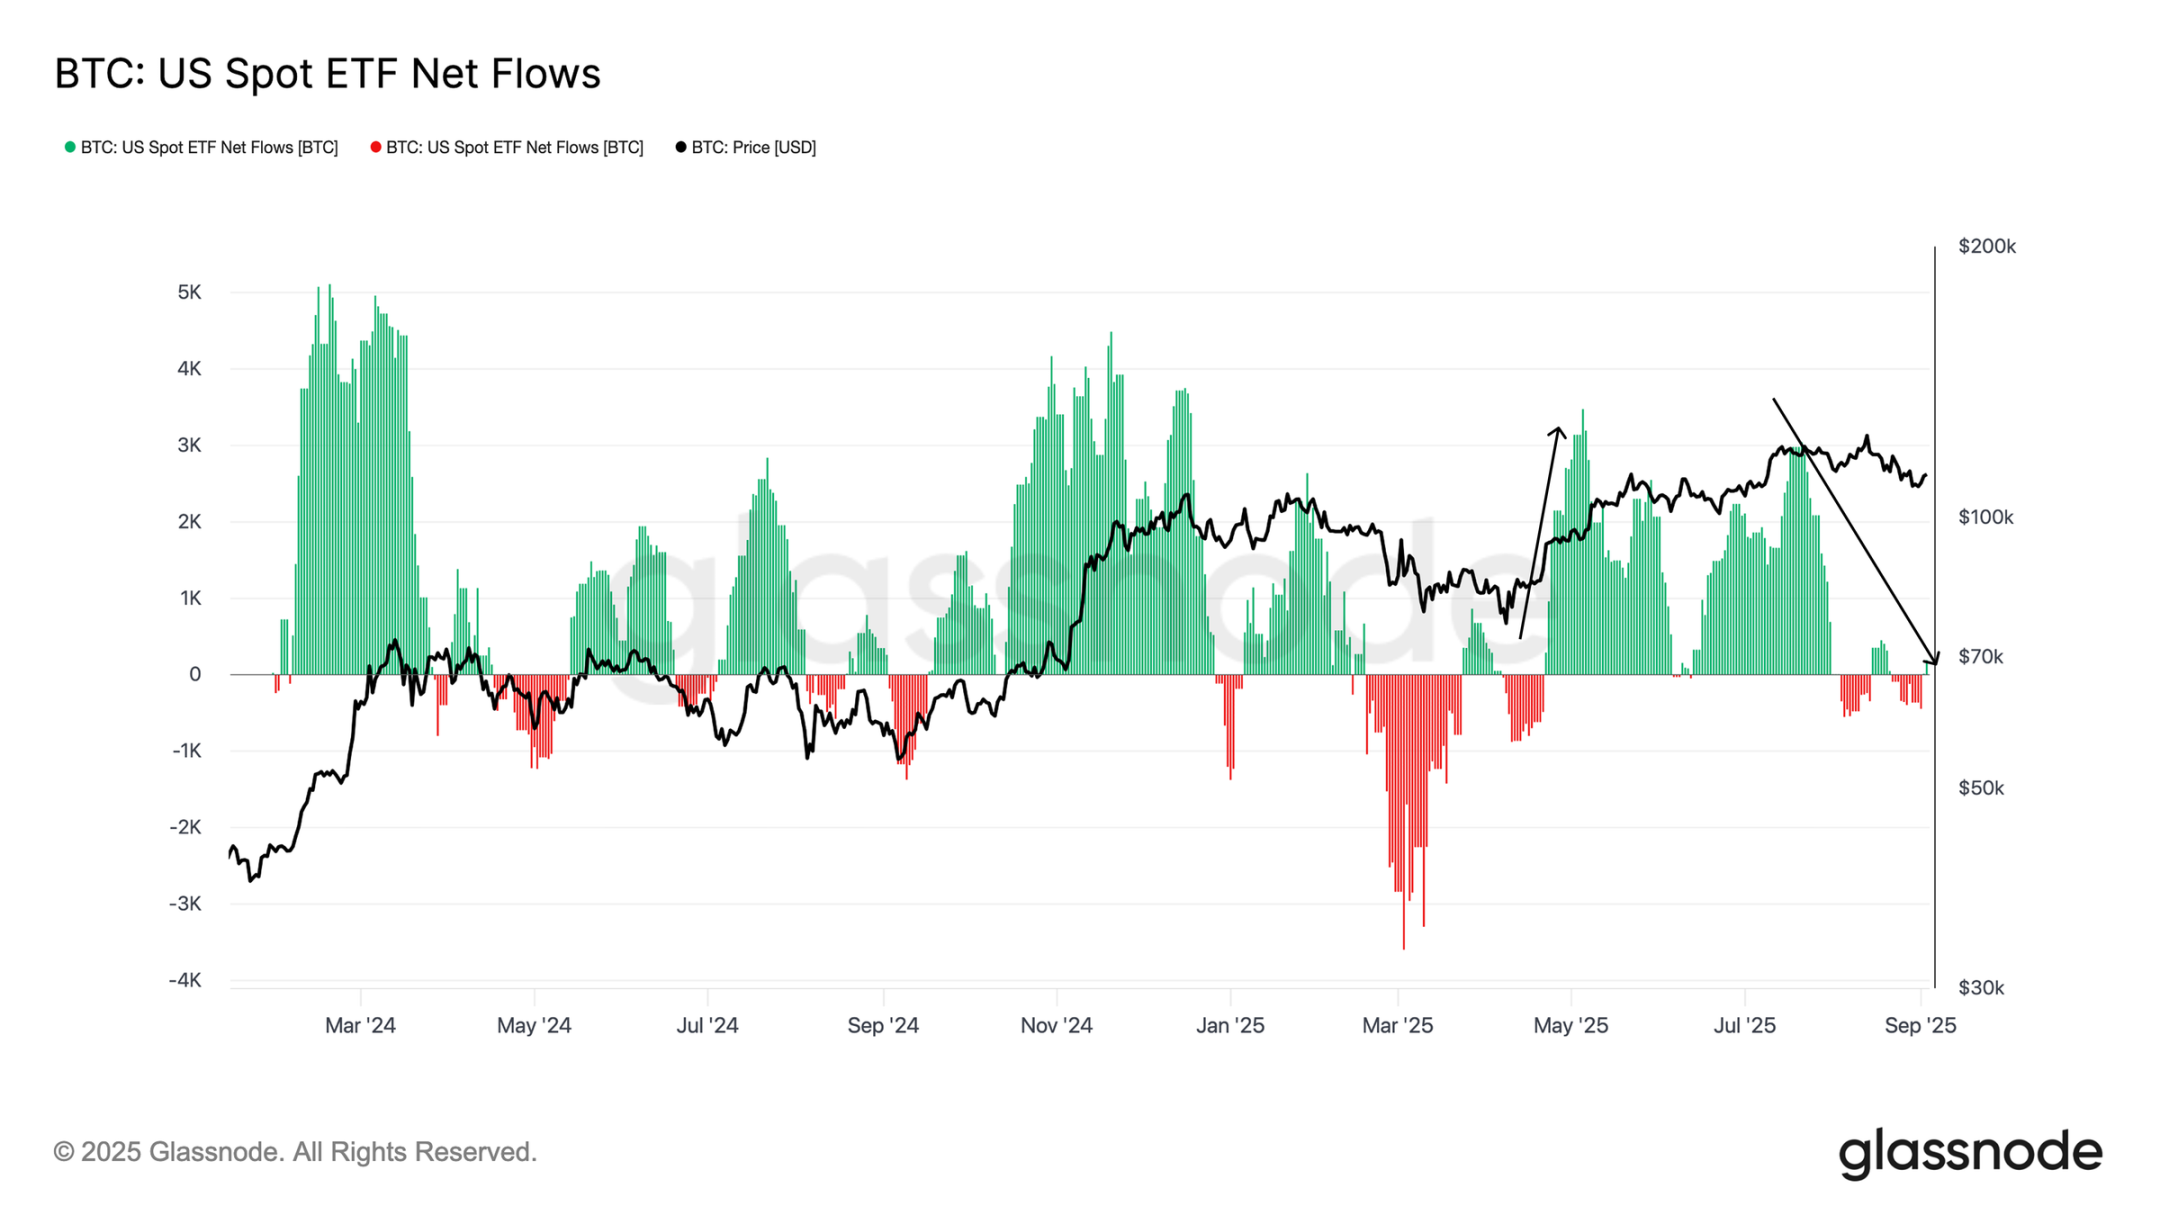
US Bitcoin Spot ETF Net Inflow Chart
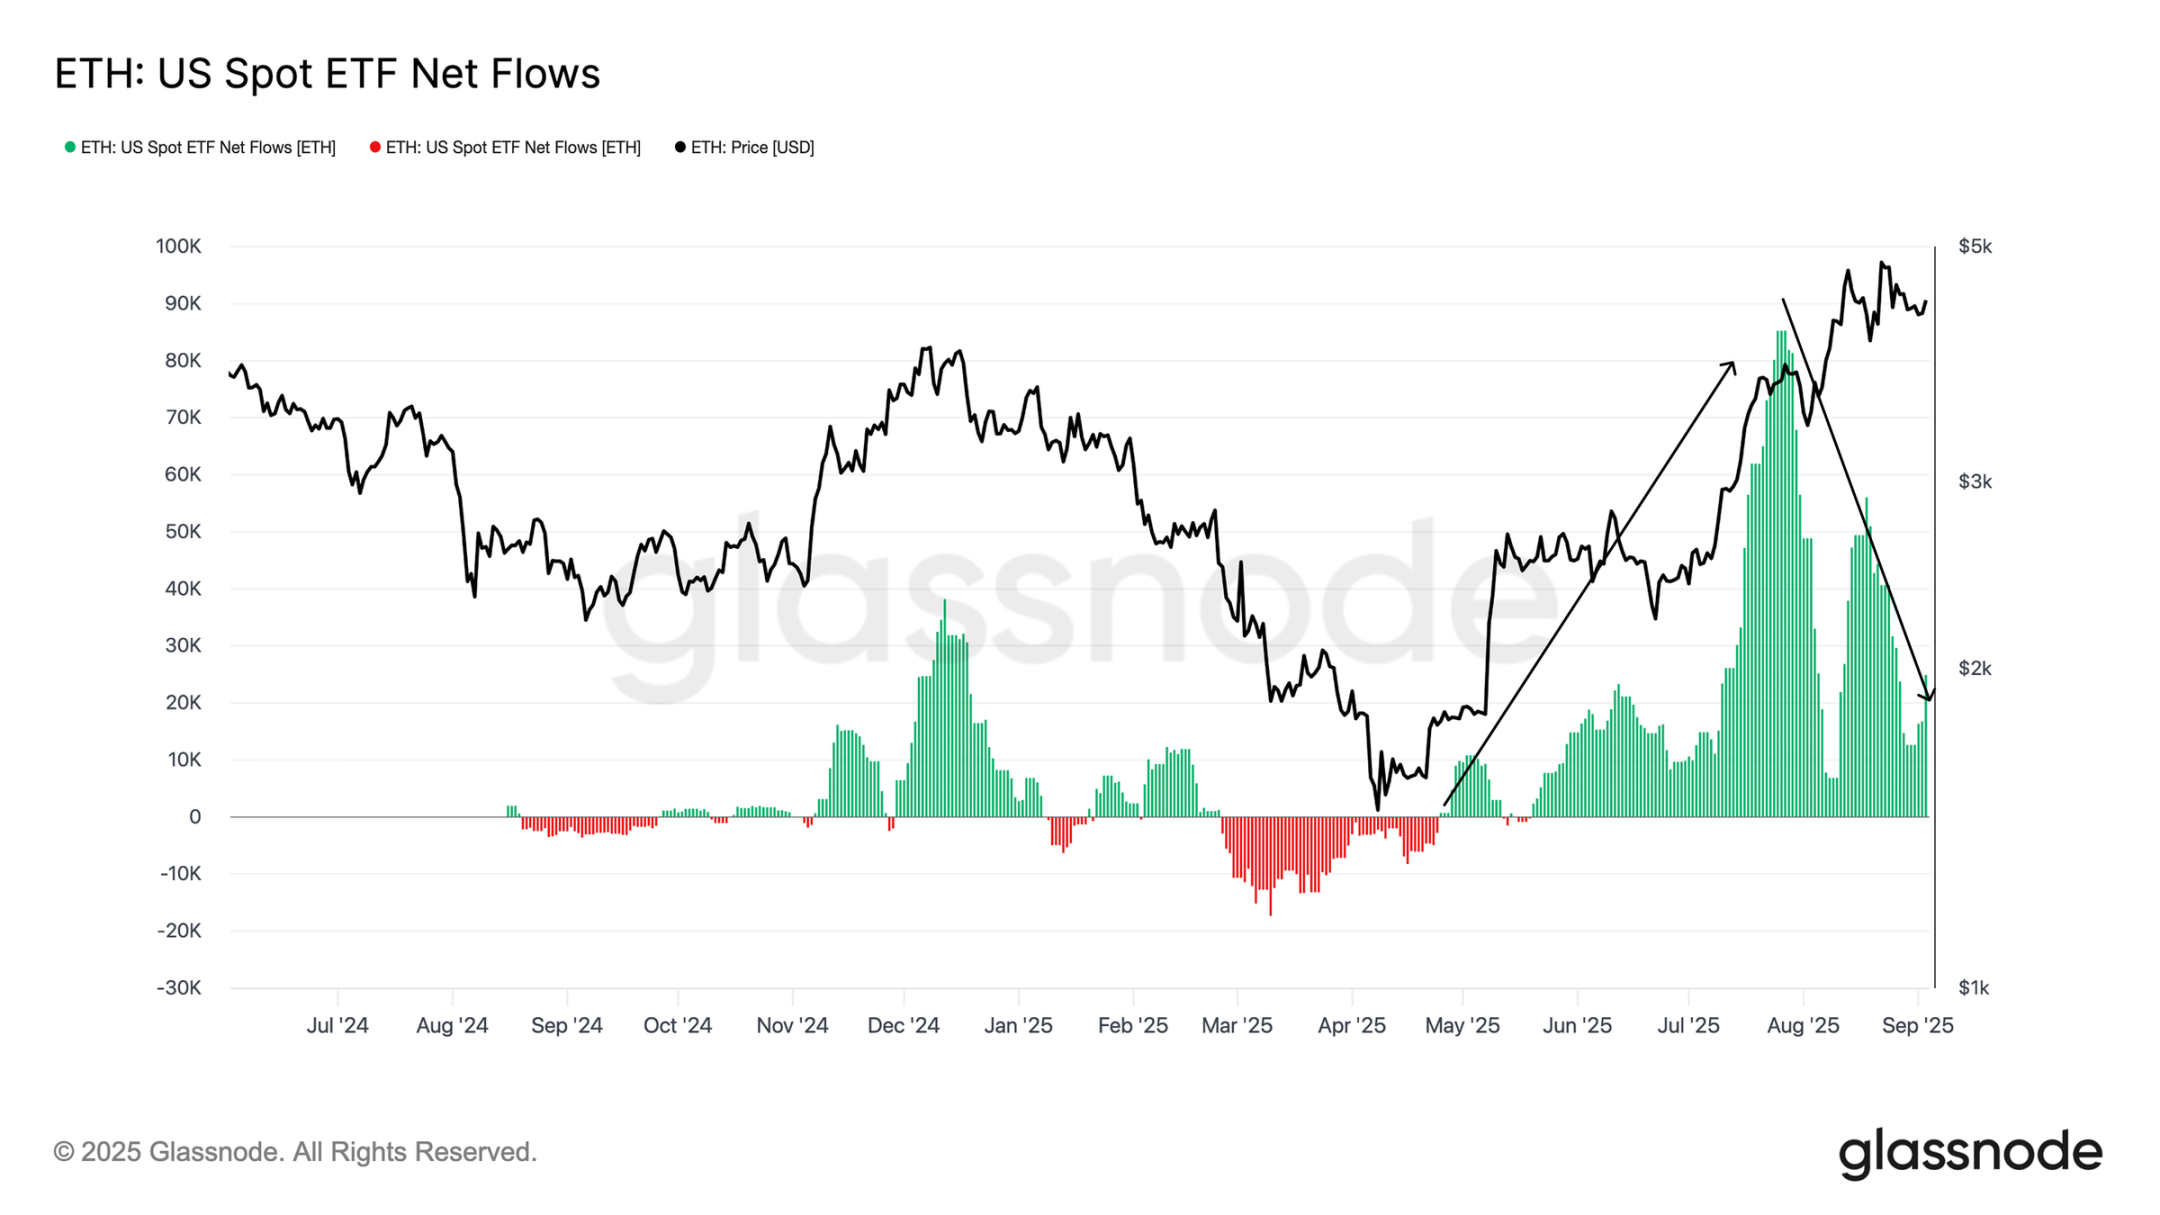
US Ethereum Spot ETF Net Inflow Chart
Structural differences: Demand divergence between Bitcoin and Ethereum
While both Bitcoin and Ethereum saw price increases during periods of ETF inflow surges, the underlying traditional financial demand structures differed. This distinction is clearly visible when comparing ETF cumulative flows with the bi-weekly change in open interest on the Chicago Mercantile Exchange (CME).
For Bitcoin, ETF fund flows far exceed changes in futures positions, indicating that traditional financial investors mainly express directional demand through spot exposure; the situation of Ethereum is more complicated: the bi-weekly change in CME open interest accounts for more than 50% of the cumulative ETF fund flows, which means that a large number of traditional financial activities include both "spot exposure" and "spot-futures arbitrage" strategies, that is, a combination of directional bets and neutral arbitrage.
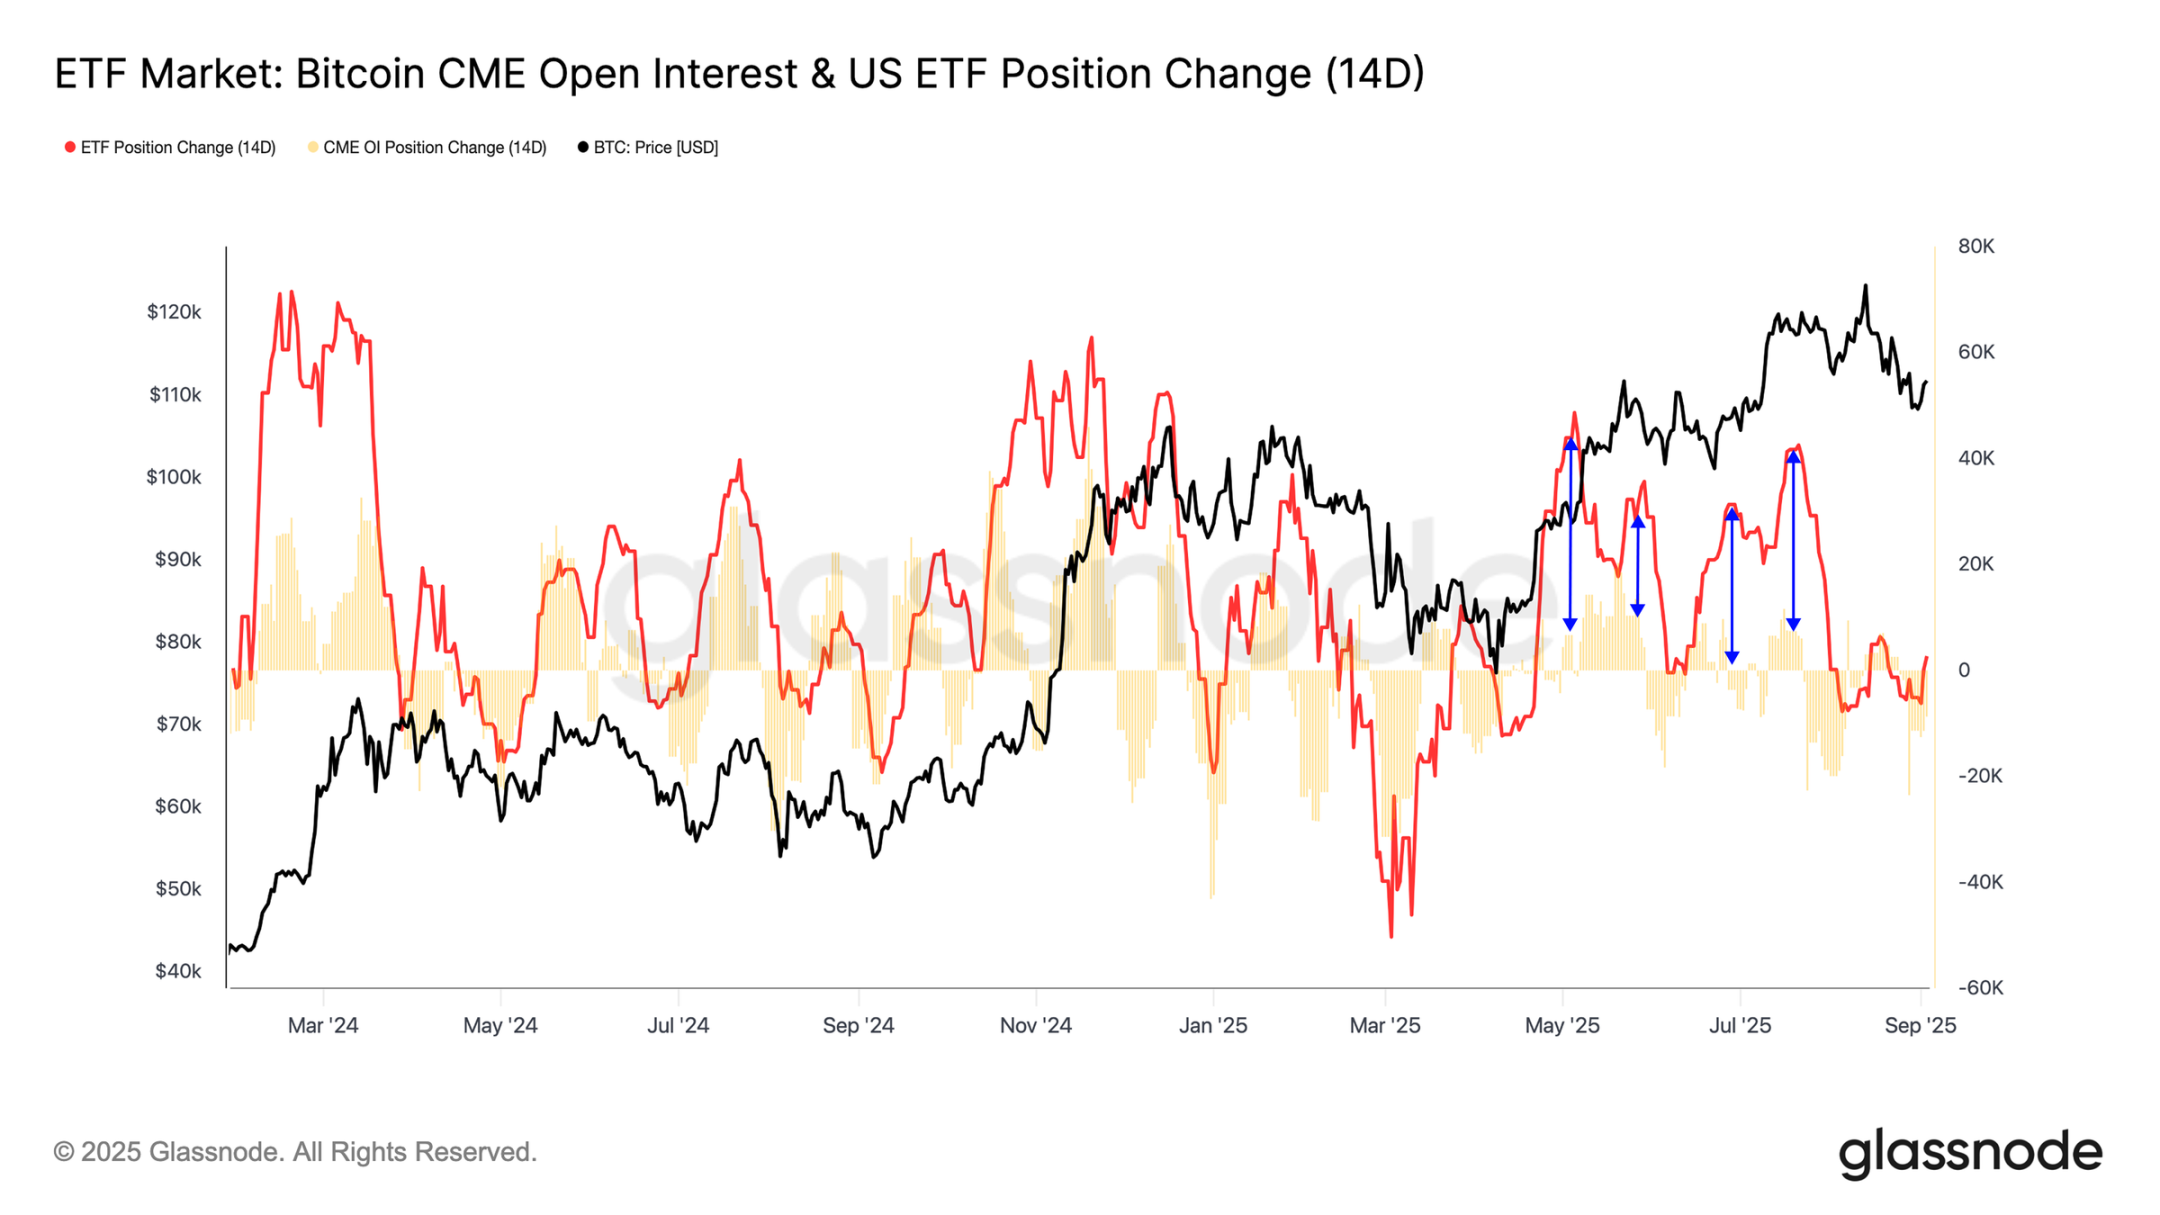
Bitcoin ETF Market and CME Open Interest Chart
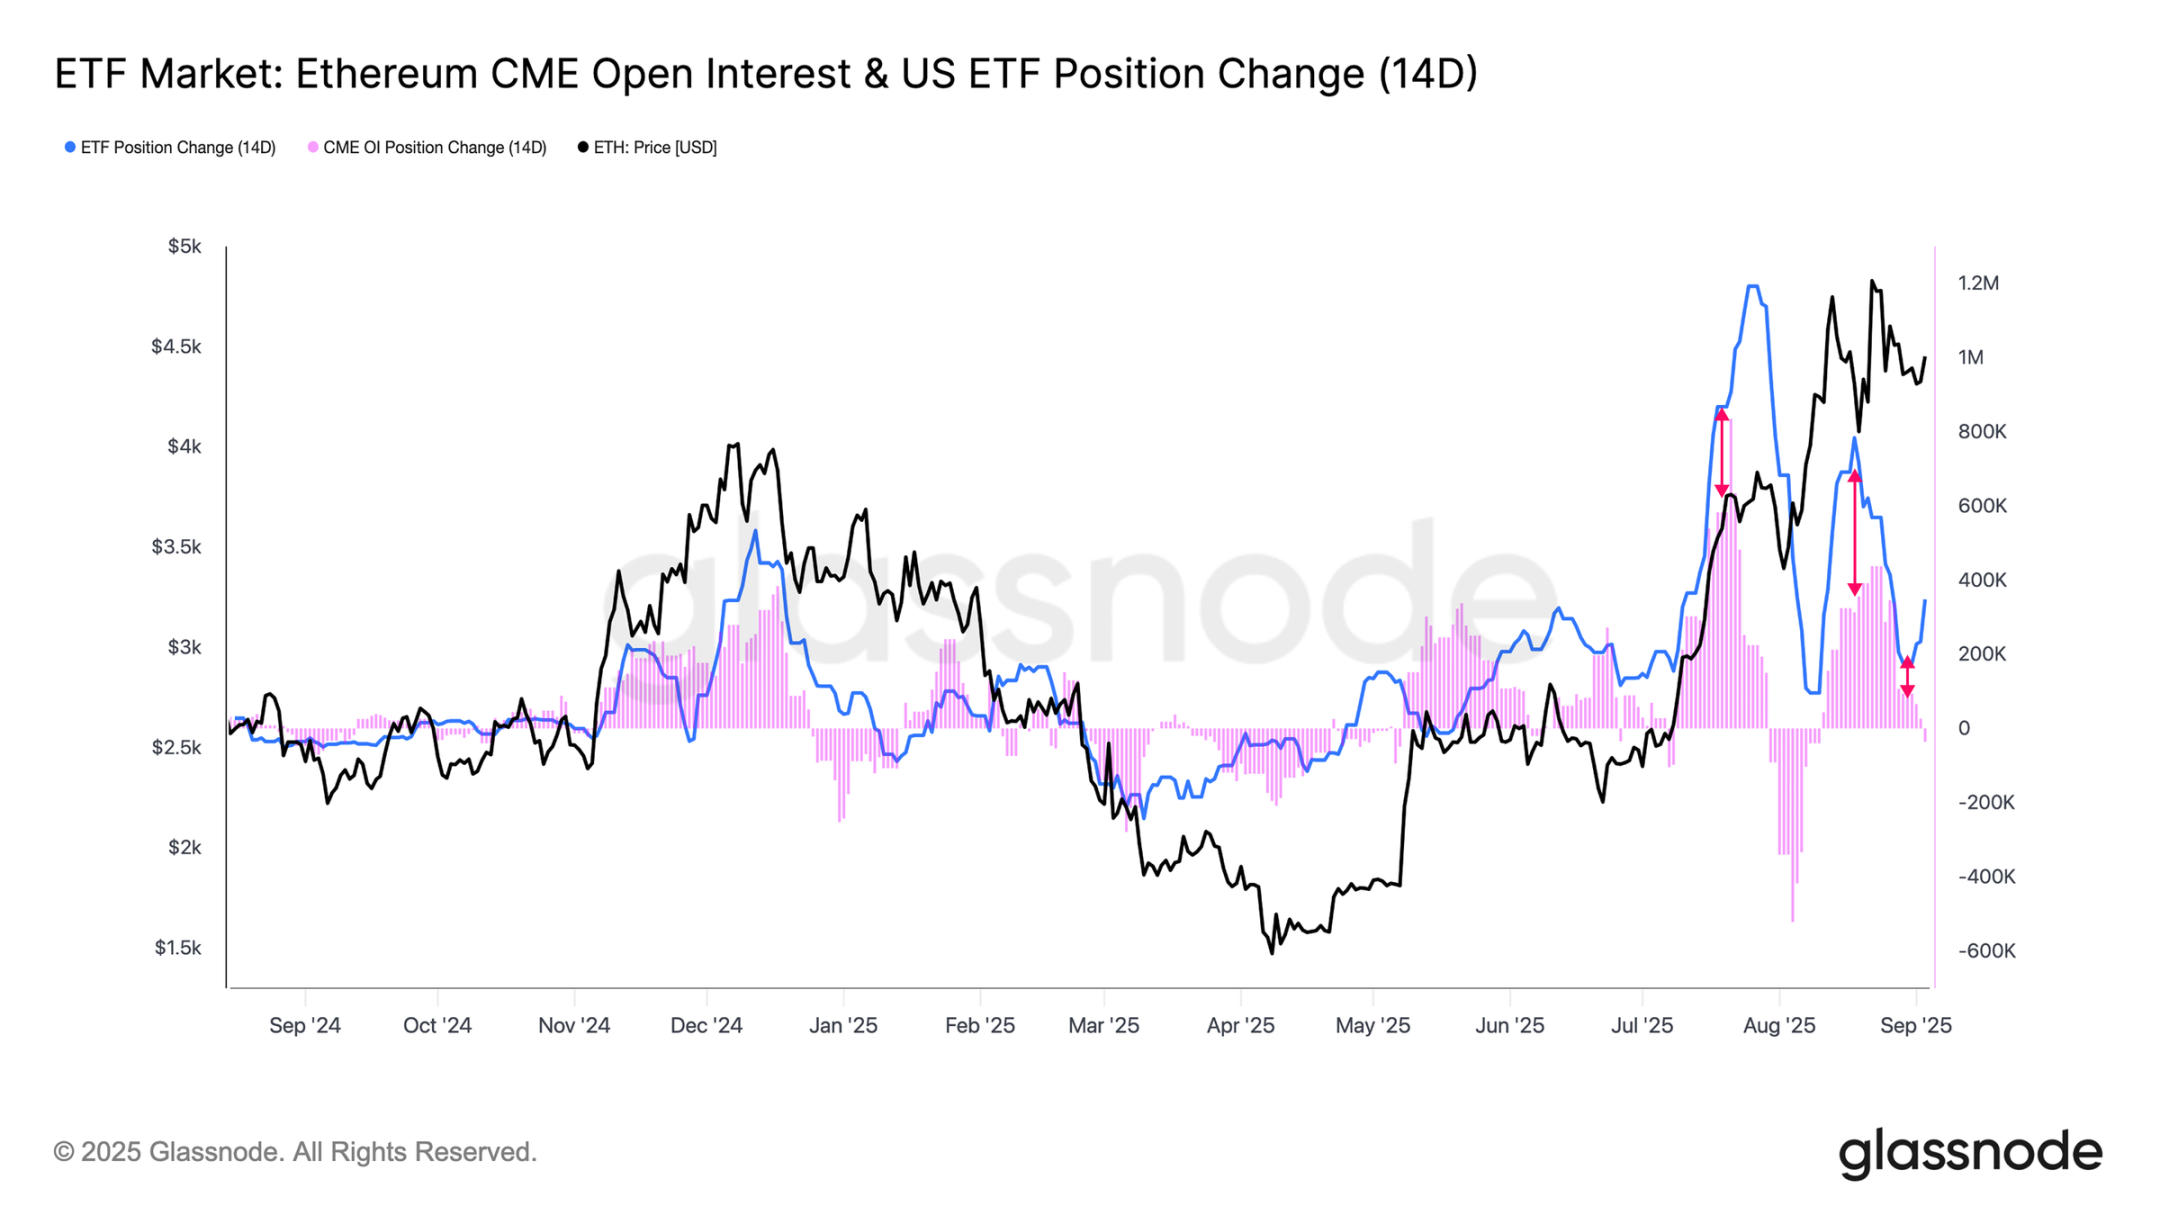
Ethereum ETF Market and CME Open Interest Chart
in conclusion
Bitcoin is currently trading near $112,000, consolidating between $104,000 and $116,000. On-chain signals suggest that short-term holders remain vulnerable: while profitability has rebounded from recent lows, it's not yet strong enough to confirm a renewed rally. Reclaiming $114,000-$116,000 would fully restore profitability for short-term holders, reinforcing the bull case. Conversely, a break below $104,000 could replicate the previous "all-time high followed by exhaustion" pattern, pushing the price down to $93,000-$95,000.
Off-chain indicators also reflect uncertainty: futures funding rates remain neutral, but there is a risk of weakening if demand further subsides; ETF inflows, which had driven previous gains, have slowed significantly. Structurally, Bitcoin ETF flows primarily reflect directional demand, while Ethereum's are more a mix of spot-futures arbitrage and spot demand.


