
With a price-to-sales ratio of only 12 times, is HYPE, which just hit a new high, still undervalued?
- 核心观点:Hyperliquid基本面改善但估值仍被低估。
- 关键要素:
- BTC现货交易量市场份额达12%。
- 永续合约交易量年增长超6倍。
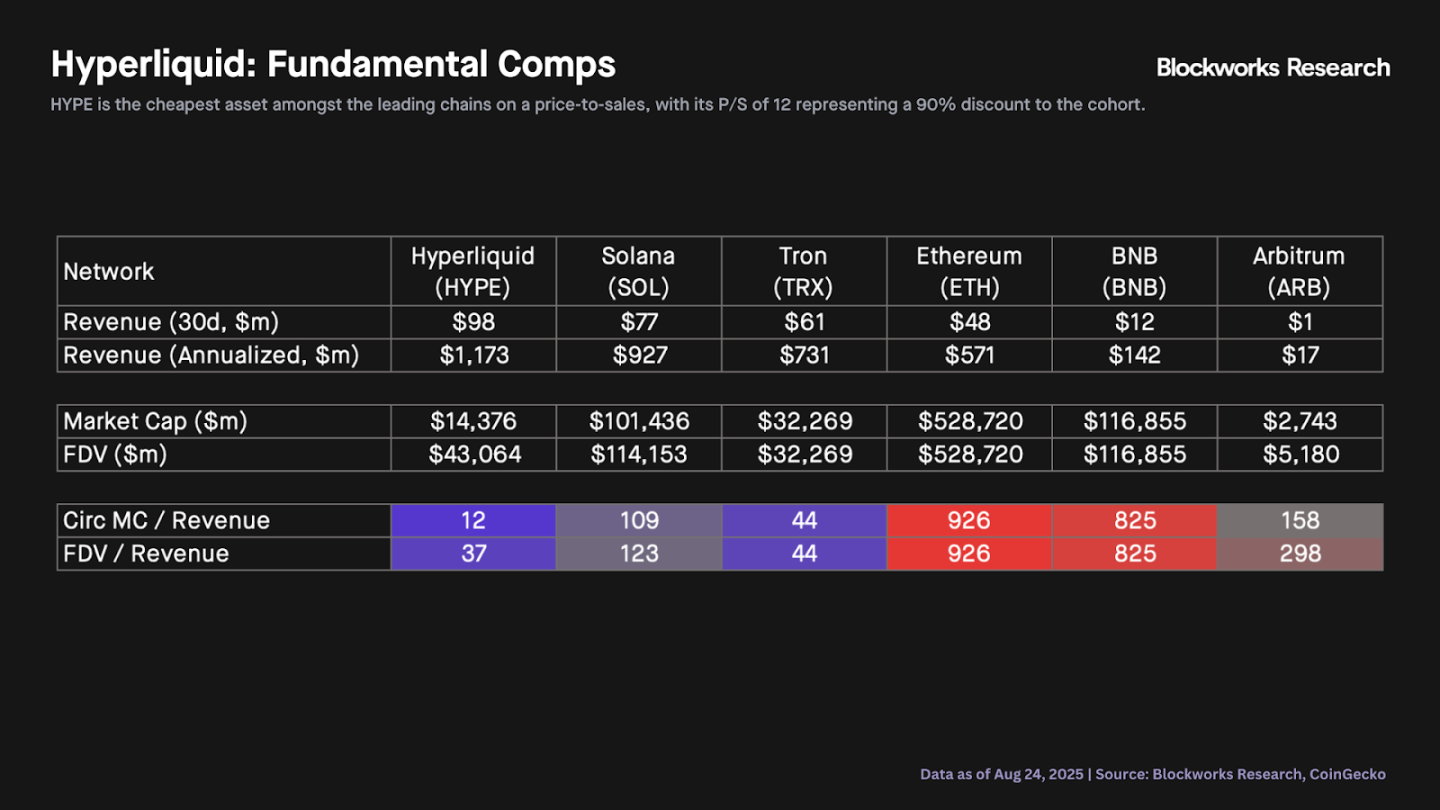
- 市销率仅12倍,低于同类90%。
- 市场影响:或引发L1估值重估与资金流入。
- 时效性标注:中期影响。
Original author: Carlos
Original translation: AididiaoJP, Foresight News
Hyperliquid's fundamentals continue to improve, but its valuation remains undervalued compared to other L1 stocks.
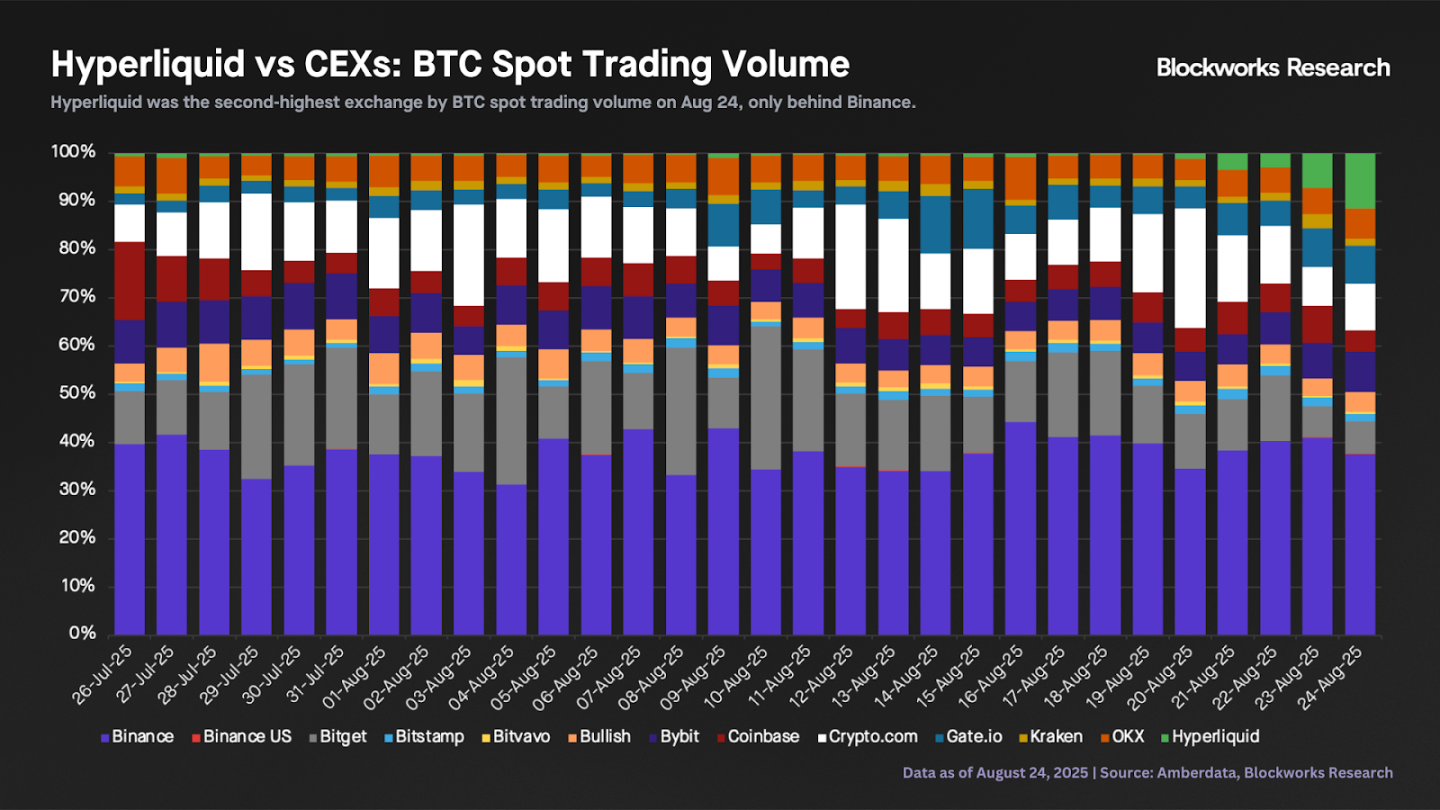
Hyperliquid's spot trading volume has seen significant growth, especially compared to centralized exchanges. Over the weekend, an unknown entity deposited and sold approximately 22,100 BTC with Hyperliquid, purchasing approximately 555,000 ETH, valued at over $2.4 billion. This surge in spot trading volume made Hyperliquid the second-highest exchange for BTC spot trading volume on August 24th, with a 12% market share, second only to Binance (38%). This represents a significant increase compared to Hyperliquid's average daily market share of approximately 1% over the previous 30 days.
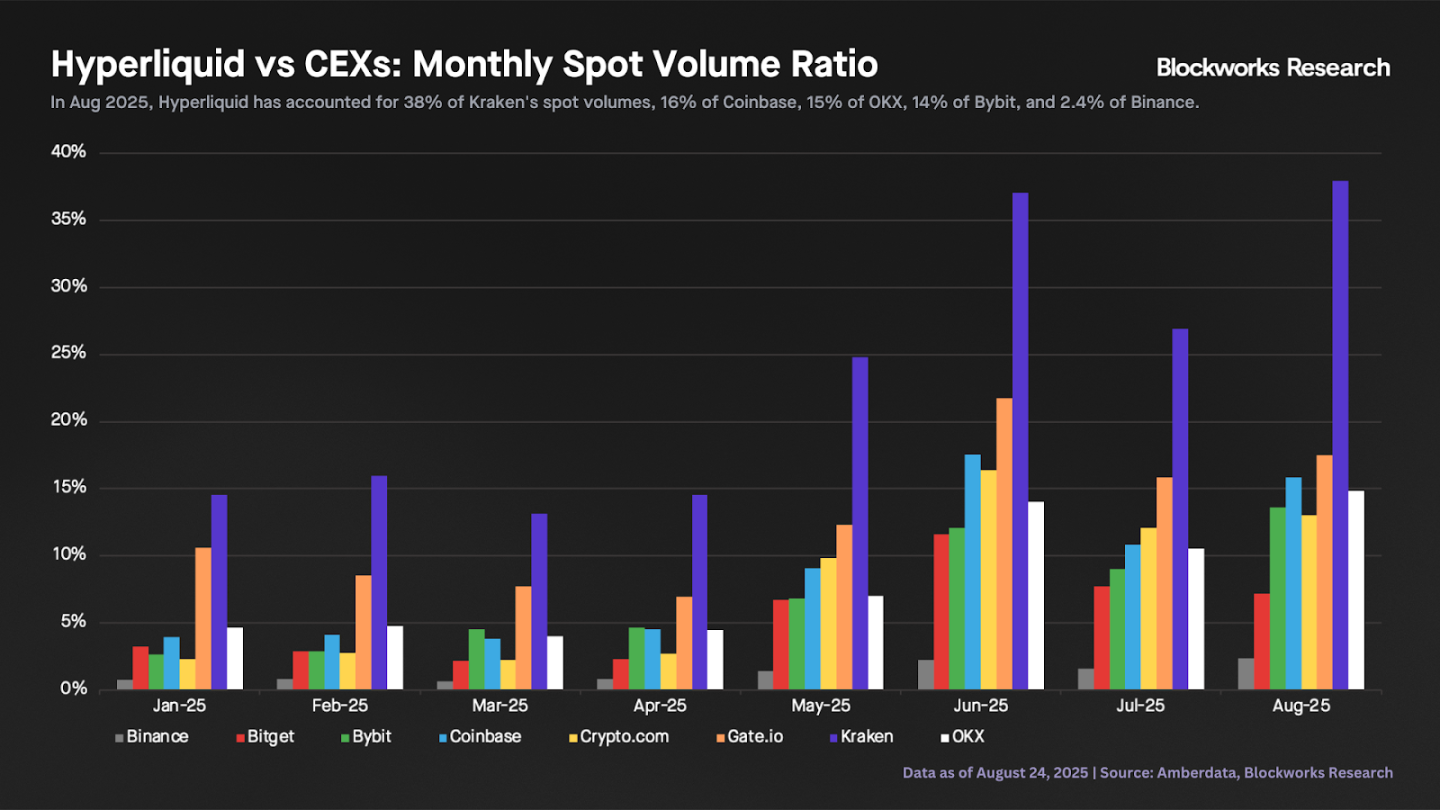
We can compare Hyperliquid's monthly spot trading volume with that of several CEXs (including all assets, not just BTC). We observe that Hyperliquid's share of spot trading volume has continued to rise this year. This month, Hyperliquid's spot trading volume accounts for 38% of Kraken's, 16% of Coinbase's, 15% of OKX's, 14% of Bybit's, and 2.4% of Binance's. While all of these figures represent significant increases compared to the beginning of the year, they also indicate that Hyperliquid still has a long way to go to surpass some of the larger CEXs.
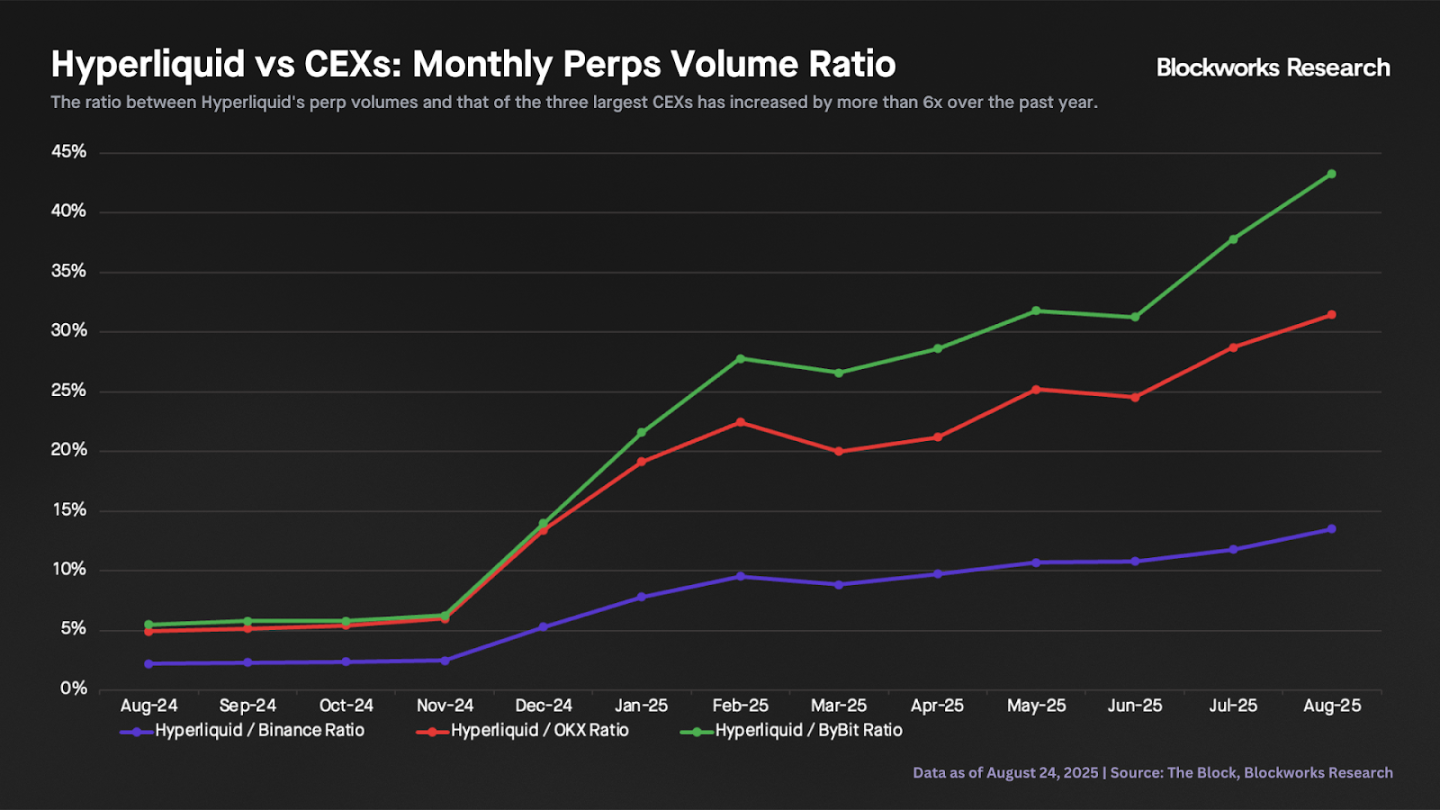
Hyperliquid's perpetual swap trading volume has grown significantly faster than its centralized competitors. The chart below shows that Hyperliquid's perpetual swap volume, compared to the three major CEXs, has grown more than sixfold over the past year. Hyperliquid's monthly perpetual swap volume now accounts for almost 14% of Binance's futures trading volume, compared to just 2.2% a year ago.
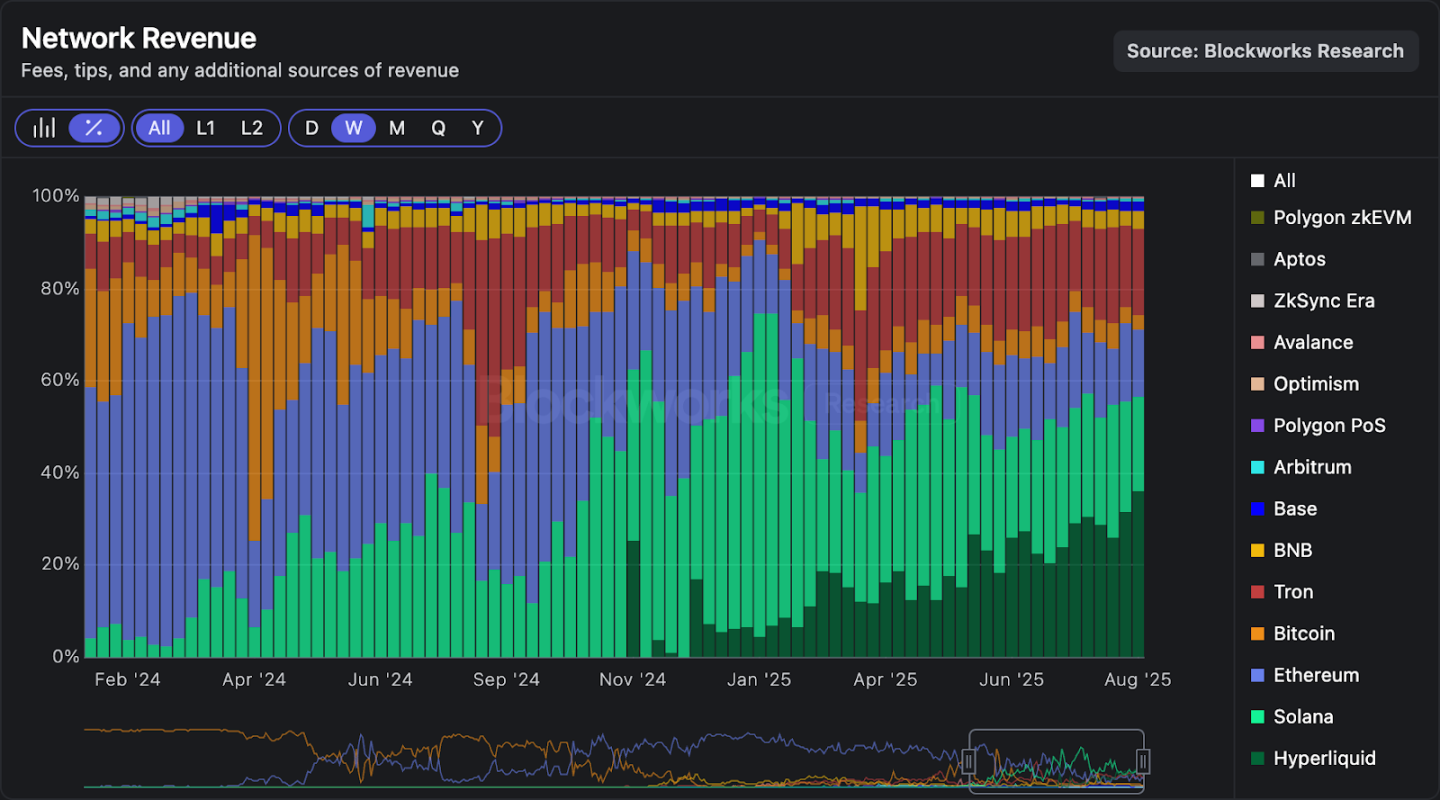
The growth in transaction volume is impressive. But how does revenue compare to other chains? Hyperliquid (HyperCore + HyperEVM) has generated approximately $28 million in weekly revenue for two consecutive weeks, reaching $98 million over the past 30 days. These figures equate to annualized revenue of between $1.2 billion and $1.4 billion. The chart below shows that Hyperliquid has consistently been the chain with the highest weekly revenue for the past two weeks, with market share reaching a record high of 36%.
The chart below shows that HYPE is the cheapest asset among mainstream public chains based on price-to-sales (P/S) ratio. Its P/S ratio of 12 is 90% lower than its peers. Even when calculated on a fully diluted valuation/sales (FDV/sales) basis, HYPE is the cheapest L1. While we debate whether L1s should command a premium or be valued based on revenue, the fact is that based on this metric alone, HYPE's current price appears more attractive than all other L1s.
What happens if the so-called “L1 premium” disappears? What happens if buying pressure from DATCOs (referring to unknown entities or institutions) abates? Is HYPE undervalued, or are other L1s incredibly overvalued? We can’t know for sure, but these are definitely questions worth pondering.


