Gate Research Institute: BTC consolidates at high levels, BONK rises by more than 56%, and small and medium-sized market capitalization rotation heats up
Overview
Gate Research Institute analyzed and sorted out the market dynamics and popular airdrop projects from June 24 to July 7, 2025. During this period, the crypto market continued to fluctuate at a high level. Although the overall sentiment has not yet fully recovered, driven by local themes, small and medium-sized market value tokens have shown outstanding performance. Projects such as BONK and REKT have formed a resonance in price and trading volume, showing the characteristics of active short-term funds; while some tokens that have increased in volume but stagnated reflect the market's divergent expectations for their subsequent performance. The overall market presents a structural pattern of "theme rotation and mainstream stability", and abnormal trading volume is still an important signal for capturing short-term opportunities.
In this context, multiple potential projects have simultaneously launched airdrop activities, including Altius (emerging data intelligence protocol), Camp Network (modular blockchain infrastructure), ChainOpera (AI-driven on-chain interactive platform) and Sapien (on-chain identity and social points platform), all of which have opened task participation portals. This article will briefly introduce the characteristics and participation methods of these projects to help users seize the airdrop bonuses and mid- to long-term layout opportunities during the market rebound period.
Cryptocurrency Market Overview
According to CoinGecko data, from June 24 to July 7, 2025, the cryptocurrency market as a whole maintained a range of fluctuations, with the trend tending to consolidate at a high level. During this period, BTC once reached a high of 110,307 USDT, with a range increase of nearly 4%. It has now fallen back to about 108,900 USDT, indicating that the market is still in a state of long-short tug-of-war. [1]
At the macro level, Fed Chairman Powell did not rule out the possibility of a rate cut in July in his recent speech, saying that if it were not for the recent tariff increase, the Fed might have already started to cut interest rates; and pointed out that the new round of tariffs is expected to put pressure on future inflation. The market interpreted this as the Fed's attitude becoming slightly more flexible and risk appetite picking up in the short term.
In addition, the U.S. Senate passed the key procedural motion of the "Big and Beautiful" bill by a vote of 51 to 49, and President Trump officially signed it into law on July 4. The bill continues the 2017 tax cut policy, adds tax deduction items such as tips and car loans, and significantly increases defense and border spending. In the short term, it is expected to boost corporate profits and residents' income, enhance the popularity of the stock market and risky assets, and then drive capital back to mainstream crypto assets such as BTC and ETH; but the fiscal deficit expansion and inflationary pressure it causes may also become a hidden worry for subsequent policy tightening.
In terms of regulation, after the U.S. GENIUS Stablecoin Act passed the procedural review in the Senate, the House of Representatives also accelerated its pace. Republican leaders recently announced that the week of July 14 will be designated as "Cryptocurrency Week" and plan to hold a centralized vote on three key digital asset bills, including: the GENIUS Act, the CLARITY Act, and related bills opposing the launch of central bank digital currencies (CBDCs). This series of legislative actions shows that the U.S. Congress is establishing a digital asset regulatory framework in a more systematic way, providing a clear compliance path for stablecoins, trading platforms, and innovative products.
Overall, the crypto market is currently in a transition period of gradually clear regulation and intensive policy release. Capital sentiment is still cautious and wait-and-see, but structural benefits are continuing to accumulate. With the Fed's more flexible attitude, the approaching "Cryptocurrency Week" legislation, and the continued advancement of institutional products such as ETFs, the market is expected to usher in a key turning point of sentiment repair and capital return in the second half of the year. In the short term, it is recommended to focus on the legislative progress of the three major crypto bills and the changes in net capital flows of mainstream crypto ETFs as important reference indicators for judging market trends.
1. Panorama of this round of price fluctuations
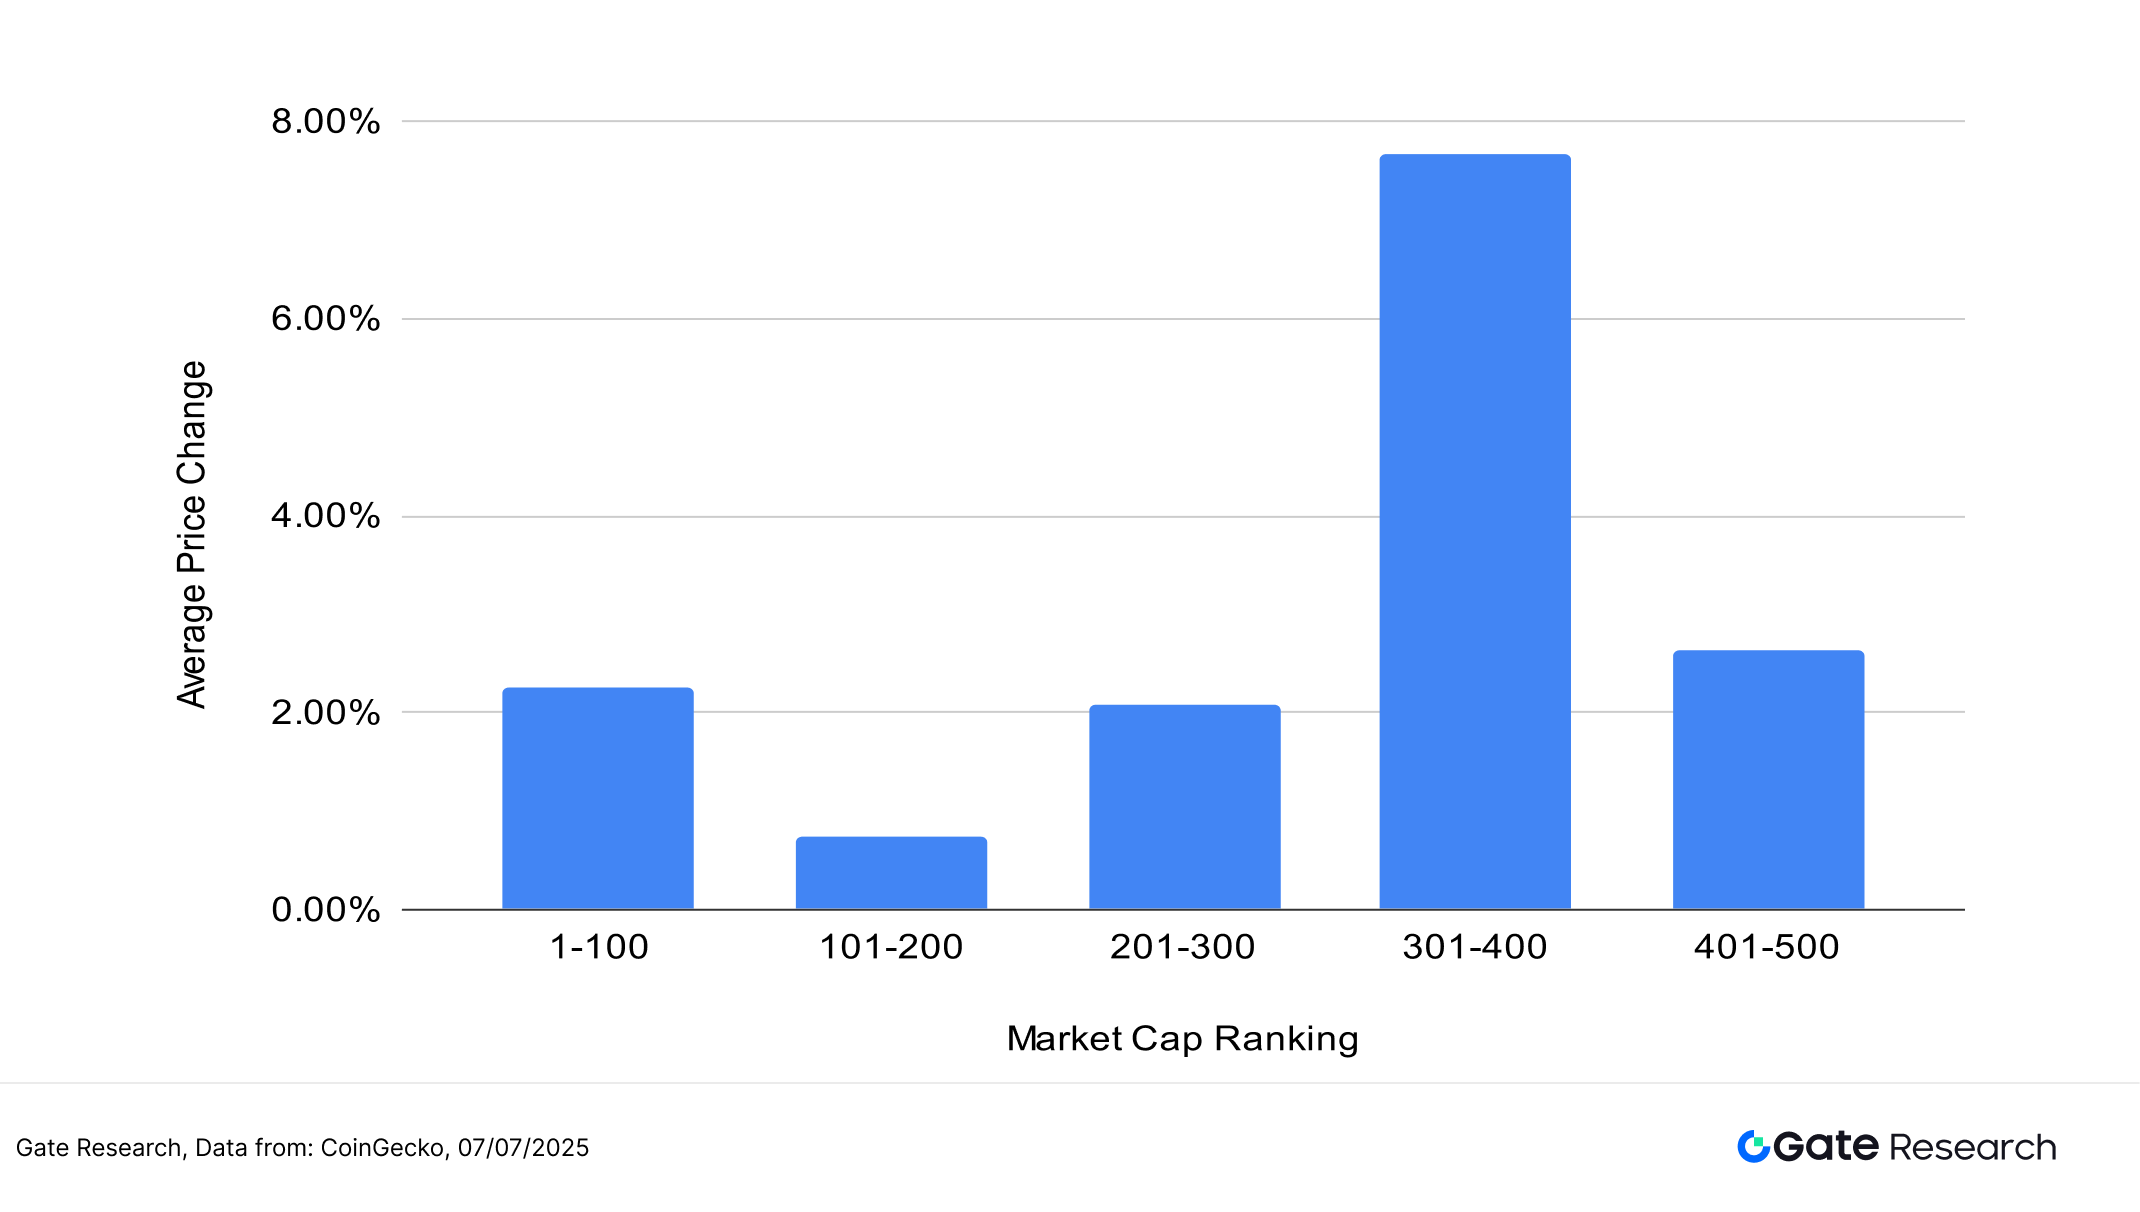
This article groups and counts the top 500 tokens by market value, and observes the average increase in different market value ranges from June 24 to July 7.
Overall, the market showed a structural rotation pattern, with small-cap tokens generally outperforming large assets, and funds tending to chase high-volatility targets. Among them, tokens ranked 301-400 in market value performed the best, with an average increase of nearly 8%, much higher than other ranges, indicating that funds were concentrated in mid- and tail-end tokens, driving a phased market explosion. The second was the 401-500 market value range, with an average increase of about 2.7%, which also performed steadily.
In terms of mainstream assets, the average increase of the top 100 tokens by market value was about 2.2%, maintaining a moderate upward trend, indicating that institutions and stable funds still maintain basic allocation intentions. The increase of tokens ranked 201-300 by market value was similar to that of the top 100, with a neutral performance. Relatively speaking, the tokens ranked 101-200 by market value performed the weakest, with an average increase of less than 1%, the lowest among all intervals, indicating that this segment lacks themes to drive it and the attention of funds is relatively low.
Overall, the current market capital preference has a clear direction, and the increase is mainly concentrated in specific small and medium-sized market value ranges, showing the characteristics of a structural rebound dominated by local rotation and themes. Although sentiment shows signs of warming up, it has not yet spread across the board.
Note: The market capitalization distribution is based on Coingecko data. The top 500 tokens by market capitalization are grouped into 100 groups (such as 1-100, 101-200, etc.). The price changes of tokens in each group from June 24 to July 7, 2025 are counted, and the average of each group is calculated as the average increase indicator for the market capitalization range. The overall average increase (3.07%) is the average of the individual increases of the top 500 tokens by market capitalization, unweighted.
Figure 1: The overall average increase is 3.07%. The most eye-catching increase is in the tokens ranked 301-400 by market capitalization, with an average increase of nearly 8%.
Rising and falling dragon and tiger list
In the past two weeks, the overall crypto market has maintained a volatile consolidation pattern, but capital rotation is still active, and some small-cap tokens have performed particularly well, and the market has shown obvious structural differentiation. The top ten tokens on the list of gains are mostly concentrated in Meme, AI, community or experimental sectors, with high topicality and high volatility, becoming the focus of short-term capital chasing in the market.
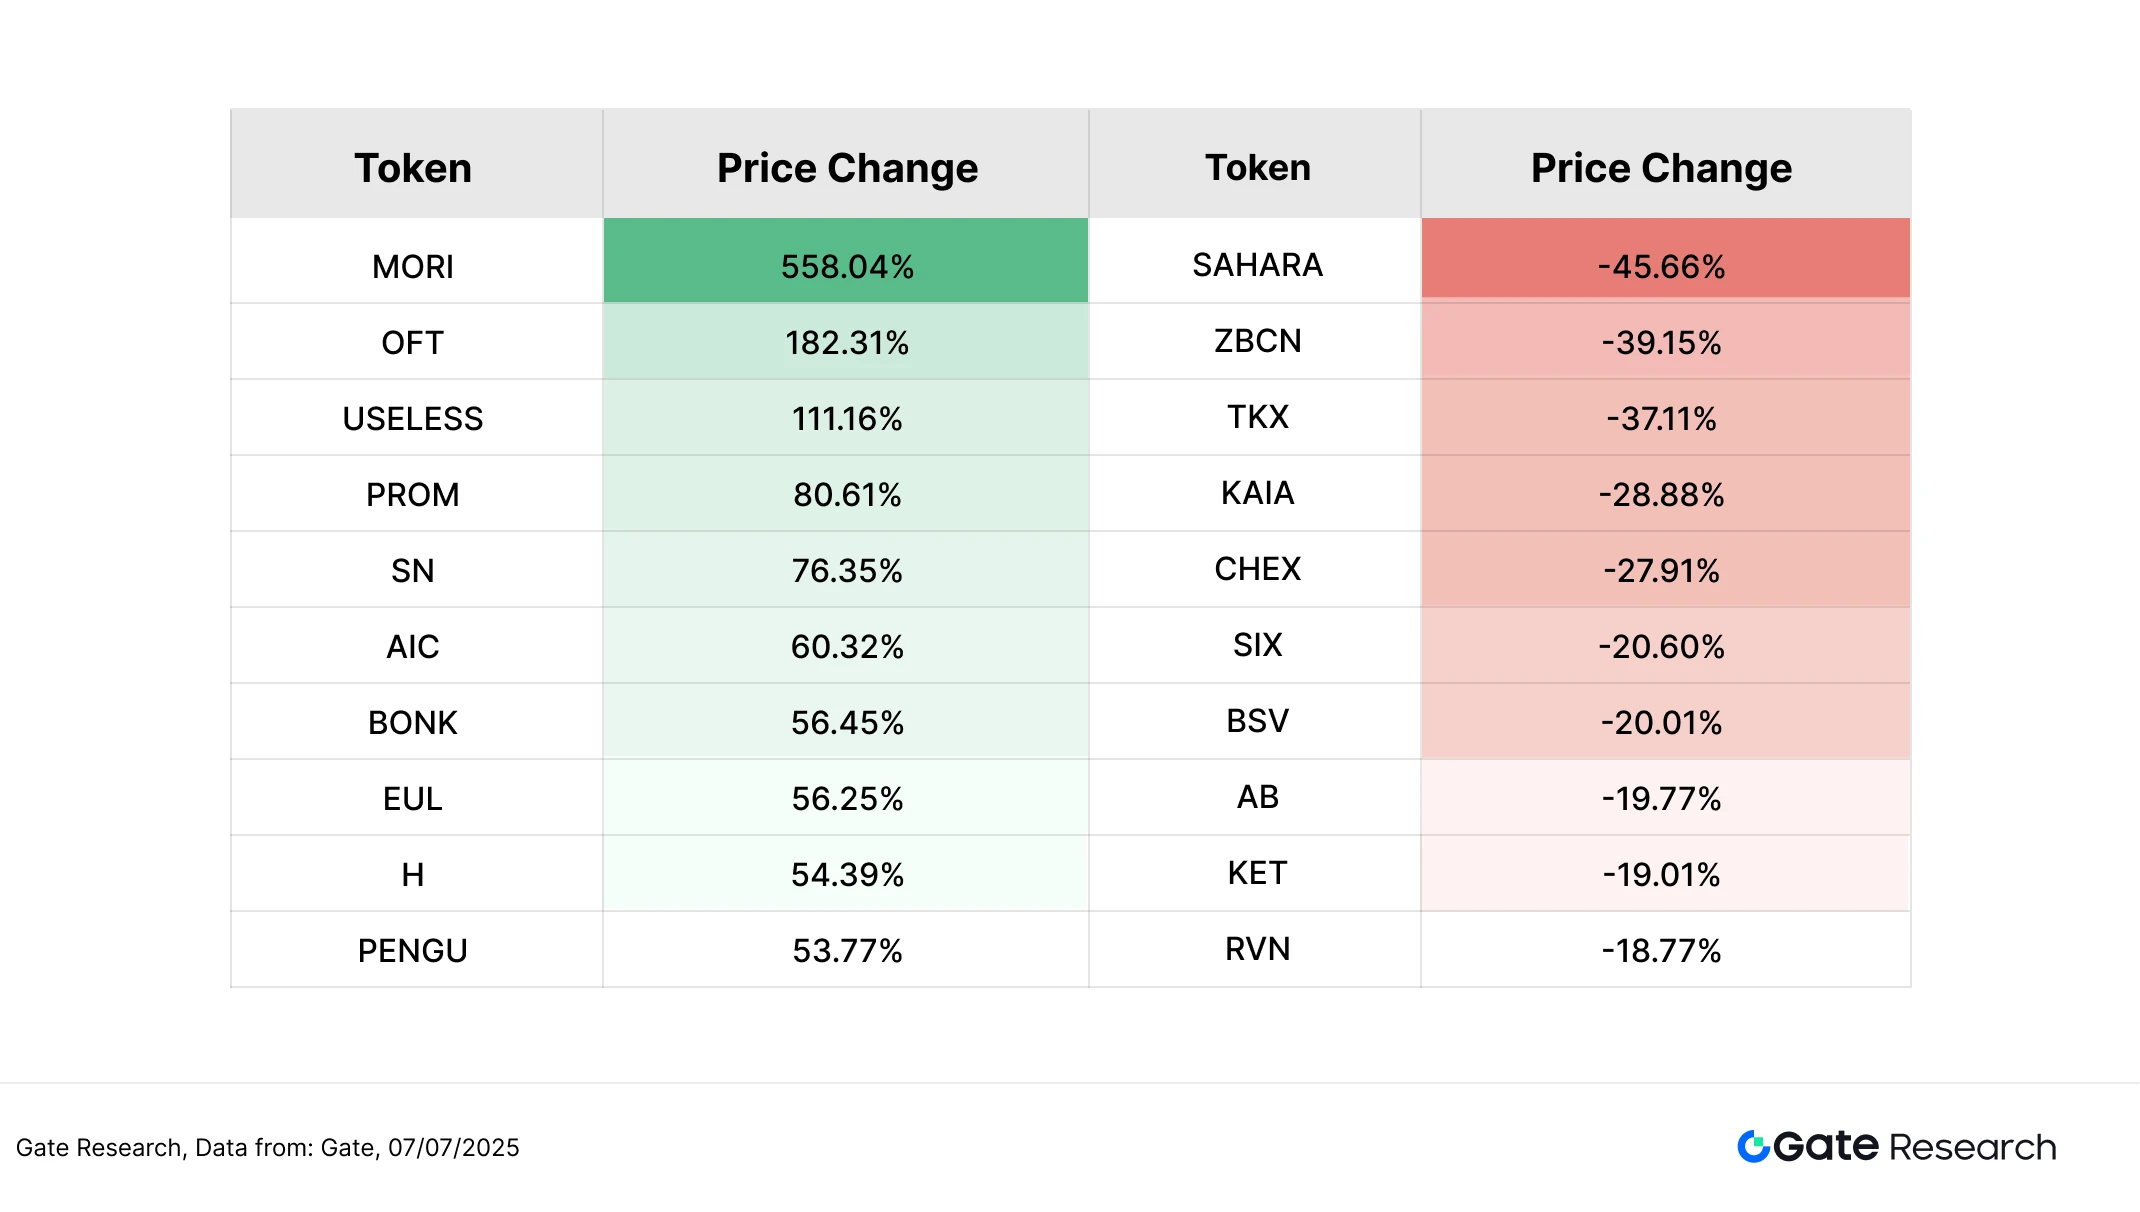
Among them, MORI ranked first in the list of gains, with a price surge of more than 558% in the past two weeks, far exceeding other projects, indicating a highly concentrated inflow of funds. MORI is a Meme coin deployed on the Solana chain. Due to its minimalist narrative style and high community popularity, it has formed a unique speculative cultural circle on the X platform in a short period of time, becoming one of the popular high-Beta assets of Solana this round. Other outstanding projects include OFT (+ 182.31%, focusing on fragmented narrative on the chain), USELESS (+ 111.16%, a Meme coin emphasizing irony), PROM (+ 80.61%, combining NFT with social invitation mechanism), etc., which generally have strong community attributes and hype topics.
In addition, the list also includes representative Solana meme coins such as BONK and PENGU. Among them, BONK benefited from the favorable ETF application and the issuance of Letsbonk platform surpassed Pump.fun, and the number of coin holding addresses exceeded one million, recording an increase of more than 56%. Emerging projects such as AIC and EUL that combine AI and public chain native positioning also performed well, showing that the market still maintains a high preference for high Beta assets.
In contrast, the decline list is concentrated on projects that lack new narratives or have lost popularity recently, such as SAHARA (-45.66%, a data trading platform built on zero-knowledge privacy protocol, which was briefly popular due to the concept of "AI + data", but has lost attention recently), ZBCN (-39.15%), and TKX (-37.11%), which are among the top decliners, reflecting that in the context of the overall market sentiment not yet recovering significantly, weak assets are more likely to become the first choice for capital withdrawal. Some old tokens such as BSV and RVN also appear on the list, showing that their attractiveness is gradually declining under the rotation of new themes.
Overall, the market has not yet entered a phase of systemic reversal, but the style of funds has clearly tended to assets with high volatility, high narrative and strong community participation, and some local themes still have short-term performance opportunities. However, projects that lack liquidity, lack of popularity or weak narratives face the risk of being marginalized by the market, and the market structure is clearly differentiated.
Figure 2: The most outstanding performance is the Meme coin MORI on the Solana chain, which has increased by more than 550%.
Relationship between market value ranking and price fluctuation
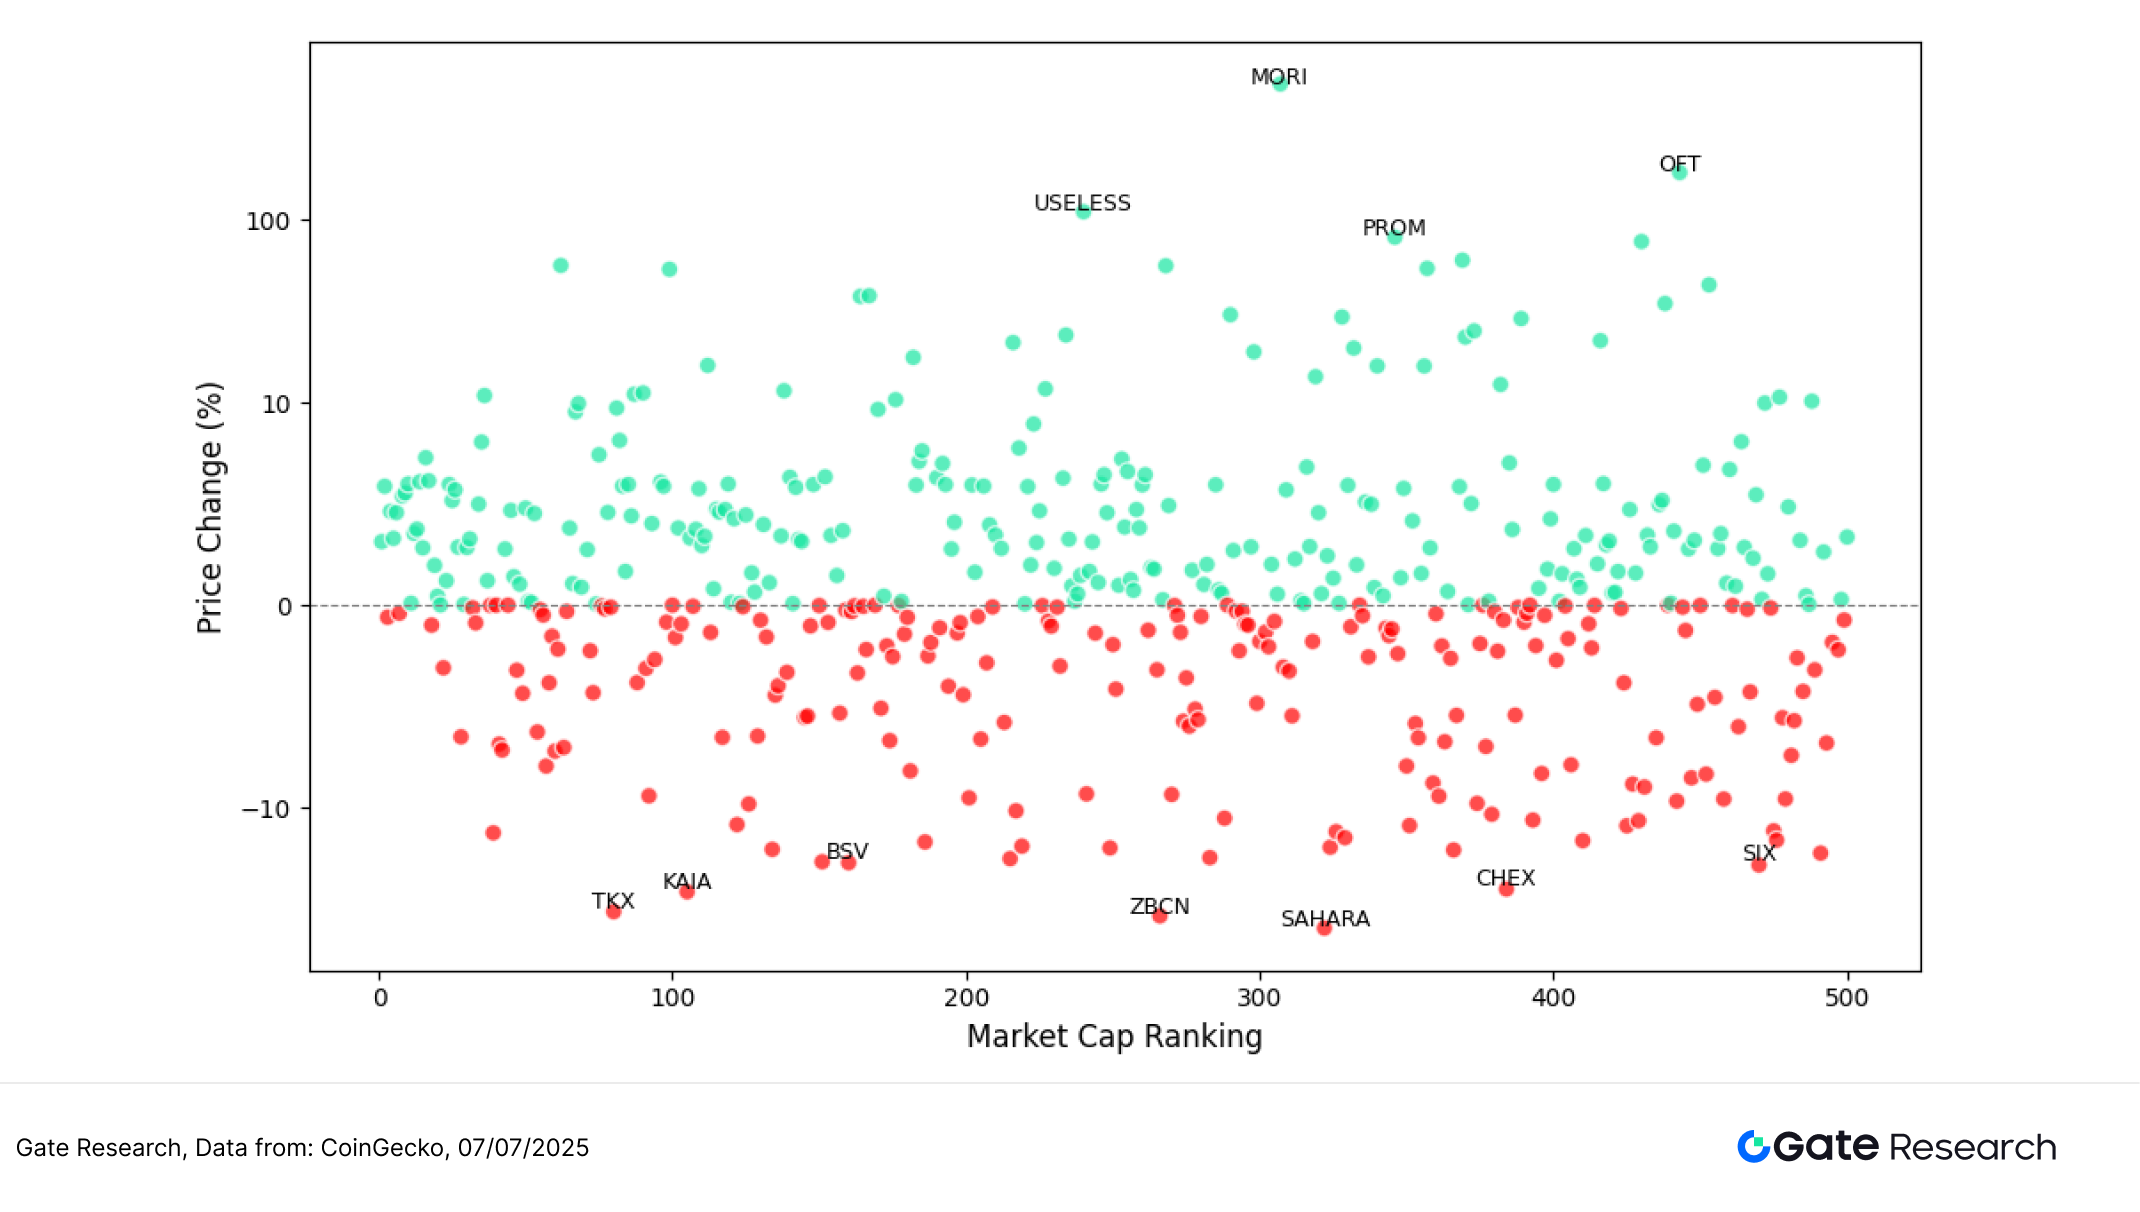
To further analyze the structural characteristics of token performance in this round of market, this article draws a scatter plot of the top 500 tokens by market value. The horizontal axis is the market value ranking (the further to the left, the larger the market value), and the vertical axis is the price increase or decrease from June 24 to July 7, displayed on a logarithmic scale. Each dot in the figure represents a token, with green indicating an increase and red indicating a decrease.
From the overall distribution, the proportion of rising tokens is about 55%, indicating that although the market sentiment has shown signs of warming up, it has not yet formed a comprehensive rebound, and the overall market is still inclined to structural differentiation. Most of the tokens with outstanding gains are small and medium-sized market capitalization tokens, especially MORI, OFT, USELESS, PROM, etc., which are obviously in the high-growth area in the figure, reflecting that market funds tend to focus on projects with topicality, community foundation or hype. Such assets usually have stronger social communication power and short-term explosive potential, so they are more likely to attract attention and liquidity concentration in a volatile market.
The overall increase in the mid- to late-stage market value range is relatively stable, indicating that funds tend to rotate in small and medium-sized market value sectors. In contrast, projects such as SAHARA and ZBCN are at the forefront of the decline, mostly due to the decline in popularity or lack of narrative support, becoming the focus of capital withdrawal.
Overall, the current market trend is not dominated by mainstream assets, but rather presents structural characteristics of "mainstream stability, small-cap assets active, and obvious differentiation". Funds prefer small and medium-sized tokens with community popularity, subject matter speculation space, or mechanism innovation, while assets lacking liquidity and topic support face greater downward pressure.
Figure 3: More than half of the top 500 tokens by market capitalization rose, with the increase concentrated between 0-50%. Small and medium-sized market capitalization projects are relatively more active
Top 100 Market Capitalization List
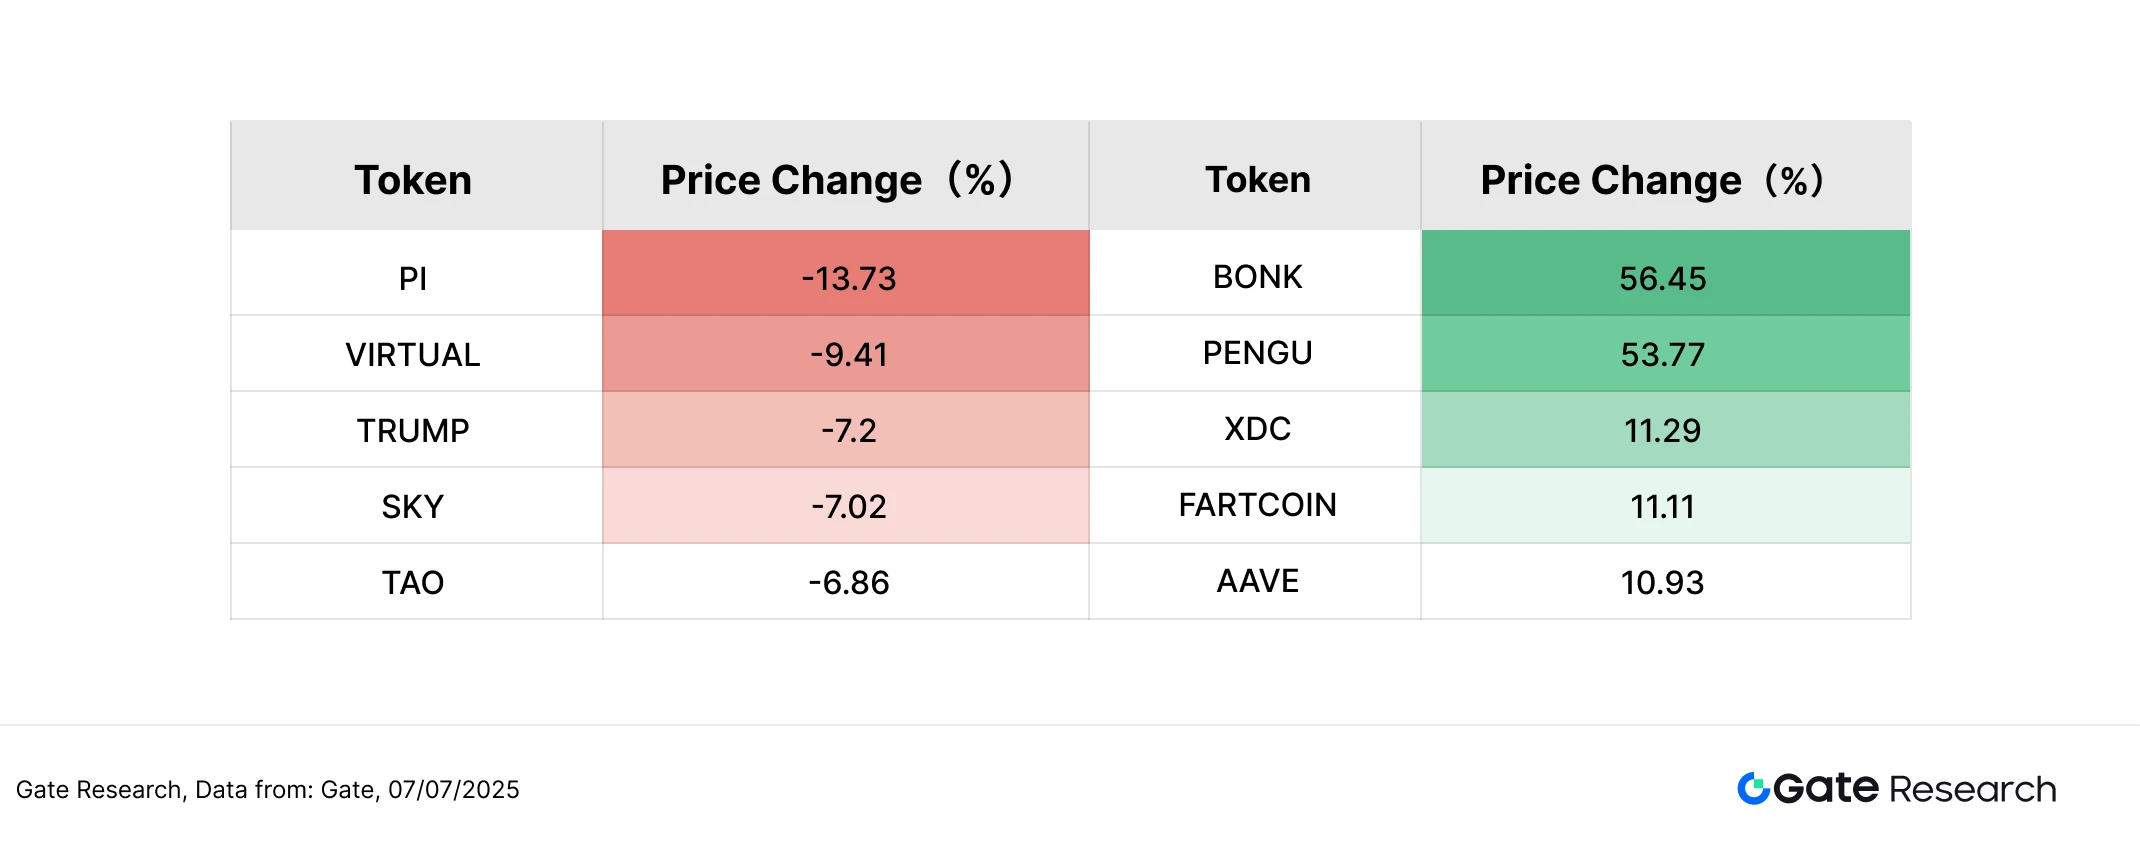
In the context of this round of volatile market, the top 100 tokens by market value have maintained a relatively stable performance. After excluding stablecoins and LSD (liquid pledge derivatives), the top five tokens with the highest increase are BONK (+ 56.45%), PENGU (+ 53.77%), XDC (+ 11.29%), FARTCOIN (+ 11.11%) and AAVE (+ 10.93%). Most of these projects have strong narrative, active communities or high trading popularity, indicating that funds tend to deploy high Beta targets in volatile markets.
Among them, BONK and PENGU, as representative Meme projects on the Solana chain, not only benefit from macro-favorable expectations such as ETFs, but also stand out in the market with their strong community foundation and continuous topic dissemination capabilities; although FARTCOIN belongs to the Meme category, the mechanism centered on AI interactive gameplay has triggered short-term capital pursuit, showing typical high volatility characteristics. AAVE and XDC show the resilience of traditional DeFi projects in this cycle. The former benefits from the continuous upgrade of lending agreements, while the latter benefits from the warming of RWA narratives. In addition, Credefi and CRYMBO deployed loan and compliance tools on their chains at the end of June, further strengthening their application expectations in the traditional financial asset chain scenario.
On the other hand, some of the top 100 tokens by market value recorded significant declines, and their performance was relatively under pressure. The top five tokens with the largest declines were PI (-13.73%), VIRTUAL (-9.41%), TRUMP (-7.20%), SKY (-7.02%), and TAO (-6.86%). Most of them were projects with significant gains in the previous period and rapid rise in topic popularity. In the absence of new catalysts, they entered a consolidation period, and their prices fell to a certain extent. Among them, PI and VIRTUAL attracted market attention in May due to ecological progress and concept speculation respectively. This month, in the absence of new catalysts, they faced the dual pressure of profit-taking and sentiment decline, and their trends tended to converge.
In general, the top 100 tokens by market capitalization currently show a pattern of “the strong get stronger and themes rotate”. Projects with clear narratives and trading popularity are more likely to gain market favor, while speculative assets that lack sustained support are prone to pullbacks, highlighting the structural differentiation trend in the volatile market.
Figure 4: The leading tokens in the top 100 by market capitalization are mainly distributed in sectors with active trading or high narrative popularity, reflecting that market funds prefer to allocate to mainstream projects with topical and responsiveness.
2. Analysis of this round of volume growth
Volume Growth Analysis
Based on the analysis of token price performance, this article further observes the changes in the trading volume of some tokens in this round of market. Based on the trading volume before the market started, the growth rate of trading volume as of July 7 was calculated to measure the changes in market heat and trading activity.
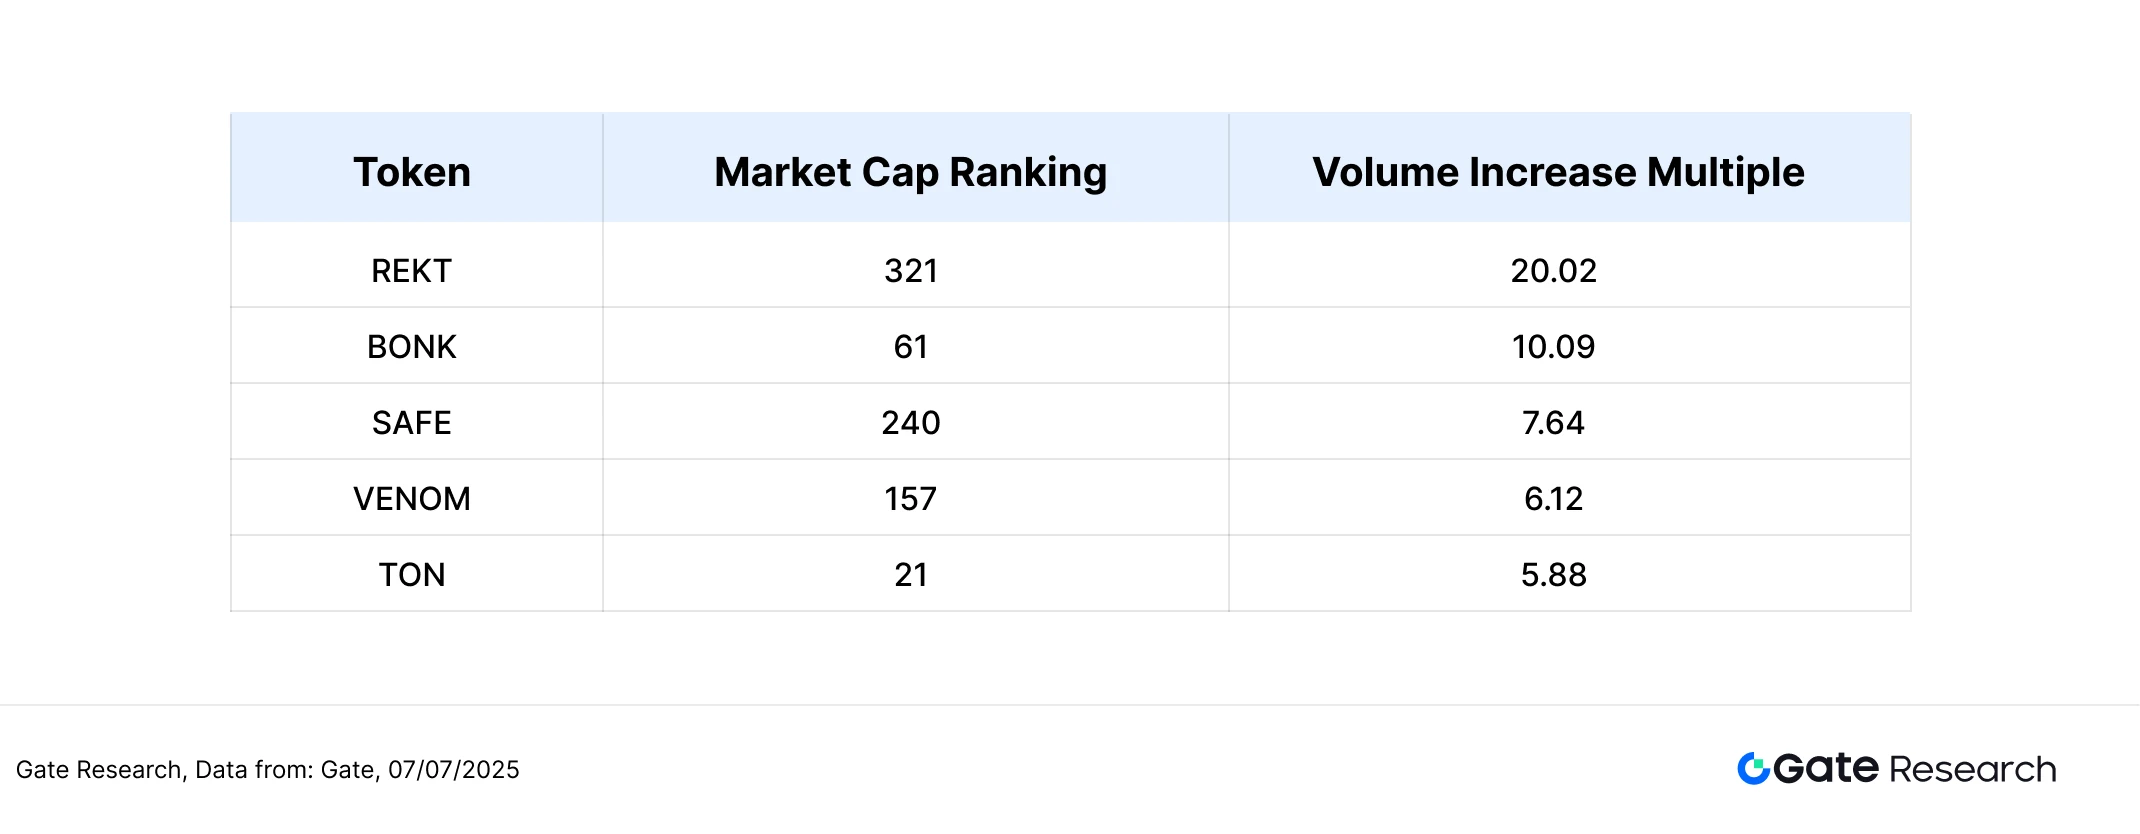
Data shows that REKT, which ranks outside the top 300 in terms of market capitalization, has seen its trading volume increase by more than 20 times. Although the price rebound is relatively mild (+11.03%), it has shown obvious signs of short-term capital speculation. REKT is a Meme project that focuses on a minimalist issuance model of "no pre-mining, no token distribution, and no private placement". Its core mechanism is anonymous issuance of coins on the chain. Due to its high risk and high volatility, it has attracted a lot of speculative funds. The trading volume of Solana's Meme coin BONK has increased by more than 10 times, and the price rebound has reached 56%, continuing the strong performance mentioned in the previous paragraph, showing that it is still a trading target that funds pay close attention to, driven by community momentum and platform development.
Others such as SAFE (+ 7.64 times), VENOM (+ 6.12 times) and TON (+ 5.88 times) also recorded significant volume growth. Among them, VENOM recorded a nearly 40% increase driven by project expansion and community, while TON, despite a significant increase in volume, had a slight price correction (-2.75%), which may indicate that the capital inflow came more from short-term arbitrage or selling pressure.
From the perspective of market capitalization structure, most of the projects in this round of volume increase are concentrated between the 50th and 300th in market capitalization rankings, with characteristics such as moderate size, high volatility and active liquidity, and are easy to become the target of short-term funds. Although the rapid increase in trading volume may not be accompanied by a continuous upward price, it often means that the market's attention is increasing, especially in small and medium-sized market capitalization tokens, where volume changes often have leading significance and are suitable as one of the observation signals for short-term market conditions.
Figure 5: The trading volume of small and medium-sized tokens such as REKT and BONK has increased significantly, indicating that market attention is increasing
Volume Changes and Price Analysis
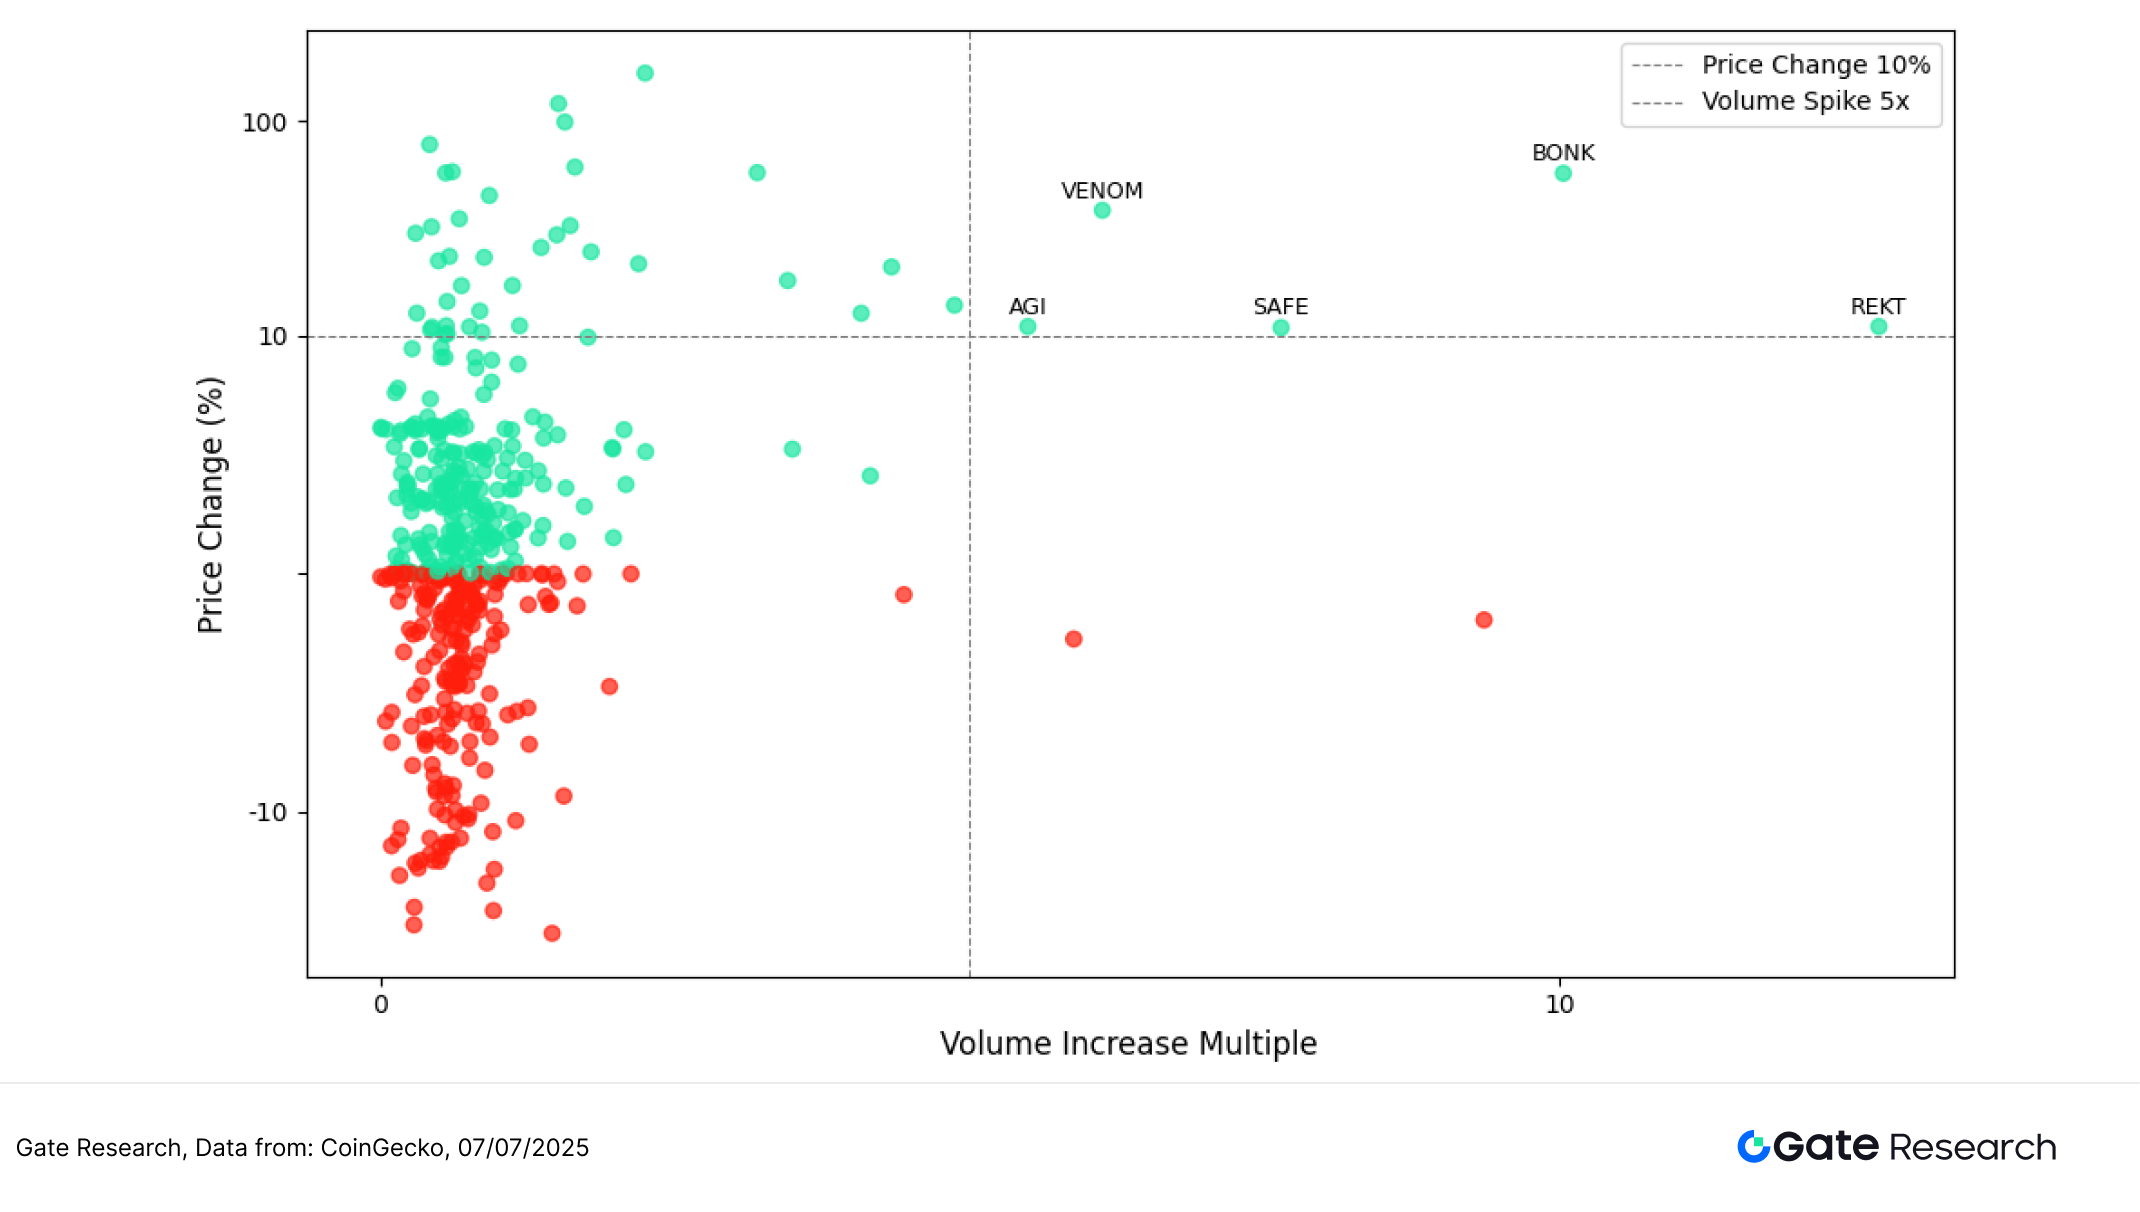
Continuing the observation of the projects with abnormal trading volume in the previous paragraph, this article further combines the price performance and draws a scatter plot of volume increase multiple (Volume Increase Multiple) and price change (Price Change %). The horizontal axis of the figure is the growth multiple of the trading volume of each token in the past two weeks compared with the base period, and the vertical axis is the price increase or decrease in the same period. A symmetrical logarithmic scale is used to more clearly present extreme changes.
Overall, the upper right quadrant concentrates a group of targets that have attracted much attention in this round of market, showing a typical "volume-price resonance" feature. Among them, BONK's trading volume increased by more than 10 times and its price rose by 56%, continuing the strong performance mentioned in the previous paragraph. Driven by the momentum of the Solana community and the Meme craze, it has become the focus of capital pursuit. VENOM and SAFE are also located in this area, with increases of 39.66% and 11.02% respectively, reflecting that their narrative themes are attractive and their capital acceptance is relatively stable.
It is worth noting that although REKT's increase was only about 11%, its trading volume increased by 15 times, and it also fell in the upper right quadrant, showing obvious characteristics of short-term capital game. As a minimalist on-chain coin issuance project with "no pre-mining and no distribution", REKT's performance confirms the market's preference for high-volatility and high-risk assets, and also shows that even if the increase is not as significant as projects such as BONK, the drastic change in volume still has the significance of an indicator of capital momentum.
In contrast, the lower right quadrant gathers some projects that "have increased in volume but not risen synchronously". For example, TON's trading volume has increased nearly 6 times, but its price has slightly adjusted (-2.75%). This may be because the recently launched Golden Visa program has attracted funds to lock up. Although it has driven up the popularity, due to the limited actual buying, the short-term market is still under certain pressure, and its sustainability remains to be seen. In addition, the lower left quadrant is distributed with a large number of assets with no obvious trading volume and price changes, indicating that the current market is still a structural rotation, and funds are focused on individual tokens with themes or community momentum, which have not yet spread to the entire market.
In summary, the linkage between abnormal trading volume and price trend is still a key indicator for identifying short-term capital attention and market start-up potential. Especially in small and medium-sized market capitalization projects, "rapid volume expansion" often precedes price reaction. If accompanied by narrative or community catalysis, it is easier to attract capital to follow up, which constitutes an important reference signal for short-term strategies.
Figure 6: Tokens such as BONK, VENOM, SAFE, and REKT fall in the upper right quadrant, which conforms to the logic of "volume-price resonance" and is a representative case of large-scale increase in this round of market.
Correlation analysis
After exploring the direct relationship between the change in the trading volume of tokens and their price performance, this article further analyzes the structural connection between the two from a statistical perspective. In order to assess whether the market capital activity has a systematic impact on price changes, we introduce "trading volume/market value" as a relative activity indicator and calculate the correlation coefficient between it and the price fluctuation. Through correlation analysis, it is helpful to identify which tokens in the current market are more likely to be driven by capital liquidity, and whether there is a consistent linkage pattern between volume and price, thereby providing investors with a more structural insightful judgment reference.
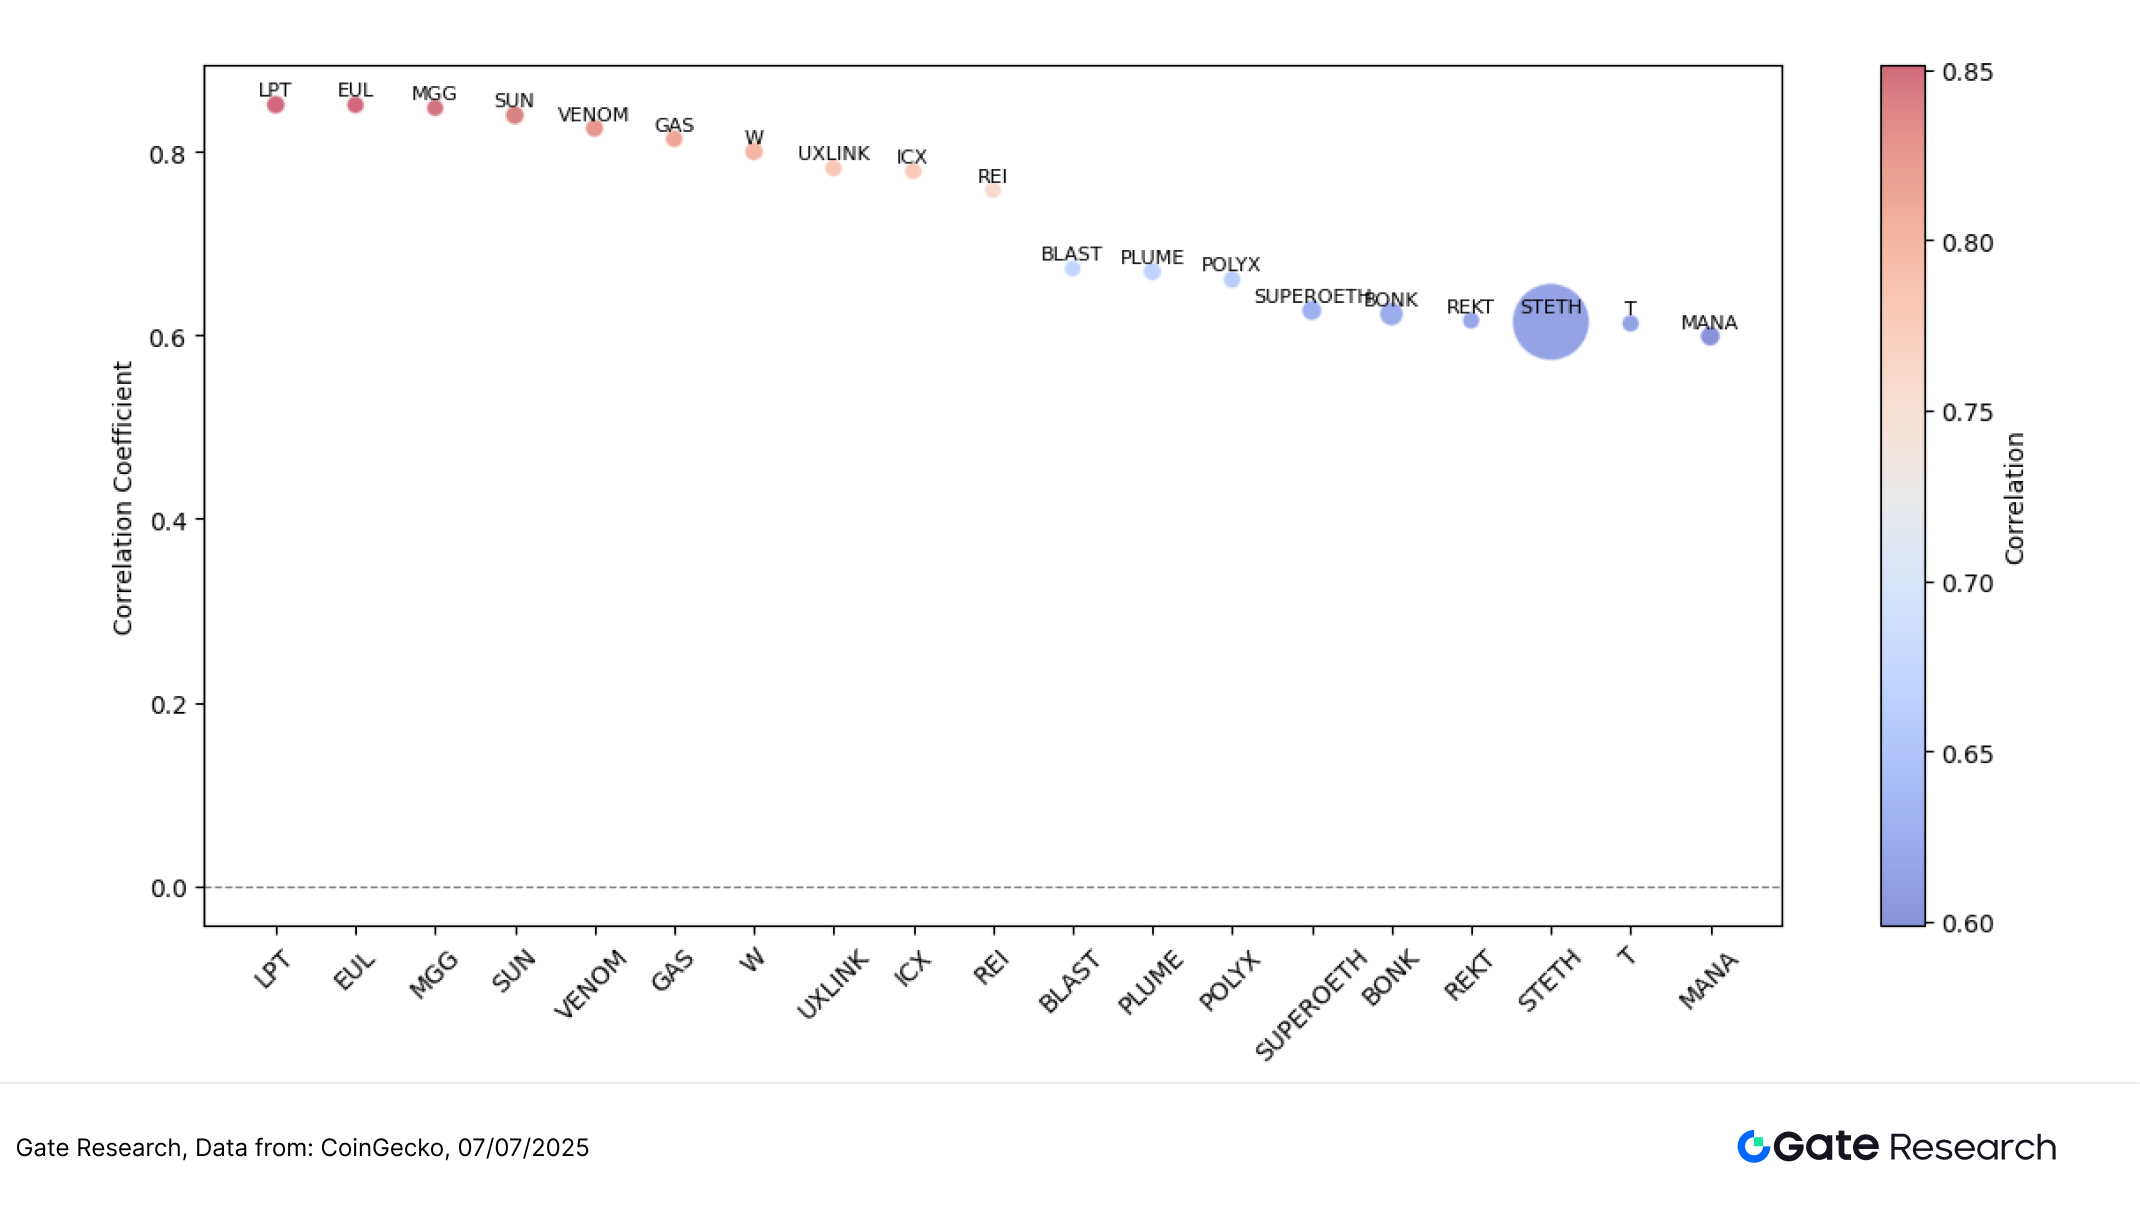
As can be seen from the figure, the correlation between "volume/market value" and price increase of most tokens is concentrated between 0.60 and 0.85, indicating that capital activity has a certain impact on price changes. The color of the points in the figure represents the strength of the correlation coefficient (red is high, blue is low), and the size of the bubble is adjusted according to the market value of the token, reflecting its size difference in the market.
The projects such as LPT, EUL, MGG, SUN and VENOM located in the upper left corner of the figure generally have correlation coefficients between 0.82 and 0.85, and the bubbles are relatively small, indicating that when the trading volume is active, the prices of these small and medium-sized market value tokens are more likely to fluctuate significantly, reflecting the typical "volume-price linkage" characteristics, and often become a hot spot for short-term funds.
On the right side, tokens such as BONK, REKT, STETH and MANA, although the correlation is slightly lower (mostly in the range of 0.60-0.65), have significantly larger market capitalizations and larger bubble volumes, reflecting their sufficient liquidity and extensive capital participation. The volatility of such tokens is relatively mild, and although the degree of volume-price linkage is low, they still play a stable supporting role in the overall market.
Overall, this chart reveals the structural characteristics of "theme-driven + market value diffusion": small and medium-sized currencies are more likely to form short-term explosions driven by funds, while large-cap projects receive mainstream funds and remain relatively stable. Investors can identify changes in trading popularity based on this, and combine the correlation between activity and increase to optimize short-term strategies and medium-term allocation directions.
Figure 7: The volume and price of LPT, EUL, SUN, VENOM and other tokens are highly linked, showing the characteristics of concentrated capital speculation; REKT, STETH and other tokens have large market capitalizations and perform relatively steadily
In summary, although the crypto market has not yet seen a comprehensive rebound, the structural rotation characteristics are becoming more and more obvious, and funds are clearly inclined to pursue small and medium-sized market value assets with narrative heat and trading activity. Volume fluctuations and theme catalysis are becoming key references for identifying short-term trading opportunities and capital momentum in the current market.
In addition to the active trading market, there are also multiple potential airdrop projects being promoted simultaneously in this period, covering popular tracks such as data intelligence, modular infrastructure, AI interaction and on-chain identity. If users can grasp the rhythm, they are expected to make early arrangements during the market volatility period and obtain potential token benefits. The following will briefly sort out the current airdrop tasks and participation methods that are worth paying attention to.
Airdrop Hot Projects
This article sorts out the potential airdrop projects that deserve special attention from June 24 to July 7, 2025, covering Altius (emerging data intelligence protocol), Camp Network (modular blockchain infrastructure), ChainOpera (AI-driven on-chain interactive platform) and Sapien (on-chain identity and social points platform) and other active Web3 newcomers. These projects are generally in the early stages and are attracting user participation through incentive test networks, task systems, AI interactions and social bindings. Points, badges and identity authentication mechanisms may become an important reference for token distribution in the future. Users can continue to accumulate points by registering accounts, binding wallets and social accounts, and participating in daily tasks, and lock in potential airdrop qualifications in advance. The following will explain in detail the basic positioning, latest activities and participation paths of each project to help users keep up with the pace and lay out early dividends.
Altius
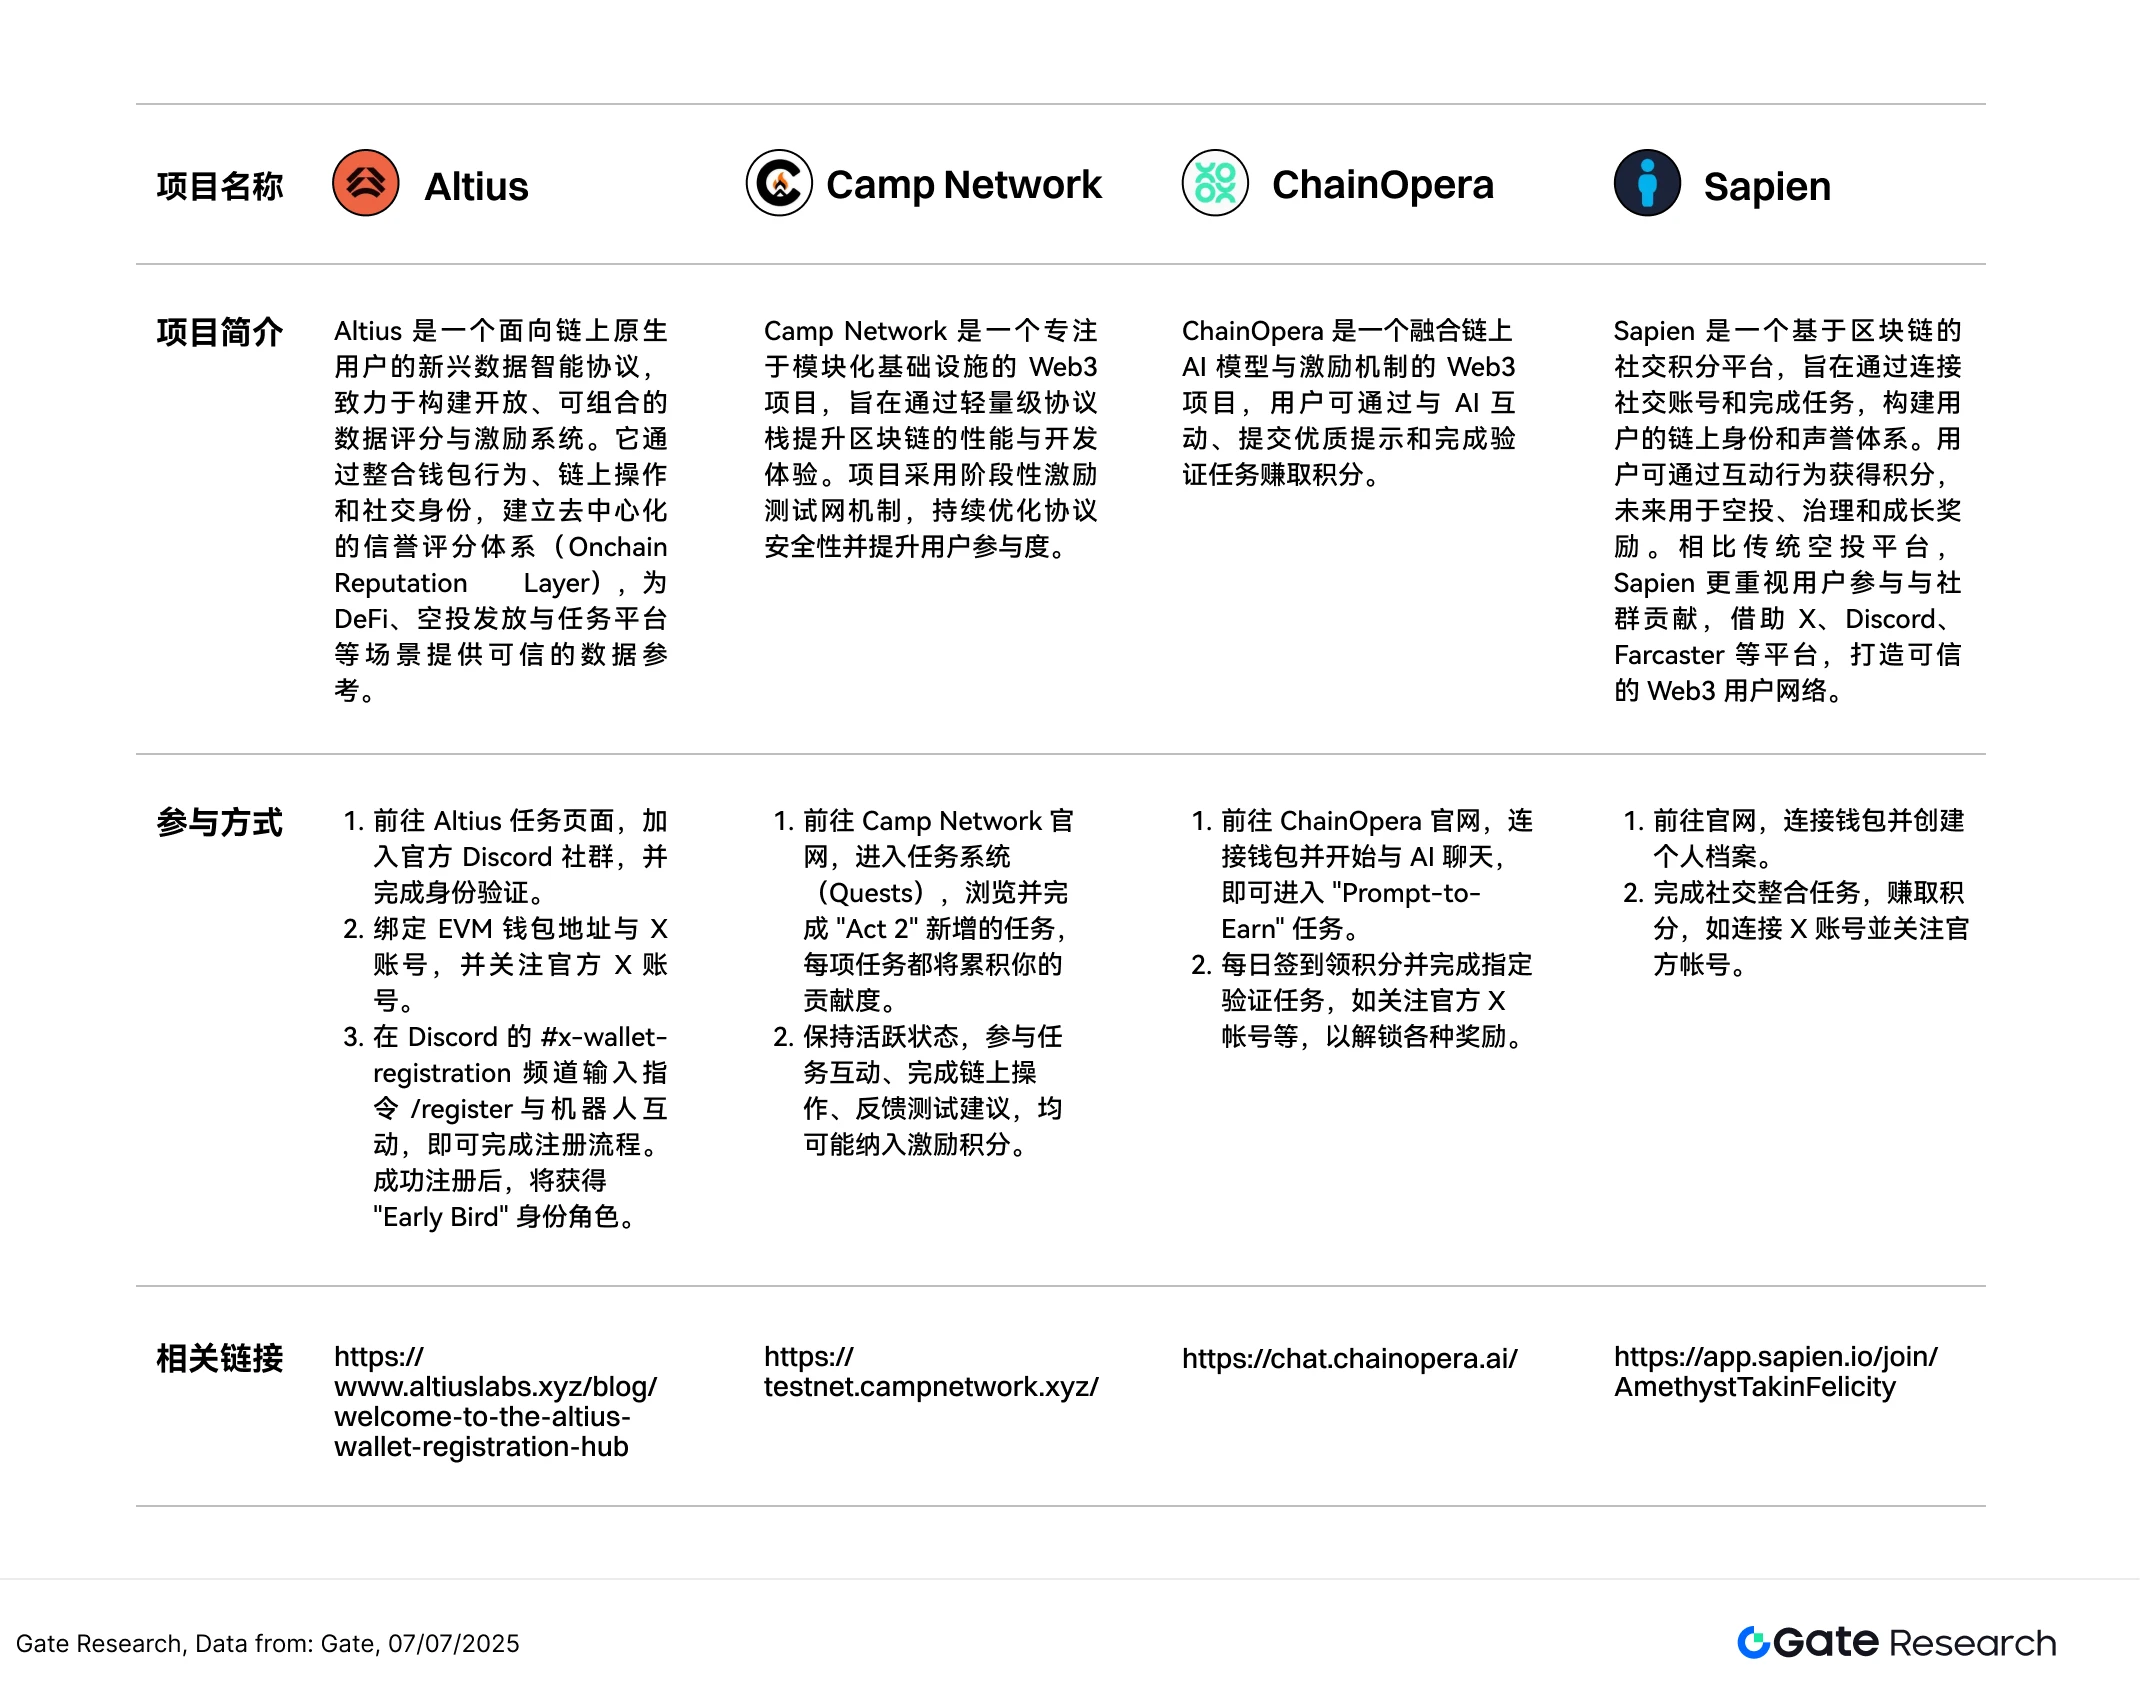
Altius is an emerging data intelligence protocol for native on-chain users, dedicated to building an open, composable data scoring and incentive system. By integrating users' wallet behavior, on-chain operation records and social identities, Altius aims to establish a decentralized reputation scoring system (Onchain Reputation Layer) to provide trusted data references for applications such as DeFi, airdrop distribution, and task platforms. [2]
Currently, Altius is opening applications for the Early Bird role for a limited time. This is an important identity for early supporters, who may enjoy exclusive airdrops, whitelist participation qualifications, or platform points incentives in the future.
How to participate:
1. Go to the Altius mission page, join the official Discord group, and complete identity verification.
2. Bind the EVM wallet address to the X account and follow the official X account.
3. Enter the command /register in the #x-wallet-registration channel of Discord to interact with the robot to complete the registration process. After successful registration, you will obtain the "Early Bird" identity role.
Camp Network
Camp Network is a Web3 project that focuses on building modular infrastructure. It aims to promote the performance expansion and development experience of blockchain networks through a lightweight protocol stack. It adopts a phased incentive test network mechanism to continuously optimize protocol security and participant activity. [3]
Currently, Camp Network has officially launched the "Incentivized Test Network V2 Phase 2 (Act 2)" and launched new tasks. Users can earn points by completing tasks, which may be used for airdrops or test network reward settlement in the future.
How to participate:
1. Go to the Camp Network official website, enter the Quests system, browse and complete the new quests added in "Act 2". Each quest will accumulate your contribution points.
2. Stay active, participate in task interactions, complete on-chain operations, and provide feedback on test suggestions, which may all be included in the incentive points.
ChainOpera
ChainOpera is a Web3 project that combines on-chain AI models with incentive mechanisms. Users can earn points by interacting with AI models, submitting quality tips, completing verification tasks, etc. The platform has currently launched the "Prompt-to-Earn" interactive task activity and the second season airdrop. Early participants will have the opportunity to obtain badges, ranking rewards, and future token airdrop qualifications. [4]
The platform has currently launched the "Prompt-to-Earn" interactive task activity and the second season airdrop. Early participants will have the opportunity to obtain badges, ranking rewards and future token airdrop qualifications.
How to participate:
1. Go to the ChainOpera official website, connect your wallet and start chatting with the AI to enter the "Prompt-to-Earn" task.
2. Sign in daily to collect points and complete designated verification tasks, such as following the official X account, to unlock various rewards.
Sapien
Sapien is a blockchain-based social points platform that aims to build a user's on-chain identity and reputation system by connecting social accounts and completing tasks. Users can earn points through interactive behaviors, which will be used for airdrops, governance, and growth rewards in the future. Compared with traditional airdrop platforms, Sapien attaches more importance to user participation and community contribution, and uses platforms such as X, Discord, and Farcaster to build a trusted Web3 user network. [5]
Currently, the platform has launched a number of activities. Users only need to complete simple tasks to earn points, which can be used for reward distribution, airdrop allocation or platform governance in the future.
How to participate:
1. Go to the official website, connect your wallet and create a personal profile.
2. Earn points by completing social integration tasks, such as connecting to X account and following official accounts.
hint
The airdrop plan and participation methods may be updated at any time. Users are advised to follow the official channels of the above projects for the latest information. At the same time, users should participate with caution, pay attention to risks, and do sufficient research before participating. Gate does not guarantee the subsequent airdrop rewards.
Summarize
Looking back at the market cycle from June 24 to July 7, 2025, the overall crypto market maintained a high-level shock consolidation pattern. Although there was no systematic recovery, some small and medium-sized market value tokens performed well under the drive of structural fund rotation and local themes, indicating that the market heat has not yet significantly receded. The average increase of the top 500 tokens by market value was 3.07%, among which the tokens ranked in the 301-400 range performed the best, with an average increase of nearly 8%, reflecting that funds still prefer assets with topicality, narrative potential and price elasticity.
From the perspective of trading volume changes, projects such as BONK, REKT, and VENOM have increased significantly, and the trading volume of some tokens has increased by more than 10 times, becoming the focus of short-term market attention, indicating that funds are actively looking for trading targets with explosive potential. The volume-price linkage chart further reveals that projects in the upper right quadrant generally show the resonance characteristics of "volume surge + price increase", which are easily sought after by funds; while some tokens that have increased in volume but have not risen in price at the same time reflect that the market still has differences in their subsequent performance.
Overall, the current market still presents a structural pattern of "theme rotation + mainstream stability", and funds are seeking game space between narrative-driven and high-volatility targets. Volume fluctuations are still an important signal for identifying market starts and judging structural rotations, especially in small and medium-sized market value assets. If the subsequent macroeconomic and regulatory environment continue to release positive expectations, the market is expected to gradually accumulate momentum in the shock, laying the foundation for the recovery of the market in the second half of the year.
In addition, the projects tracked in this issue, such as Altius, Camp Network, ChainOpera and Sapien, cover popular tracks such as data intelligence, modular infrastructure, AI interaction and on-chain identity, with clear tasks and clear participation paths. Most of them are currently in the testing or early incentive stage. Users can accumulate points by binding wallets, completing tasks and inviting friends to obtain subsequent airdrops or rewards. Continuous participation not only helps to obtain token incentives, but also helps to seize the early dividends of Web3.
References:
1. CoinGecko, https://www.coingecko.com/
2.Altius, https://www.altiuslabs.xyz/blog/welcome-to-the-altius-wallet-registration-hub
3.Camp Network, https://testnet.campnetwork.xyz/
4.ChainOpera, https://chat.chainopera.ai/
5.Sapien, https://app.sapien.io/join/AmethystTakinFelicity
Gate Research Institute is a comprehensive blockchain and cryptocurrency research platform that provides readers with in-depth content, including technical analysis, hot spot insights, market reviews, industry research, trend forecasts, and macroeconomic policy analysis.
Disclaimer
Investing in the cryptocurrency market involves high risks. Users are advised to conduct independent research and fully understand the nature of the assets and products purchased before making any investment decisions. Gate is not responsible for any losses or damages resulting from such investment decisions.