
HashWhale BTC Mining Weekly Report | Bitcoin fluctuates in a narrow range, and the mining cost in Q2 increased by 9.4% (June 14-June 20)
Author: Monchi | Editor: Monchi
1. Bitcoin Market
From June 14 to June 20, 2025, the specific trend of Bitcoin is as follows:
June 14: Bitcoin briefly rose to $105,889 in the early trading of the day, and then fell to $104,835 after a technical correction. Although it once rebounded to $106,109, the bullish momentum was insufficient, and the price began to fluctuate downward, and finally closed at $104,867, showing an overall trend of rising and falling, reflecting signs of market high pressure.
June 15: The market continued the volatile pattern of the previous day. The bears continued to suppress the price to around $104,400 before stopping the decline. Then the bulls gradually took control, and the price slowly climbed to $105,500 and went sideways. Subsequently, BTC further rose to $106,114, and then slightly adjusted back to around $105,000 to stabilize, closing at $105,591. The overall performance was volatile and strong.
June 16: Bitcoin briefly pulled back to $104,572 in the early trading session, then quickly turned strong and started a steady upward trend. The price continued to rise amid fluctuations, reaching an intraday high of $107,000. After a brief consolidation, it continued to rise and finally closed at $107,486, recording a significant increase, showing that bullish confidence has recovered.
June 17: Continuing the previous trading day's strength, Bitcoin further rose to $108,845 after opening, and encountered heavy selling pressure after reaching a staged high. The price then quickly fell back, hitting a low of $106,286. Although it once rebounded to $107,682, the bears continued to exert pressure and weakened again. It finally closed at $104,251 during the day, with a significant daily amplitude and intensified market volatility.
June 18: Bitcoin continued its weakness from the previous day, dropping to $103,622 in the morning, a new low. It then quickly rebounded to $105,181, briefly adjusted back and traded sideways around $104,560, then fluctuated upward to $105,537 before falling back again. The volatility intensified in the evening, with fierce bull-bear competition, and the price closed at $104,829 at the end of the day.
June 19: The overall market trend on that day showed a trend of oscillation and convergence, and the fluctuation range gradually narrowed. In the early trading stage, it tested up and down several times, reaching a minimum of US$103,695, and then rebounded quickly and maintained a narrow range of fluctuations around US$104,850. The overall intraday fluctuation was significantly narrower than that of the previous few days, reflecting the market's short-term wait-and-see sentiment. In the end, Bitcoin closed slightly lower, closing at US$104,121 on the daily line, continuing the rhythm of consolidation.
June 20: Bitcoin continued the weak and volatile pattern of the previous day, and once dropped to $103,988 during the session, then the decline was temporarily halted and a slow upward trend began. The current price shows some signs of stabilization at a low level. As of the time of writing, Bitcoin is trading around $104,700, temporarily reported at $104,702. The overall trend is still in a narrow range of fluctuations, and the subsequent direction needs to be further confirmed by trading volume and macro sentiment.
Summarize
This week, Bitcoin as a whole showed a market structure of "blocked rise, oscillating and falling". From June 14 to 15, Bitcoin fluctuated and consolidated in the range of US$104,000 to US$106,000, with obvious bull-bear tug-of-war; from June 16 to 17, the price once broke through strongly, from around US$104,500 to a high of US$108,800, but the high pressure was obvious, and then quickly fell back to the US$103,600 area, indicating that the bullish momentum was weakening; from June 18 to 20, the market fell into a stage of oscillation and convergence after the correction, with fierce bull-bear game, gradually narrowing the amplitude, and the market wait-and-see sentiment heated up. Overall, the short-term direction is still unclear, and the subsequent trend needs to be guided by trading volume and news.
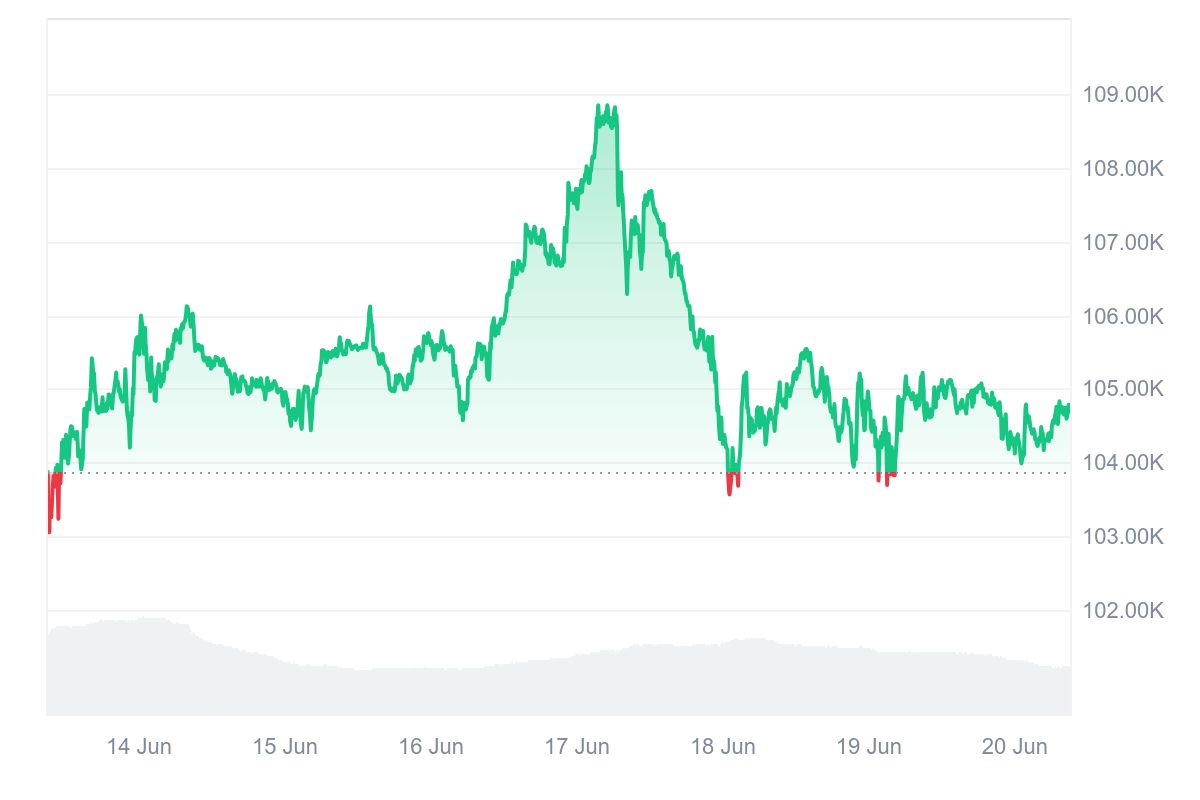
Bitcoin price trend (2025/06/14-2025/06/20)
2. Market dynamics and macro background
Fund Flows
1. Low on-chain fund activity + large investors lock up their positions: Bitcoin market enters a wait-and-see phase
According to CryptoQuant and Alphractal data, the amount of Bitcoin transferred by whales and retail investors to exchanges has hit a new low in the cycle since June, and the number of on-chain transactions has dropped to an 18-month low. This reflects that the market speculation continues to cool down, and investors are more inclined to "hold coins and wait and see" rather than trade frequently. At the same time, more than 20,000 addresses hold Bitcoin positions worth more than 10 million US dollars, with a total locked position of nearly 200 billion US dollars, accounting for 9.43% of the total supply, indicating that large investors are still highly confident in the medium and long-term trend, providing structural support for the spot market.
2. Bitcoin derivatives market: Both funding rates and option structures show strong bullish sentiment
According to data from CryptoQuant and Glassnode, the funding rate of Bitcoin perpetual contracts remained positive (+0.0049%) on June 18, indicating that longs need to pay shorts. This structure represents the mainstream bullish market expectations.
At the same time, the skew (skew indicator) of the options market is clearly biased towards the OTM (out-of-the-money) bullish direction, indicating that capital flows are tilting in the bullish direction and long leveraged positions dominate the market structure.
3. Bitcoin continues to flow out of exchanges: the sentiment of locking up is high
According to a joint report by AMINA Bank and Glassnode, over the past 30 days, the average daily net outflow of bitcoins from exchanges was about 72,000, which was significantly negatively correlated with the 4.4% increase in bitcoin prices during this period (– 0.605).
This indicates that users are transferring Bitcoin out of exchanges and into self-custodial wallets, and the lock-up behavior continues to increase, further weakening short-term selling pressure and providing support for the stability and breakthrough of the medium-term price structure.
4. The growth of stablecoin market value provides ammunition for market liquidity
As of June, the total market value of stablecoins has reached 250 billion US dollars, and the average daily on-chain circulation is about 15 billion US dollars. The continuous issuance of USDT and USDC has enhanced market liquidity, provided liquidity support for the rise of spot and derivative markets, and also become a direct medium for new funds to enter the market.
5. Spot ETF funds dominate the market structure, and institutions accelerate the acquisition of shares of native exchanges
Bitcoin spot ETF is becoming the main channel for market capital inflows, and its trading volume has risen to 25% of the global BTC spot market, a leap compared to 10% in October 2024, and once approached 30%.
This week's daily ETF inflow/outflow details:
June 16: +$412.2 million in net inflows
June 17: +$216.5 million in net inflows (seventh consecutive day of net inflows)
June 18: +$388.3 million in net inflows
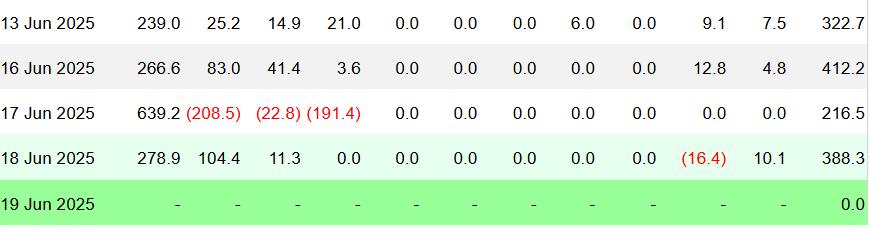
ETF Inflow/Outflow Data Image
This high-intensity inflow not only strengthens the price discovery mechanism of the ETF, but also further diverts funds and users from native crypto exchanges.
However, in the short term, the net inflow of funds in some mainstream ETFs has paused. On June 18 and 19, mainstream ETFs including ARK and Invesco all recorded "zero inflow". This change does not constitute a trend reversal, but reflects that short-term capital sentiment has turned to wait-and-see, and may be waiting for further clarification of macroeconomic policies, market directions or Fed dynamics, reflecting the sensitive response of capital flows to uncertainty.
In general, the rapid rise of spot ETFs is reshaping the trading structure and funding structure of the Bitcoin market. ETF products are considered an ideal tool for institutional funds to enter the market due to their compliance, simplified custody process and lower trading threshold. With the in-depth penetration of Wall Street's financial infrastructure, the dominance of crypto-native trading platforms is gradually weakening, and the global Bitcoin capital flow is moving from "on-chain native ecology" to a deep transformation stage of "compliance-led".
Technical indicator analysis
1. Relative Strength Index (RSI 14)
According to Investing.com data, as of June 20, Bitcoin's 14-day relative strength index (RSI) was 55.528, which is in the "neutral to strong" range (50-70). The current RSI level indicates that market momentum is gradually recovering, and buying sentiment has rebounded moderately, but it has not yet entered an overbought state. This value reflects that investors still have a certain degree of confidence in the future market. Although there are no signs of sharp rises in the short term, the technical structure of "slow bottoming" has initially emerged. If the RSI returns to above 55, it indicates that the short-term selling pressure has been digested and the market has the potential for further rebound. If the RSI can continue to break through 60, it will further strengthen the bullish trend or push the price to test the previous high pressure level (about $106,500 area). On the contrary, if the RSI falls back below 50 again, it is necessary to pay attention to the market's possible return to a weak and volatile pattern.
In summary, the RSI is currently in the "oscillation to strength" stage, which is a typical signal of recovery. The technical side tends to be slightly bullish, but it is still necessary to observe the coordinated performance of trading volume and price to confirm an effective breakthrough.
2. Moving Average (MA) Analysis
5-day moving average (MA 5): $105,412.20
20-day moving average (MA 20): $106,200.73
50-day moving average (MA 20): $100,688.22
100-day moving average (MA 100): $94,518.36
200-day moving average (MA 200): $89,697.33
Current market price: $104,771.40
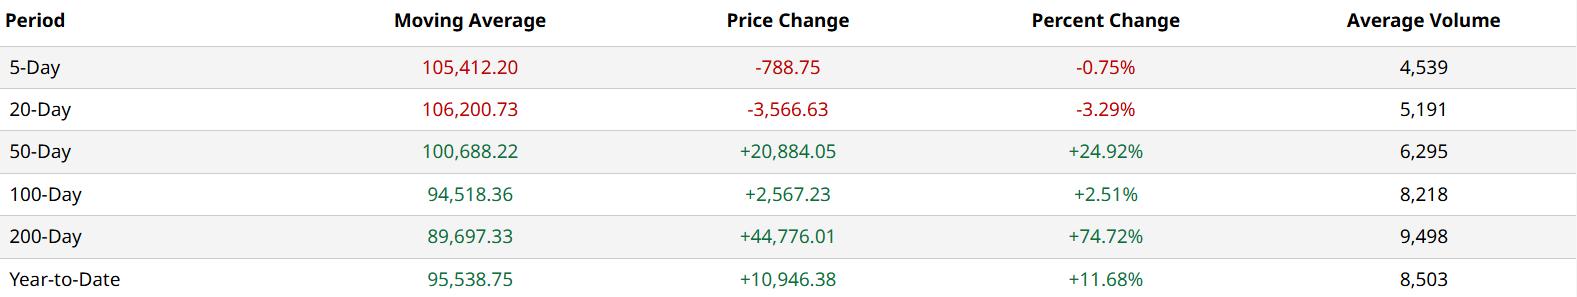
MA 5, MA 20, MA 20, MA 100, MA 200 data pictures
From a short-term perspective: The current price is below the MA 5 and MA 20 moving averages, indicating that the short-term trend is slightly bearish. Short-term prices are under pressure and there is a certain risk of falling.
From a medium-term perspective: However, the price is still significantly higher than MA 50, MA 100, and MA 200, indicating that the medium- to long-term trend still maintains an upward structure.
MA 50 and MA 100 present a “golden cross” pattern and at the same time stay away from MA 200, which is a typical bull market arrangement structure.
If the price can regain MA 20 in the short term, the rebound momentum may be restarted; on the contrary, if it continues to be constrained by MA 20, it is necessary to pay attention to the effectiveness of the support near MA 50 below (US$100,700).
Summary: The overall trend is "mid-term bullish, short-term fluctuations weak".
3. Moving Average Convergence Divergence (MACD) Analysis
According to Investing.com data, the MACD fast line is currently below the slow line, with a difference of -17, which is a negative value, indicating that the market momentum is still in the downward range. The histogram shows a gradual contraction pattern, indicating that the short-term momentum is weakening and tending to the crossover point.
The current MACD sends a "Sell" technical signal, but it is not a strong short signal, but closer to the "weak momentum + wait and see" stage. If a "golden cross" is formed later (MACD fast line crosses the slow line), it will be an important reversal confirmation signal. If the fast and slow lines continue to decline, it is necessary to pay attention to whether the next round of support points (such as near MA 50) will be broken.
Summary: MACD shows that short-term bears dominate, but the bearish momentum is marginally weakened, which belongs to the "low momentum oscillation" stage, and we need to wait for a clear directional breakthrough signal.
4. Key support and resistance levels
Support level: Bitcoin's current short-term key support levels are at $103,500 and $103,000. During the trading on June 18 and 19, Bitcoin showed signs of stabilization when approaching the $103,500 support level, and rebounded several times, indicating that this area has significant buying power. If the market falls back again in the future, this range is expected to continue to play a supporting role and become a key position for short-term bullish defense.
Resistance: The short-term core resistance levels are located at $105,500 and $106,000, and the medium-term resistance level above is located near $109,000. On June 18, Bitcoin failed to break through the $105,500 price after probing it, and then fell back, indicating that there is strong selling pressure in this area. Earlier this week, from June 14 to 16, Bitcoin repeatedly probed the $106,000 price level but failed to break through it. On June 17, the price rose to a high this week, approaching $109,000, but failed to break through and fell under pressure.
On the whole, Bitcoin is currently in a volatile range of $103,000-$106,000. If it can break through the $106,000 resistance in the short term, it is expected to further test the $109,000 area; on the contrary, if it falls below the $103,000 support, it may trigger a larger downward adjustment.
Market sentiment analysis
1. Emotional profile
The overall sentiment in the crypto market remained stable but slightly cautious this week. From June 14 to 17, Bitcoin had a strong trend, rising continuously and briefly breaking through the key resistance level of $106,000, rising to around $109,000, driving up the market's short-term risk appetite and investor sentiment tilted towards optimism.
However, since the evening of June 17, Bitcoin has quickly pulled back and entered a sideways range from June 18 to 20, with the price returning to the $104,000-$105,000 range, causing the market to cool down rapidly. This fluctuation also prompted some short-term investors to turn to the sidelines, and the overall sentiment returned to a neutral and cautious state.
2. Key Sentiment Indicators (Fear and Greed Index)
As an important reference tool for measuring investor sentiment in the crypto market, the Fear & Greed Index can effectively reflect the phased changes in market risk preferences. As of June 20, the index was at 48, in the "neutral" range. This shows that the overall market sentiment is in a wait-and-see state, investors have neither shown strong greed nor significant panic, and trading decisions tend to be rational.
Looking back at this week (June 14 – June 19), the daily values of the index were: 52, 50, 51, 53, 48, 48. Overall, the index remained roughly in the 48-53 range this week. The sentiment was slightly positive in the first half of the week, and then fell back against the backdrop of price fluctuations and slowing inflows of some ETFs, indicating that the market's confidence in the short-term trend has weakened, and investors are waiting for further guidance from the macro or technical aspects. At present, the overall market sentiment is in a state of "neutral zone fluctuations", and no trend extreme signals have yet formed.
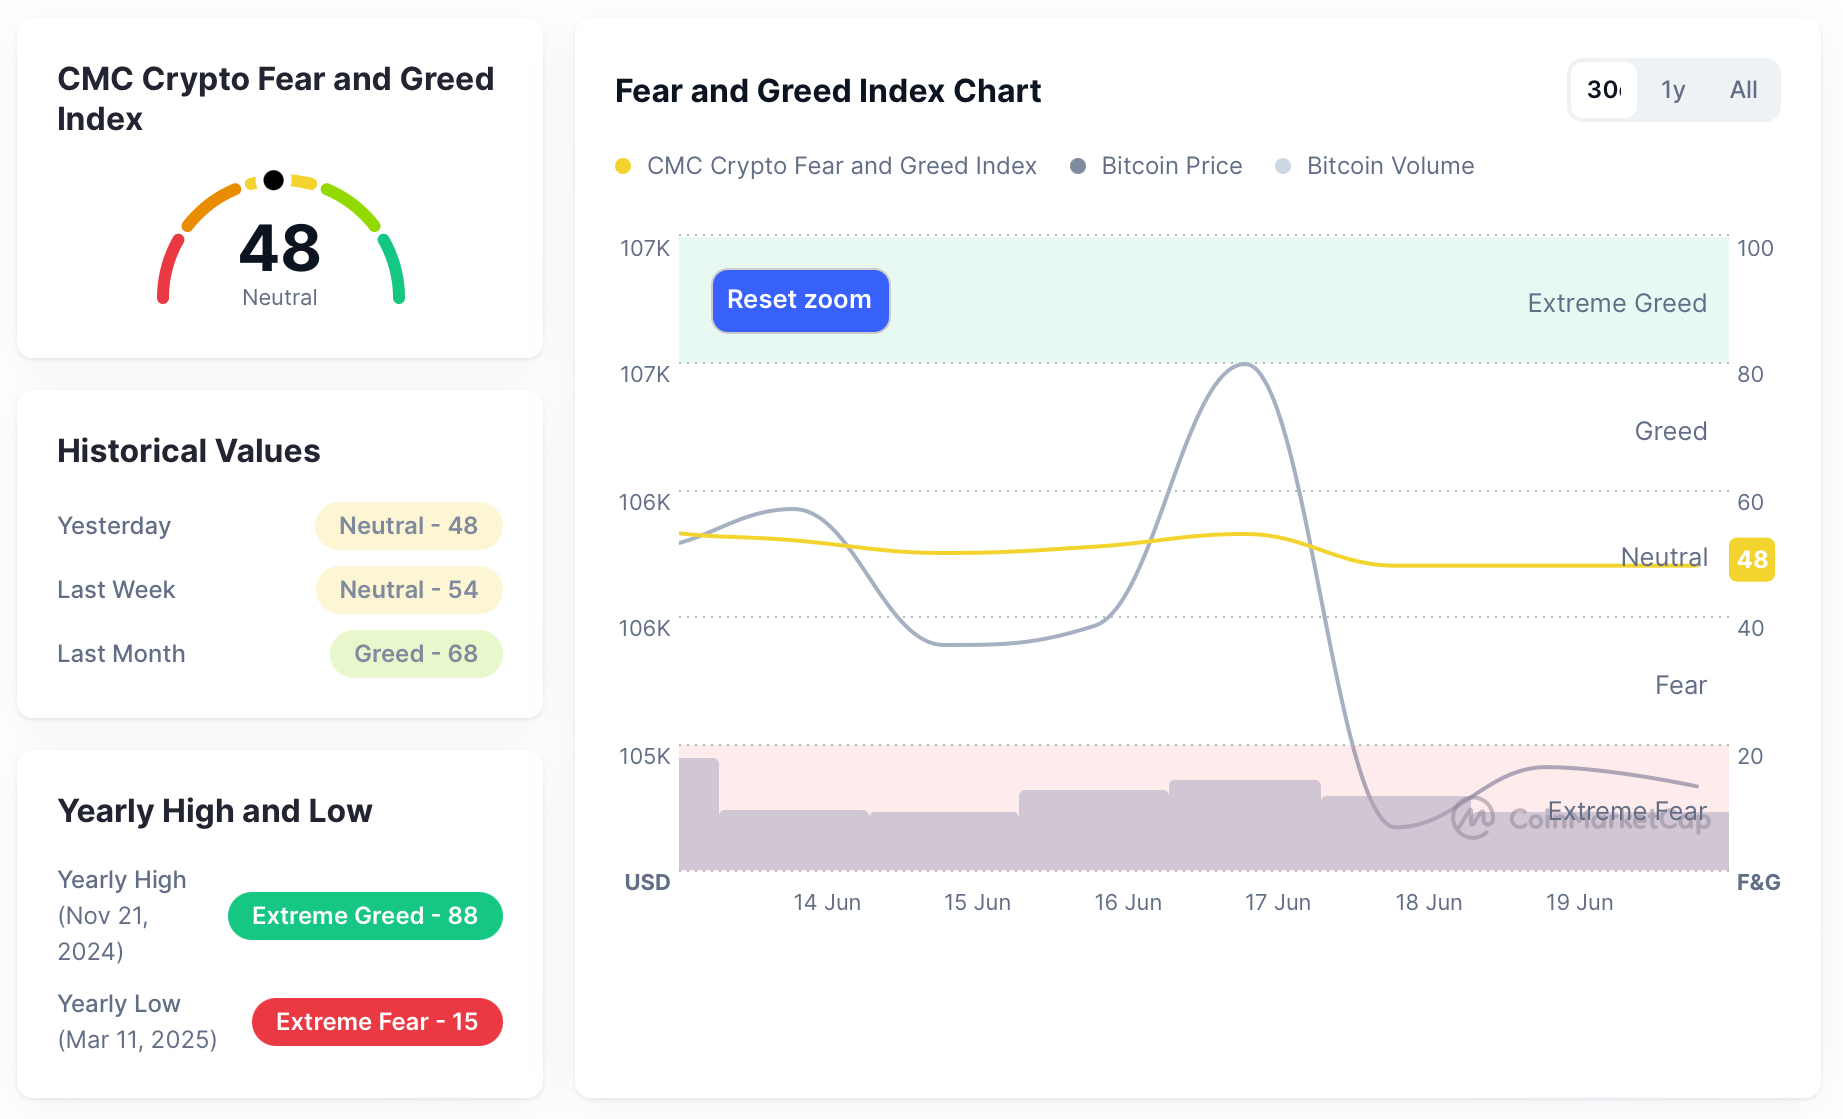
Fear and Greed Index Data Picture
Macroeconomic Background
Expectations of interest rate cuts have cooled, and the market has become more cautious
On June 18, the Fed kept interest rates unchanged at 5.25-5.50% as expected, but the dot plot showed that only one rate cut was expected this year, which was significantly tighter than the "two rate cuts" expected in March. Many officials even expected no rate cuts this year. Powell said he would continue to be "data-driven" and pay attention to the potential impact of tariffs and the situation in the Middle East on inflation. The overall tone was hawkish, weakening the market's expectations for liquidity expansion, suppressing Bitcoin's upward momentum in the short term, and the market turned to a volatile wait-and-see attitude.
Increasing tensions in the Middle East boost risk aversion and inflation concerns
The situation between Israel and Iran escalated again, and the price of Brent crude oil once exceeded $78 per barrel. The former White House national security adviser warned that if the conflict in the Middle East continues to escalate, it will raise global inflation and even trigger an economic recession, and the Federal Reserve may be forced to postpone interest rate cuts. The rise in geopolitical risks has benefited Bitcoin as a "digital gold" from safe-haven demand, but it has also been suppressed by inflation concerns caused by higher oil prices, presenting a mixed situation of long and short positions.
Trump's radical remarks increase policy uncertainty
Trump once again publicly criticized Powell for being "stupid", advocated an immediate interest rate cut of 2 percentage points, and said he was considering "personally serving as the chairman of the Federal Reserve", which caused the market to worry about future policy independence. He also revealed that Iran "is in contact with the United States", which once brought expectations of easing the situation in the Middle East. Although this series of remarks has no substantive policy effect, it has significantly increased the uncertainty of the policy path, boosted the volatility of Bitcoin in the short term, and increased the attention to safe-haven assets.
Macro data outlook: Inflation and consumption data will be the focus <br> According to predictions from crypto media such as BeInCrypto and CoinWorld, a number of key macro data will be released this week, and the market is paying close attention:
Retail sales in May are expected to be -0.6% month-on-month. If the data is weak, it will strengthen expectations of cooling consumption and interest rate cuts.
Initial jobless claims are expected to rise, suggesting pressure on the labor market;
FOMC meeting minutes and officials' speeches will continue to release policy guidance signals.
Overall, if the data is generally weak, it will be bullish for Bitcoin and risky assets; otherwise, it will increase the risk of a failed "soft landing" and suppress the sentiment of the crypto market.
3. Hash rate changes
Between June 14 and June 20, 2025, the Bitcoin network hash rate fluctuated as follows:
On June 14, the Bitcoin network's computing power (hash rate) fluctuated relatively mildly, climbing slowly from 929.15 EH/s to 969.11 EH/s in the morning, and then fell back to a minimum of 803.44 EH/s, indicating that some nodes were temporarily offline or the computing power withdrew. Near the end of the day, the computing power rose again to 936.76 EH/s, reflecting that the network as a whole remained highly active. On June 15, the hash rate fell slightly to 896.48 EH/s in the early stages, and then rebounded strongly to an intraday high of 993.82 EH/s. However, the rise failed to continue, and it quickly fell back to 838.80 EH/s at the end of the trading day, indicating that miners are more sensitive to the current price fluctuations, or some high-cost equipment has withdrawn. On June 16, the computing power continued to rise in the early stages, reaching a maximum of 985.81 EH/s, but then quickly fell back due to market sentiment, and finally closed at 891.79 EH/s, indicating that despite the addition of new computing power in the short term, the overall network stability still faces certain pressure.
On June 17, the overall hash rate of the Bitcoin network showed a significant downward trend that day, and continued to retreat from the 900 EH/s line, reaching a minimum of 710.35 EH/s, the lowest point of the week. On June 18, the hash rate rebounded from a low of 757.88 EH/s, gradually rising to 850 EH/s, and then continued to rise to 937.52 EH/s, showing signs of a recovery in network computing power; however, it fell slightly at the end of the day and closed at 867.97 EH/s. On June 19, the hash rate showed a fluctuating downward trend, falling back to 802.29 EH/s in the morning, and then briefly rebounded to 841.82 EH/s, and further fell back to 774.98 EH/s before the end of the day. On June 20, the hash rate showed signs of recovery. As of the time of writing, it has recovered to around 850 EH/s, showing a certain recovery momentum, and the computing power on the miner side is gradually returning to the network.
Overall, the Bitcoin hash rate showed a significant wide fluctuation this week, especially from the 16th to the 17th, with a minimum of 710.35 EH/s, reflecting that some computing power temporarily withdrew due to market or operational pressure. Although it recovered later, the overall network is still in the adjustment stage. At this stage, miners are more sensitive to price fluctuations and cost changes, computing power fluctuations may continue, and the mining ecosystem is accelerating towards high efficiency and low cost optimization.
![]()
Bitcoin network hash rate data
4. Mining income
According to YCharts data, the total daily income of Bitcoin miners this week (including block rewards and transaction fees) is as follows: June 14: $50.64 million; June 15: $45.8 million; June 16: $49.38 million; June 17: $39.63 million; June 18: $47.26 million. From the overall trend, the average daily total income of miners this week is roughly between $45 million and $50 million. Overall, the fluctuation of miners' income this week is basically consistent with the trend of network computing power, but due to the decline in transaction activity and the sharp reduction in fees, the room for income growth is suppressed to a certain extent.
In the past week, the unit computing power revenue (Hashprice) of the Bitcoin network has shown an overall trend of rising and then falling. On June 17, it once rose to $54.56/PH/s/day, the highest point of the week; as of June 20, Hashprice fell back to $52.73/PH/s/day, with limited changes from the beginning of the week. From a monthly perspective, the current level is still in the historically low range, while in a relatively medium-high position on a quarterly basis, indicating that unit revenue is under pressure against the background of continued expansion of computing power.
Although the Bitcoin network hash rate hit a record high of 946 EH/s (calculated by a seven-day simple moving average) on June 14, breaking the previous peak of 943 EH/s on May 31, showing that the network computing power is continuing to expand, the actual profits of miners are shrinking. In the past 30 days, the unit computing power income (Hashprice) has dropped from $55.53/PH/s/day on May 14 to the current $52.92/PH/s/day, reflecting that even though network security and computing power competition are increasing, miners have not been able to obtain higher returns at the same time.
At the same time, the proportion of handling fees in the miners' income structure has dropped significantly. According to Luxor's Hashrate Index data, the proportion of handling fee income to miners' total income in June has dropped below 1%, a new low since 2022. Currently, miners can get about 3.125 bitcoins (about 327,000 US dollars) for each block processed, but the average transaction fee is only 1.45 US dollars, resulting in the continued weakening of the ability of handling fees to supplement miners' total income. In the past 24 hours, transaction fees accounted for only 1.32% of miners' single-block income, reflecting the periodic weakness of network utilization.
In summary, despite the high price of Bitcoin and the record high computing power, the profit dilemma faced by miners has not been alleviated. CJ Burnett, chief revenue officer of Compass Mining, pointed out that since the halving in 2024, mining revenue has remained near historical lows. In the future cycle, high-efficiency mining equipment and low-price electricity resources will become the core elements for miners to maintain their competitiveness, and for miners who rely on high operating costs or lack resource advantages, the pressure to survive will continue to intensify.
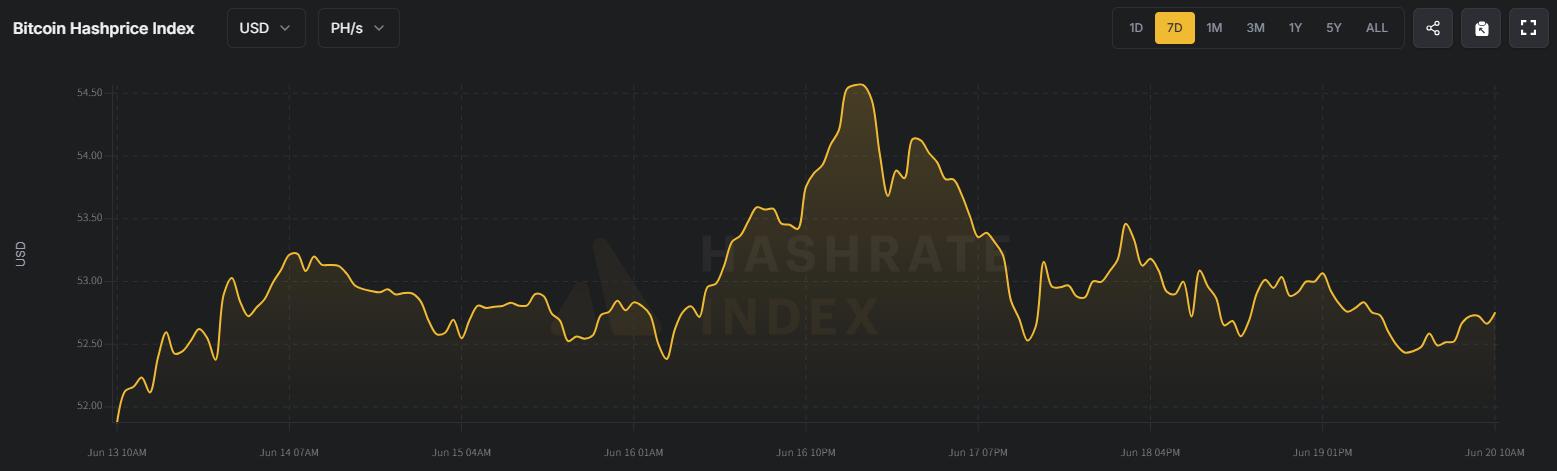
Hashprice data
5. Energy costs and mining efficiency
According to CloverPool data, the Bitcoin network has completed a new round of mining difficulty adjustment at 09:46:44 Beijing time on June 14, 2025 (block height 901, 152). The difficulty of this round has been reduced by 0.45% to 126.41 T. As of the time of writing on June 20, according to CloverPool real-time data, the Bitcoin network hashrate is 873.05 EH/s. The next difficulty adjustment is expected to be around June 28, with an estimated reduction of 0.35%, and the difficulty will drop to 125.96 T. This trend shows that although the overall hashrate of the network remains high, the output efficiency of miners is facing periodic downward pressure. In addition, some old mining machines have withdrawn from the network, and the overall hashrate growth has slowed down, pushing the difficulty down slightly twice in a row. This phenomenon also implies the continued withdrawal or transformation of miners under the background of high costs.
On the other hand, mining costs are rising significantly. According to the latest report released by TheMinerMag on June 17, the average cost of Bitcoin mining is expected to exceed $70,000 for the first time in the second quarter of 2025, an increase of about 9.4% from about $64,000 in the first quarter. This round of cost increases is mainly driven by two aspects: first, the network hash rate continues to hit new highs this quarter, increasing the competitive cost per unit of Bitcoin; second, the upward pressure on energy prices, especially in some major mining bases in the United States, such as Texas, where energy costs continue to rise. The report pointed out that the unit energy cost of listed mining companies such as Terawulf has risen by more than 100% compared with the same period last year.
In general, the current Bitcoin mining activities are in the stage of "high cost, high computing power, and low unit income". Although the network difficulty has been technically reduced, the profit margin of miners has been further compressed due to the rising cost of electricity resources and continued fierce competition. In the future cycle, the profitability of mining farms will be highly dependent on computing power efficiency, energy allocation and operating cost control. For small and medium-sized miners who lack low-price electricity resources or use old equipment, the pressure to exit will be significantly increased.
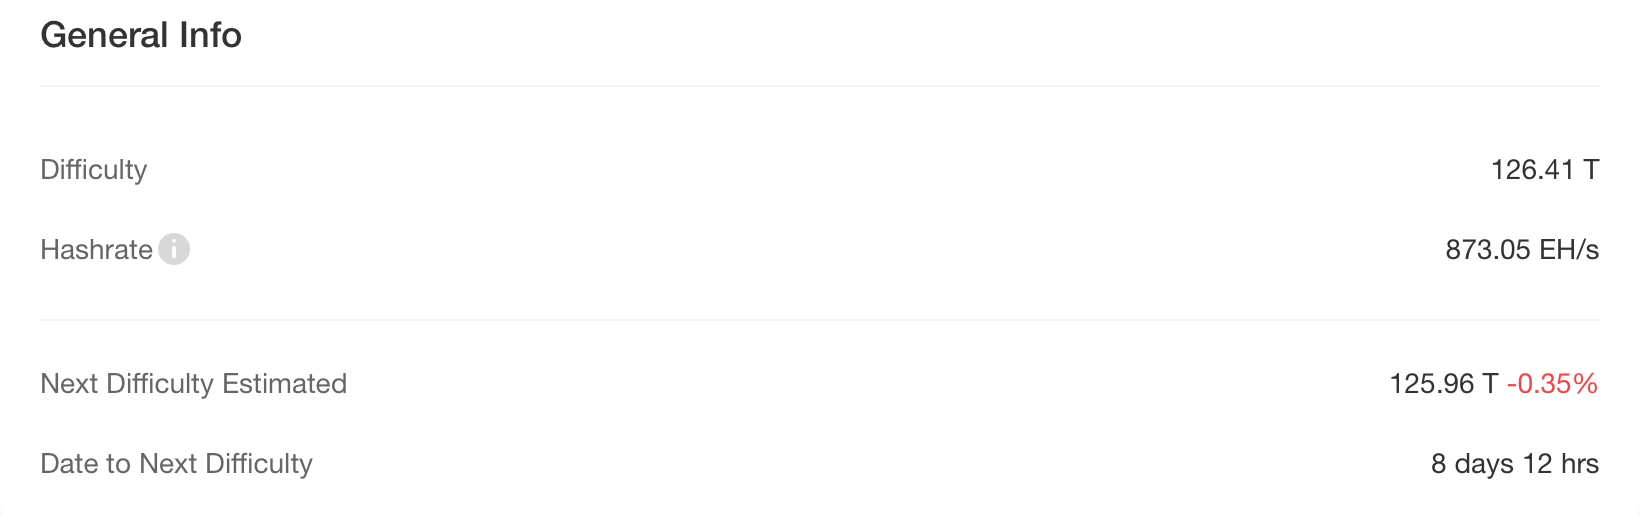
Bitcoin mining difficulty data
6. Bitcoin related news
Global corporate Bitcoin holdings dynamics (statistics for this week)
1. Metaplanet’s holdings exceed 10,000 BTC, with a market value of over 1 billion USD, surpassing Coinbase
On June 16, Metaplanet, a Japanese listed company, announced that it had increased its holdings by 1,112 bitcoins, bringing its total holdings to 10,000 bitcoins, surpassing Coinbase's 9,267 bitcoins and ranking ninth among listed companies worldwide. After this increase, Metaplanet's total bitcoin market value exceeded $1.075 billion.
2. Australia's Monochrome Bitcoin ETF holdings increased to 765
It was officially disclosed on June 17 that the Monochrome Spot Bitcoin ETF (IBTC) held 765 bitcoins as of June 16, with a market value of approximately A$126 million.
3. Genius Group’s BTC holdings increased to 100, with a target of acquiring 1,000
On June 17, Singapore-based artificial intelligence education company Genius Group announced that its Bitcoin holdings had increased to 100, with plans to gradually expand to 1,000 BTC.
4. The Blockchain Group increased its holdings by 182 Bitcoins
On June 18, The Blockchain Group increased its holdings of 182 BTC, worth about 17 million euros (about 19.6 million U.S. dollars), and its total holdings reached 1,653. The company said that the return on Bitcoin this year reached 1,173%, and it will continue to increase its holdings.
5. Spain’s Vanadi Coffee announced the purchase of 20 Bitcoins
On June 18, Spanish coffee chain Vanadi Coffee announced the purchase of 20 BTC, bringing its total holdings to 30.
6. Bitmine Immersion’s holdings increased to 154.167 Bitcoins
On June 18, the US software company Bitmine Immersion Technologies announced that it had increased its holdings of BTC, and now holds a total of 154,167 BTC. The company invested a total of approximately US$16.347 million, with an average purchase price of US$106,033 per coin. The funds for this purchase came from the issuance of common stock.
7. The Smarter Web Company increased its holdings by 104.28 Bitcoins
On June 19, London-listed technology company The Smarter Web Company announced that it had increased its holdings of 104.28 BTC, with an average purchase price of $104,451, and a total holding of 346.63 BTC.


