
Crypto Market Sentiment Research Report (2024.07.26-08.02): Bitcoin Falls as Fed Keeps Steering
Bitcoin falls as Fed remains on hold
Since inflation has fallen less quickly than expected, the Federal Reserve has kept its interest rate target range between 5.25% and 5.5% since the end of July last year, the highest level in 23 years. After the interest rate meeting, Bitcoin fell to as low as $62,300 and then rebounded.
As the third quarter draws to a close, most market participants expect the Federal Reserve to cut interest rates. If the fight against inflation continues to make good progress, a rate cut could be announced as early as this year's September meeting. This could be a positive factor for risk assets such as Bitcoin.
Historically, a lower interest rate environment is good for cryptocurrencies as investors tend to seek higher-yielding assets. Despite the uncertain economic outlook, the prospect of looser monetary policy has boosted positive sentiment toward Bitcoin. However, investors need to be mindful of the risk of price volatility in the short term.
There are about 47 days until the next Federal Reserve interest rate meeting (September 19, 2024)
https://hk.investing.com/economic-calendar/interest-rate-decision-168
Market technical and sentiment environment analysis
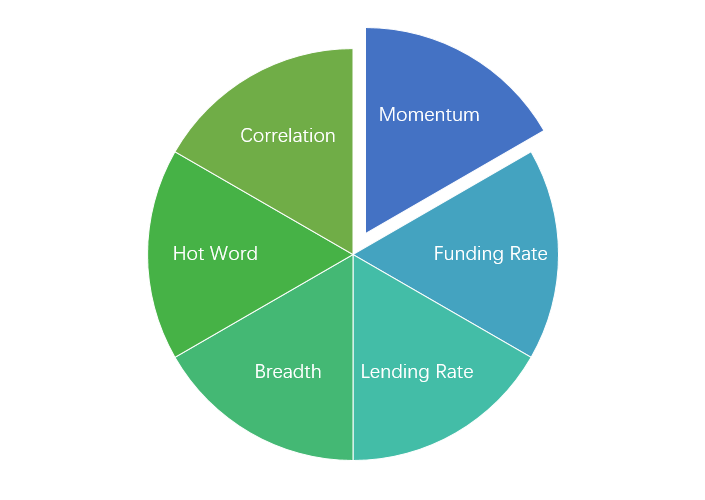
Sentiment Analysis Components
Technical indicators
Price trend
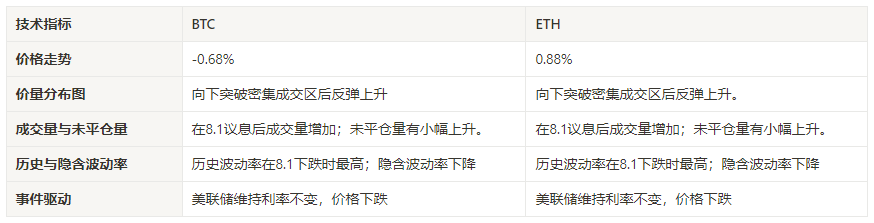
BTC price rose -0.68% and ETH price rose 0.88% over the past week.
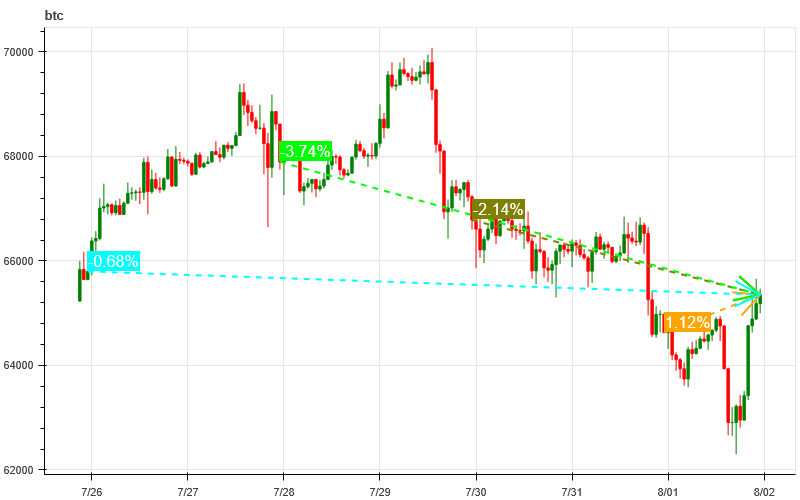
The above picture is the price chart of BTC in the past week.
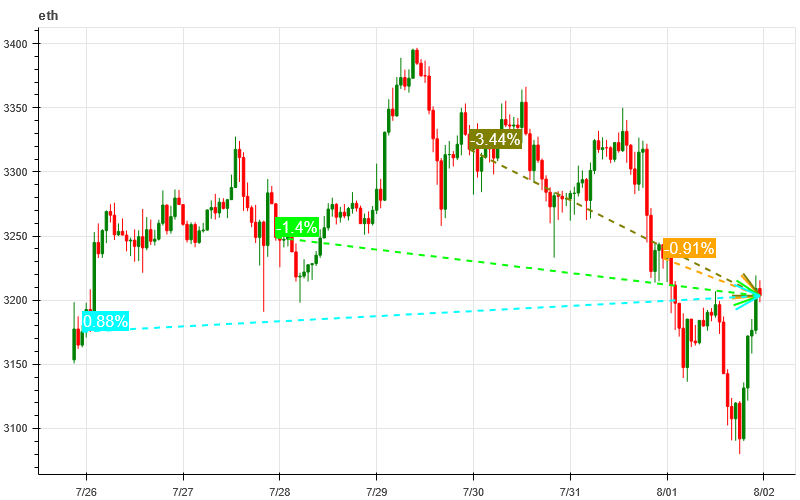
The above picture is the price chart of ETH in the past week.
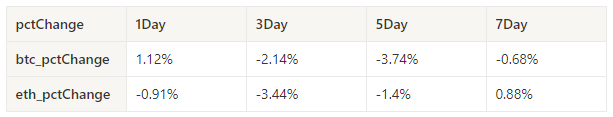
The table shows the price change rate over the past week.
pctChange1Day3Day5Day7Daybtc_pctChange1.12% -2.14% -3.74% -0.68% eth_pctChange-0.91% -3.44% -1.4% 0.88%
Price Volume Distribution Chart (Support and Resistance)
In the past week, BTC and ETH broke down from the concentrated trading area and then rebounded.
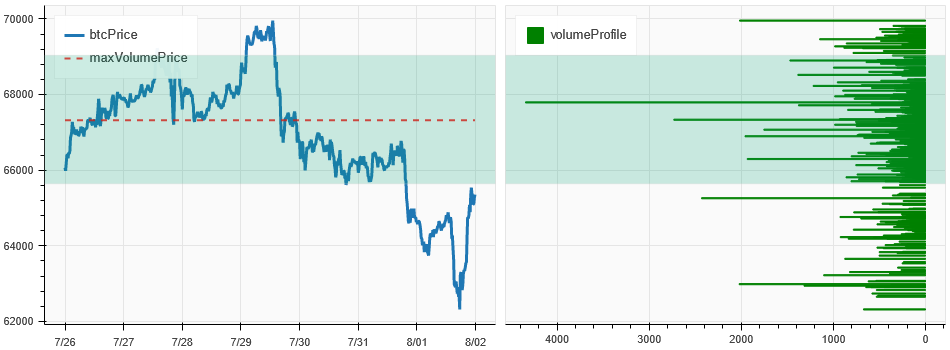
The above picture shows the distribution of BTC's dense trading areas in the past week.
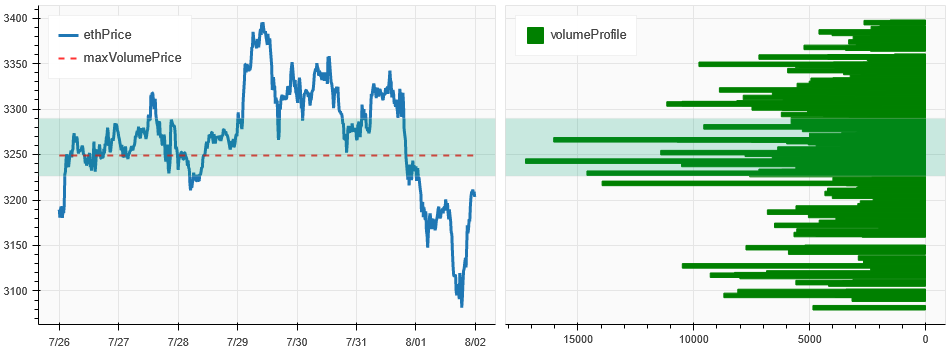
The above picture shows the distribution of ETH's dense trading areas in the past week.
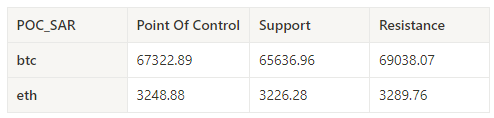
The table shows the weekly intensive trading range of BTC and ETH in the past week.
Volume and Open Interest
In the past week, the trading volumes of both BTC and ETH increased after the August 1 interest rate meeting; the open interest of both BTC and ETH increased slightly.
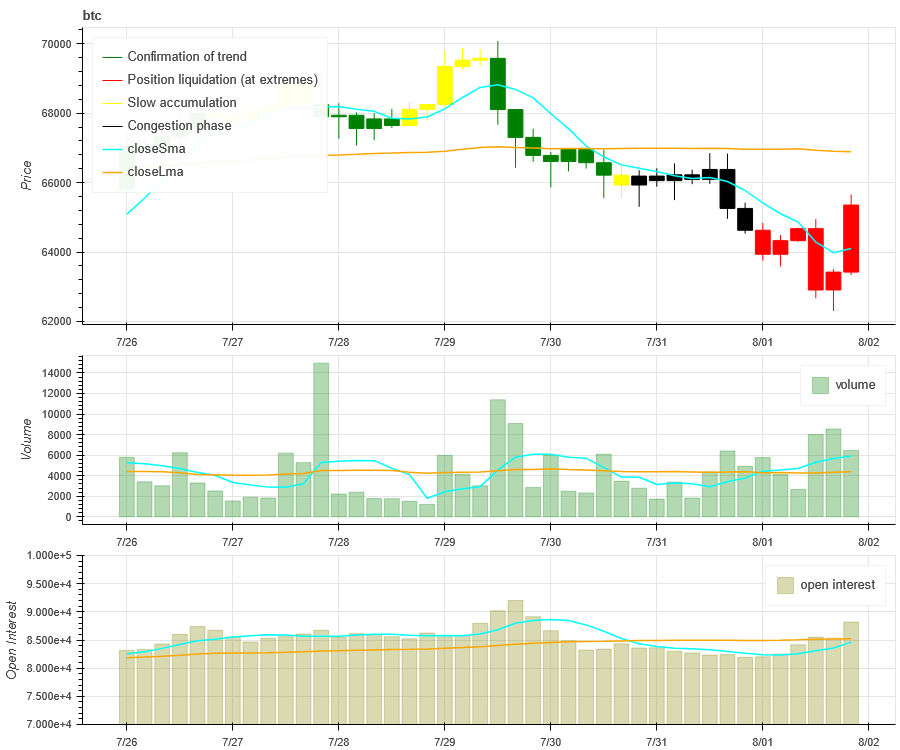
The top of the above picture shows the price trend of BTC, the middle shows the trading volume, the bottom shows the open interest, the light blue is the 1-day average, and the orange is the 7-day average. The color of the K-line represents the current state, green means the price rise is supported by the trading volume, red means closing positions, yellow means slowly accumulating positions, and black means crowded state.
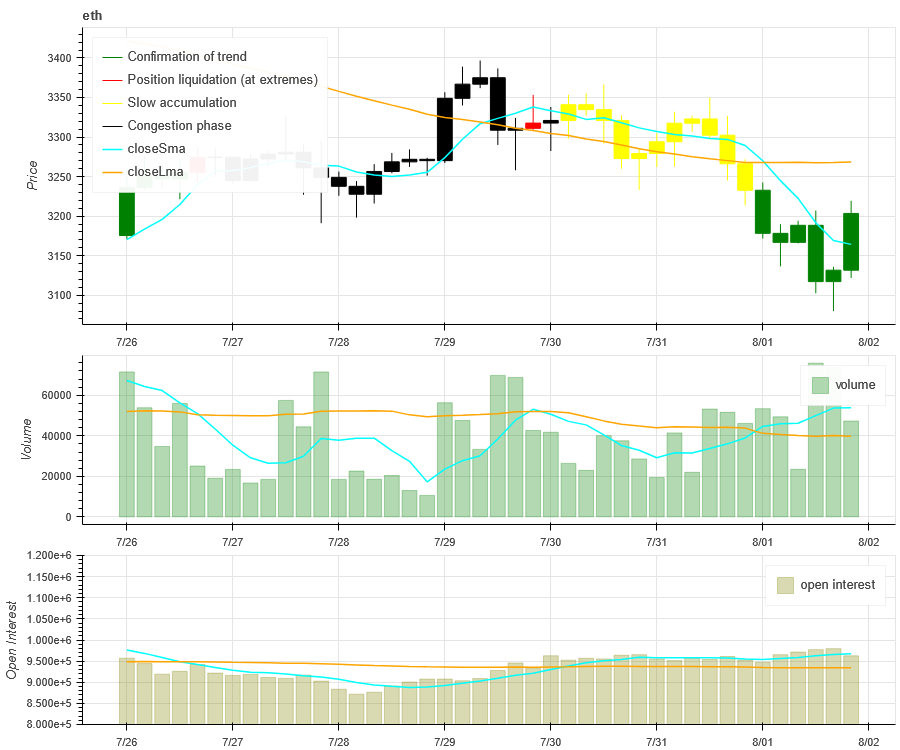
The top of the above picture shows the price trend of ETH, the middle is the trading volume, the bottom is the open interest, the light blue is the 1-day average, and the orange is the 7-day average. The color of the K-line represents the current state, green means the price rise is supported by the trading volume, red is closing positions, yellow is slowly accumulating positions, and black is crowded.
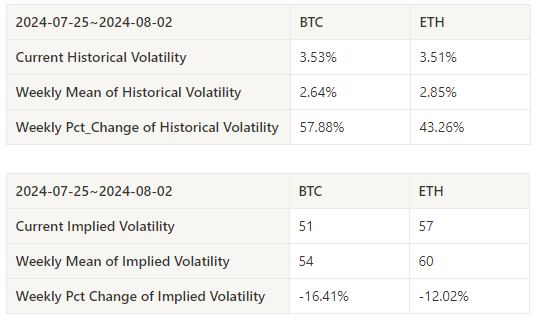
Historical Volatility vs. Implied Volatility
Historical volatility for BTC and ETH was highest this past week at 8.1; implied volatility for both BTC and ETH fell.
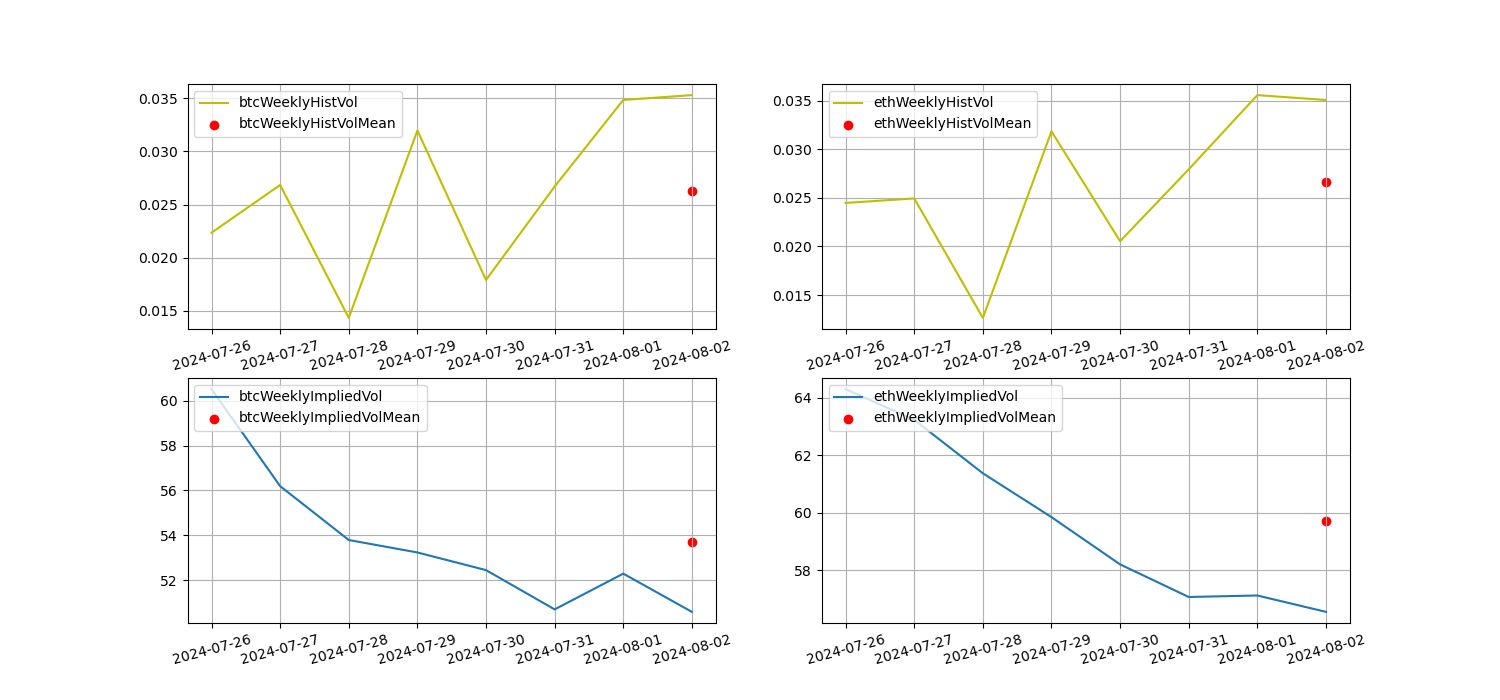
The yellow line is the historical volatility, the blue line is the implied volatility, and the red dot is its 7-day average.
Event-driven
The Federal Reserve kept interest rates unchanged this past week, and after the interest rate meeting, Bitcoin fell to a low of 62,300.
Emotional indicators
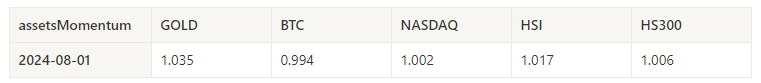
Momentum Sentiment
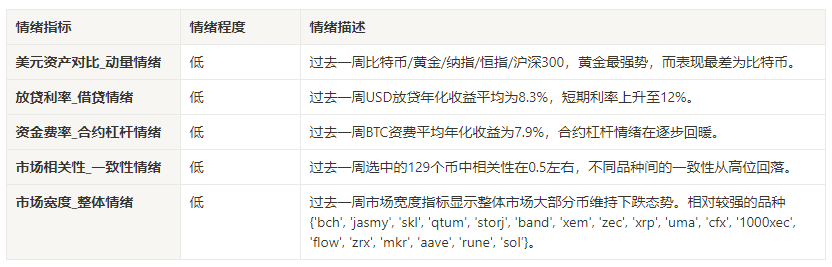
In the past week, among Bitcoin/Gold/Nasdaq/Hang Seng Index/SSE 300, gold was the strongest, while Bitcoin performed the worst.
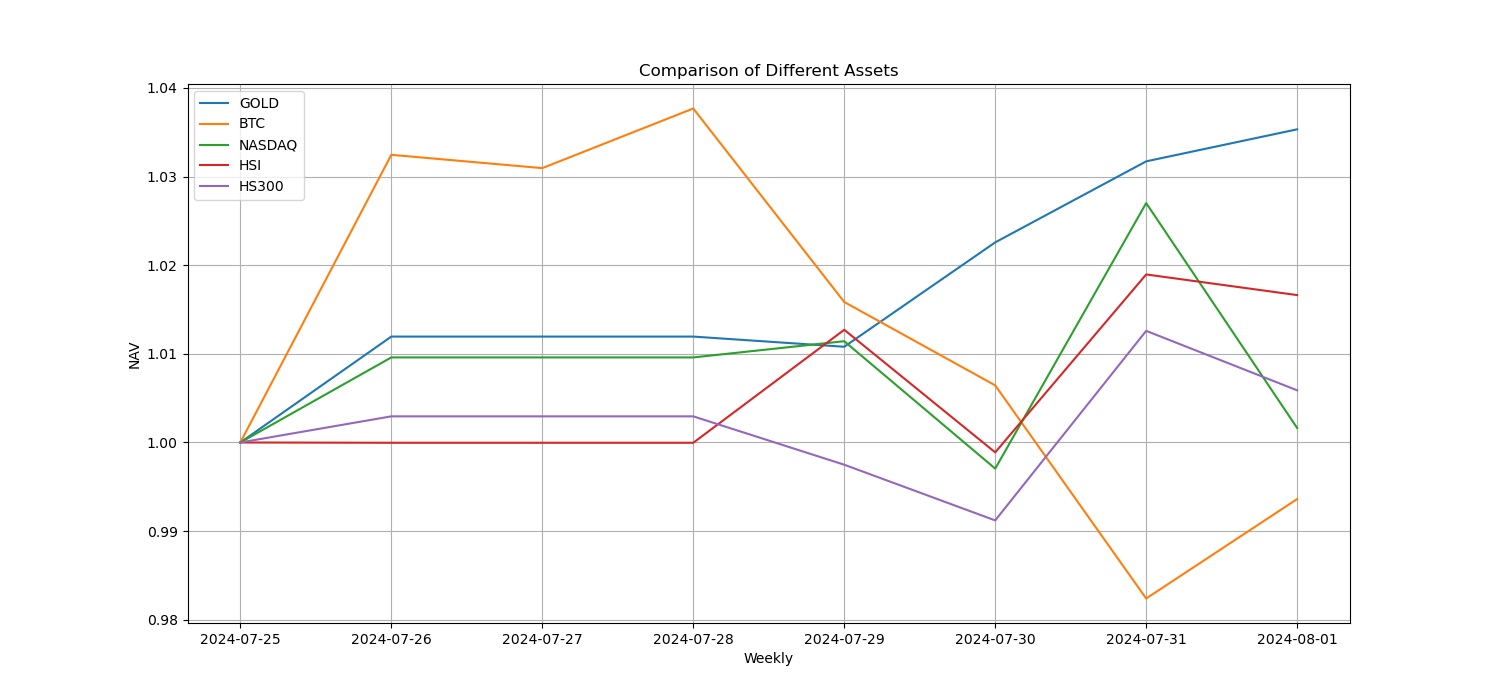
The above picture shows the trend of different assets in the past week.
Lending Rate_Lending Sentiment
The average annualized return on USD lending over the past week was 8.3%, and short-term interest rates rose to 12%.
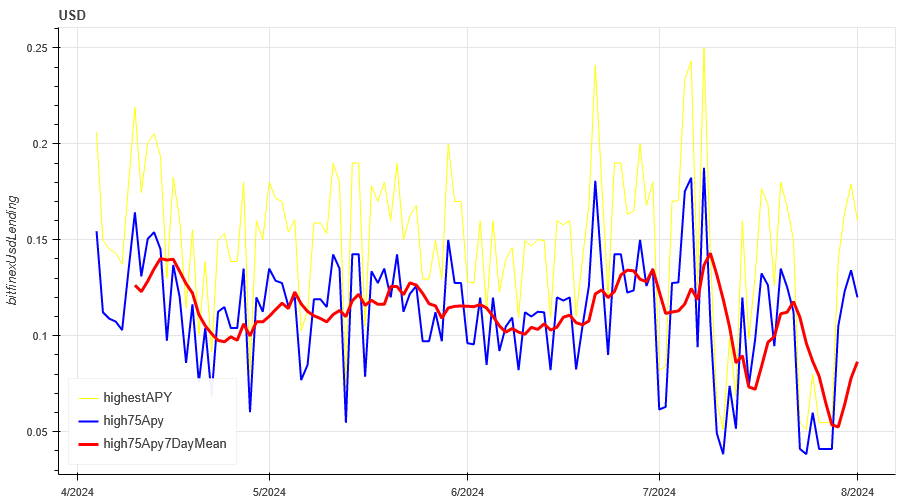
The yellow line is the highest price of USD interest rate, the blue line is 75% of the highest price, and the red line is the 7-day average of 75% of the highest price.
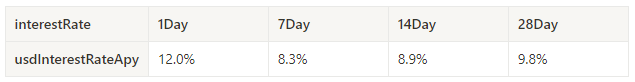
The table shows the average returns of USD interest rates at different holding days in the past
Funding Rate_Contract Leverage Sentiment
The average annualized return on BTC fees in the past week was 7.9%, and contract leverage sentiment is gradually recovering.
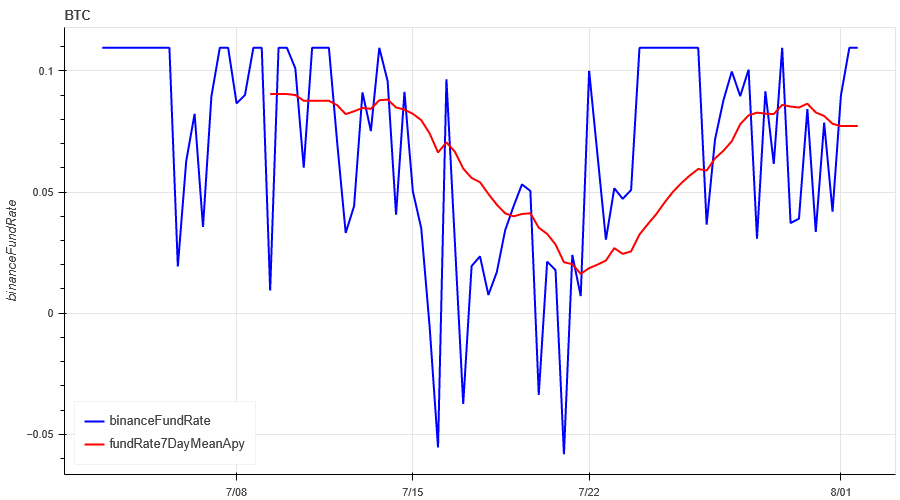
The blue line is the funding rate of BTC on Binance, and the red line is its 7-day average
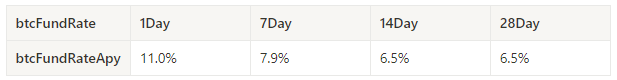
The table shows the average return of BTC fees for different holding days in the past.
Market Correlation_Consensus Sentiment
The correlation among the 129 coins selected in the past week was around 0.5, and the consistency between different varieties fell from a high level.
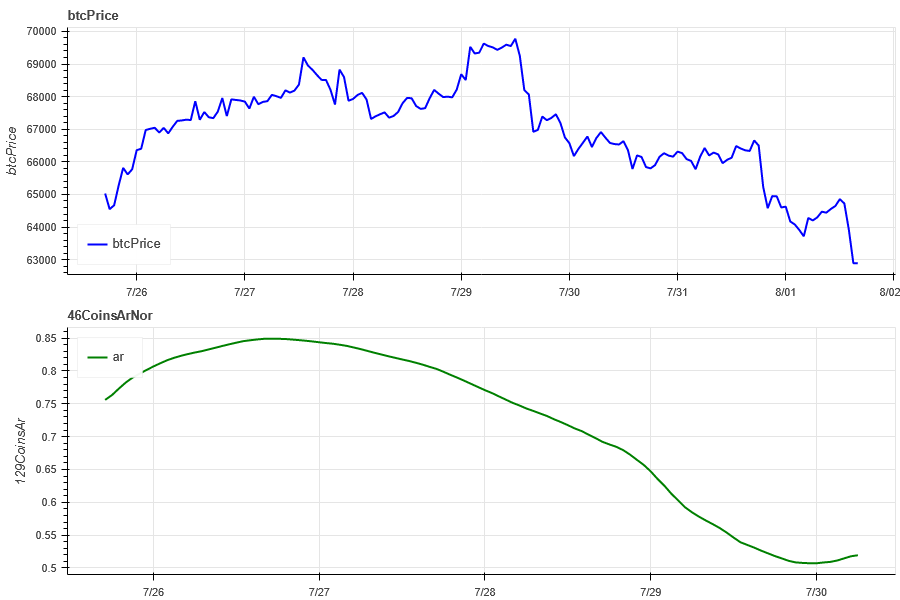
In the above picture, the blue line is the price of Bitcoin, and the green line is ['1000 floki', '1000 lunc', '1000 pepe', '1000 shib', '100 0x ec', '1inch', 'aave', 'ada', 'agix', 'algo', 'ankr', 'ant', 'ape', 'apt', 'arb', 'ar', 'astr', 'atom', 'audio', 'avax', 'axs', 'bal', 'band', 'bat', 'bch', 'bigtime', 'blur', 'bnb', 'btc', 'celo', 'cfx', 'chz', 'ckb', 'comp', 'crv', 'cvx', 'cyber', 'dash', 'doge', 'dot', 'dydx', 'egld', 'enj', 'ens', 'eos','etc', 'eth', 'fet', 'fil', 'flow', 'ftm', 'fxs', 'gala', 'gmt', 'gmx', 'grt', 'hbar', 'hot', 'icp', 'icx ', 'imx', 'inj', 'iost', 'iotx', 'jasmy', 'kava', 'klay', 'ksm', 'ldo', 'link', 'loom', 'lpt', 'lqty', 'lrc', 'ltc', 'luna 2', 'magic', 'mana', 'matic', 'meme', 'mina', 'mkr', 'near', 'neo', 'ocean', 'one', 'ont', 'op', 'pendle', 'qnt', 'qtum', 'rndr', 'rose', 'rune', 'rvn', 'sand', 'sei', 'sfp', 'skl', 'snx' , 'sol', 'ssv', 'stg', 'storj', 'stx', 'sui', 'sushi', 'sxp', 'theta', 'tia', 'trx', 't', 'uma', 'uni', 'vet', 'waves', 'wld', 'woo', 'xem', 'xlm', 'xmr', 'xrp', 'xtz', 'yfi', 'zec', 'zen', 'zil', 'zrx'] overall correlation
Market Breadth_Overall Sentiment
Among the 129 coins selected in the past week, 42.5% of the coins were priced above the 30-day moving average, 16.5% of the coins were priced above the 30-day moving average relative to BTC, 20% of the coins were more than 20% away from the lowest price in the past 30 days, and 35% of the coins were less than 10% away from the highest price in the past 30 days. The market breadth indicator in the past week showed that most coins in the overall market maintained a downward trend.
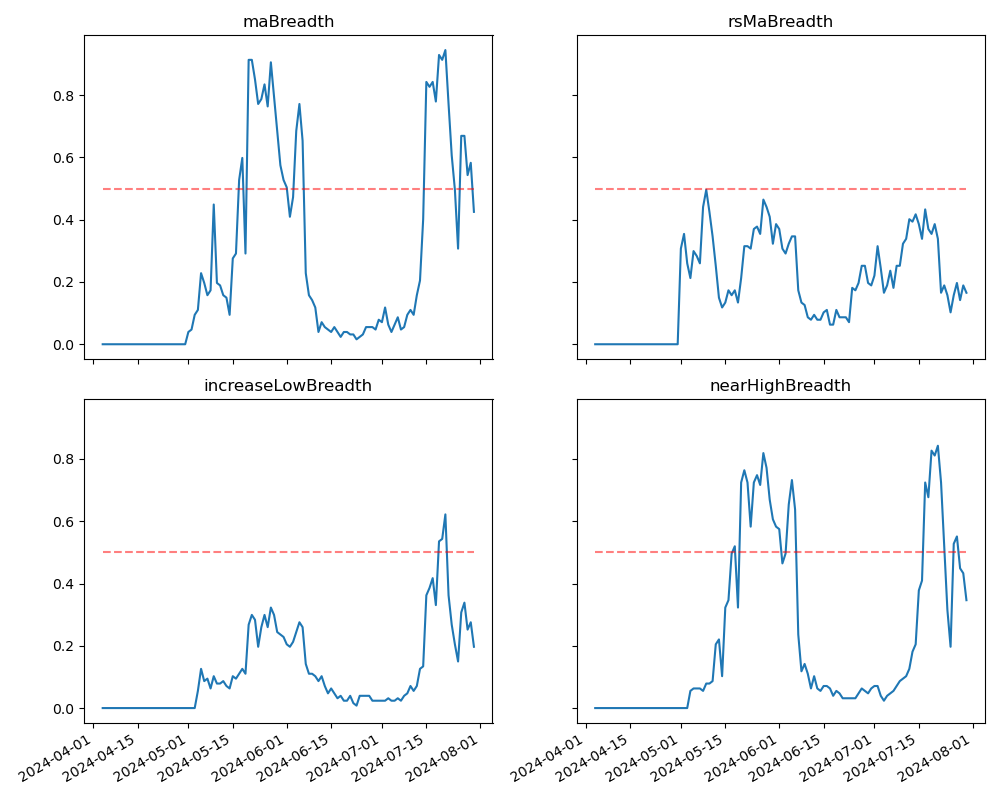
The picture above is ['bnb', 'btc', 'sol', 'eth', '1000 floki', '1000 lunc', '1000 pepe', '1000 sats', '1000 shib', '100 0x ec', '1inch', 'aave', 'ada', 'agix', 'ai', 'algo', 'alt', 'ankr', 'ape', 'apt', 'arb', 'ar', 'astr', 'atom', 'avax', 'axs', 'bal', 'band', 'bat', 'bch', 'bigtime', 'blur', 'cake', 'celo', 'cfx', 'chz', 'ckb', 'comp', 'crv', 'cvx', 'cyber', 'dash', 'doge', 'dot', 'dydx', 'egld', 'enj', 'ens', 'eos','etc', 'fet', 'fil', 'flow', 'ftm', 'fxs', 'gala', 'gmt', 'gmx', 'grt', 'hbar', 'hot ', 'icp', 'icx', 'idu', 'imx', 'inj', 'iost', 'iotx', 'jasmy', 'jto', 'jup', 'kava', 'klay', 'ksm', 'ldo', 'link', 'loom', 'lpt', 'lqty', 'lrc', 'ltc', 'luna 2', 'magic', 'mana', 'manta', 'mask', 'matic', 'meme', 'mina', 'mkr', 'near', 'neo', 'nfp', 'ocean', 'one', 'ont', 'op', 'ordi', 'pendle', 'pyth', 'qnt', ' qtum', 'rndr', 'robin', 'rose', 'rune', 'rvn', 'sand', 'sei', 'sfp', 'skl', 'snx', 'ssv', 'stg', 'storj', 'stx', 'sui', 'sushi', 'sxp', 'theta', 'tia', 'trx', 't', 'uma', 'uni', 'vet', 'waves', 'wif', 'wld', 'woo','xai', 'xem', 'xlm', 'xmr', 'xrp', 'xtz', 'yfi', 'zec', 'zen', 'zil', 'zrx' ] 30-day proportion of each width indicator

Summarize
In the past week, the prices of Bitcoin (BTC) and Ethereum (ETH) fell after the interest rate meeting, while the volatility and trading volume of these two cryptocurrencies increased after the interest rate meeting on August 1. The open interest of Bitcoin and Ethereum has increased slightly. In addition, the implied volatility of Bitcoin and Ethereum has decreased simultaneously. Bitcoin's funding rate has rebounded slightly from a low level, which may reflect the gradual recovery of market participants' leverage sentiment towards Bitcoin. Market breadth indicators show that most cryptocurrencies have retreated, indicating that the overall market has continued to fall in the past week.
Twitter: @ https://x.com/CTA_ChannelCmt
Website: channelcmt.com


