11 charts to interpret the crypto market in March: multiple online indicators hit record highs
Original author:Lars, Head of Research at The Block
Original compilation: Jordan, PANews
The cryptocurrency market continued to maintain its growth momentum in March, with most crypto industry indicators hitting record highs. This article will use 12 charts to interpret the crypto market conditions over the past month.
1. In March, the total on-chain transaction volume of Bitcoin and Ethereum increased by 59.3% after adjustment, reaching 587 billion US dollars. Among them, the adjusted on-chain transaction volume of Bitcoin increased by 59.5%, and the increase of Ethereum on-chain transaction volume was Reached 59.1%.
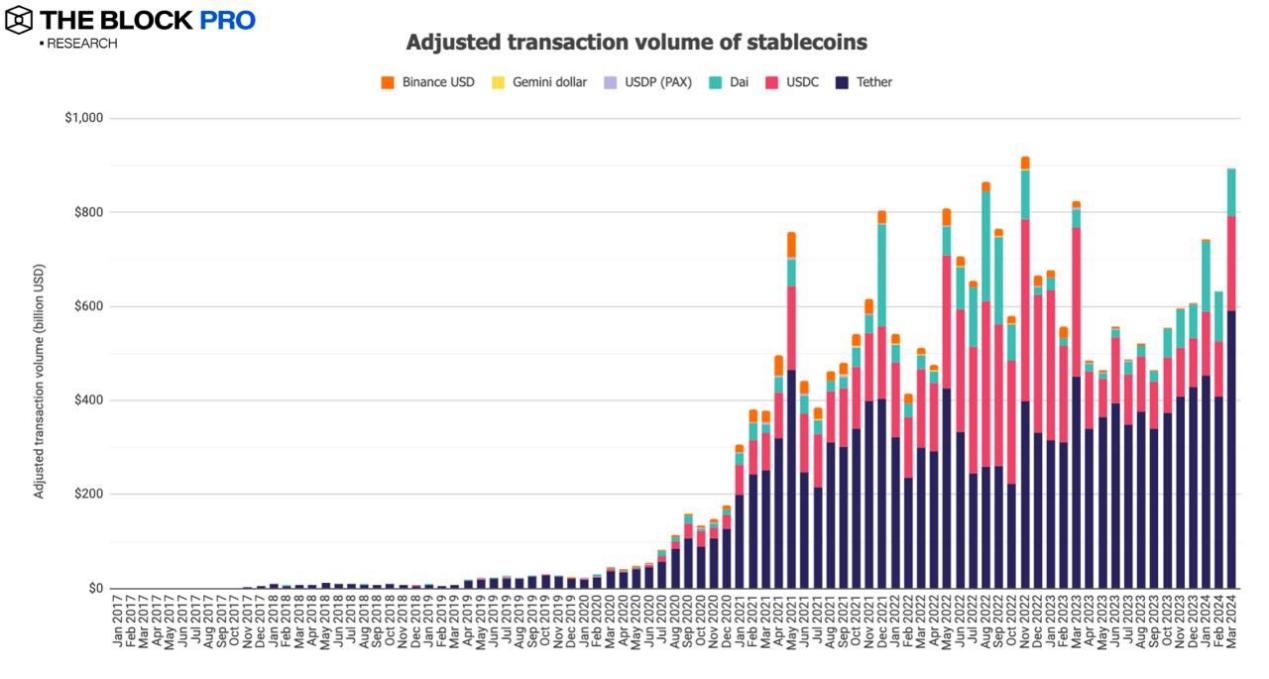
2. The adjusted transaction volume on the stablecoin chain increased significantly in March, rising to US$893.8 billion, an increase of 41.3%; the supply of issued stablecoins increased, an increase of 6.2% to US$137.4 billion, of which The U.S. dollar stablecoin USDT has a market share of 76.3%, while USDC’s market share has increased slightly to 19.7%.
3. Bitcoin miner revenue grew to $2.01 billion in March, hitting a record high with an increase of 44.9%. In addition, Ethereum staking revenue increased significantly, reaching approximately 44.5%, rising to US$309.3 million.
4. In March, a total of 147,620 ETH were destroyed on the Ethereum network, with a value equivalent to US$54.3 billion. Data shows that since the implementation of EIP-1559 in early August 2021, Ethereum has destroyed a total of approximately 4.23 million ETH, worth approximately $11.84 billion.
5. The transaction volume of the NFT market on the Ethereum chain fell by 3.6% in March, reaching approximately US$726 million.
6. The spot trading volume of compliance centralized exchanges (CEX) continued to show an upward trend in March, with an astonishing increase of 115.8%, rising to US$1.44 trillion.
7. The spot market share rankings of major cryptocurrency exchanges in March are as follows: Binance was 78.5% (increased from both January and February), Coinbase was 10.9%, Kraken was 3.4%, and LMAX Digital was 1.3% .
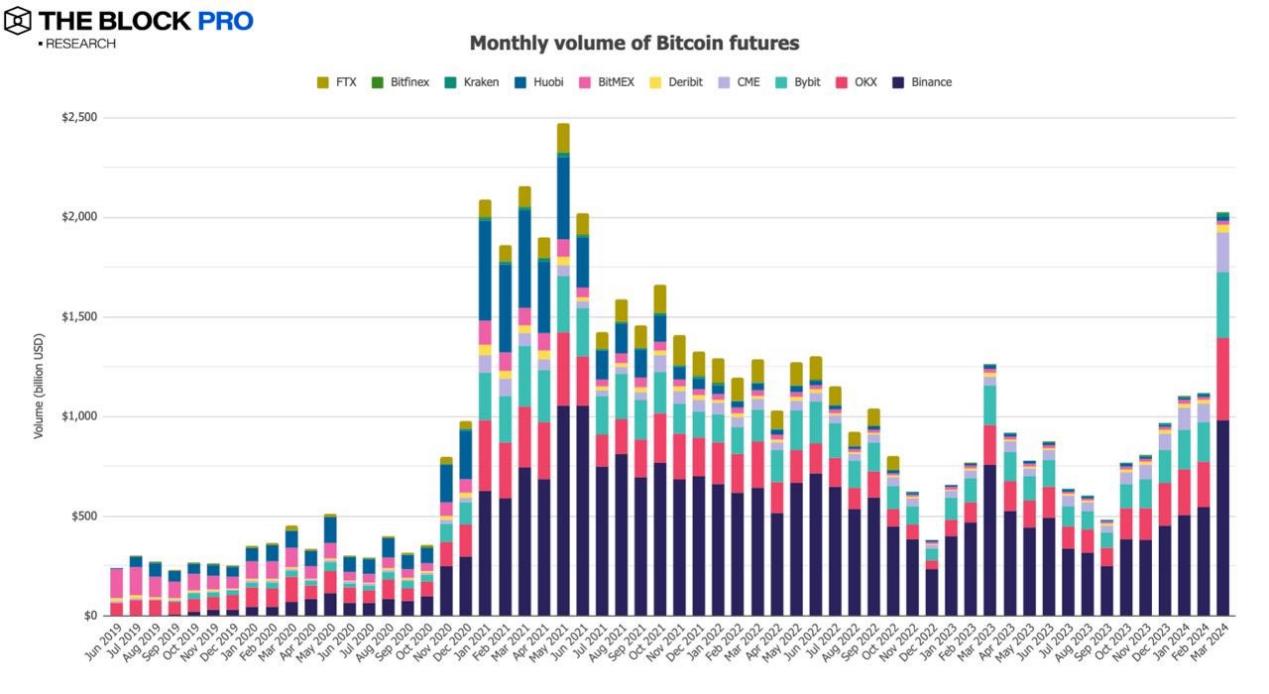
8. In terms of crypto futures, the open interest volume of Bitcoin futures increased by 33.2% in March, and the open interest volume of Ethereum futures increased by 18.6%; in terms of futures trading volume, the trading volume of Bitcoin futures in March increased by 80.8%. rose to $2.02 trillion.
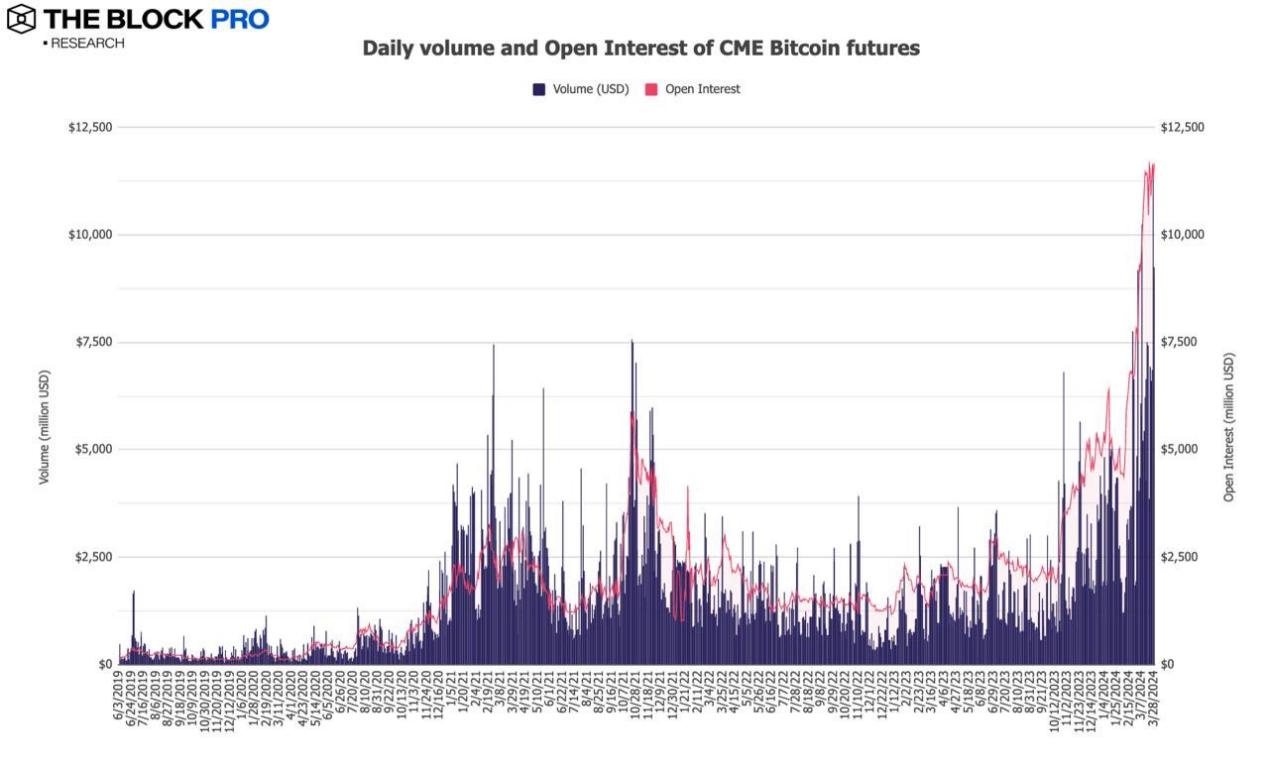
9. In March, CME Group’s open interest in Bitcoin futures increased by 49.5% to US$11.7 billion, hitting a record high. The daily average transaction volume (daily avg volume) increased by 114.8% to approximately US$6.8 billion. , also a record high.
10. In March, the average monthly trading volume of Ethereum futures rose to US$893.8 billion, an increase of 60.9%.
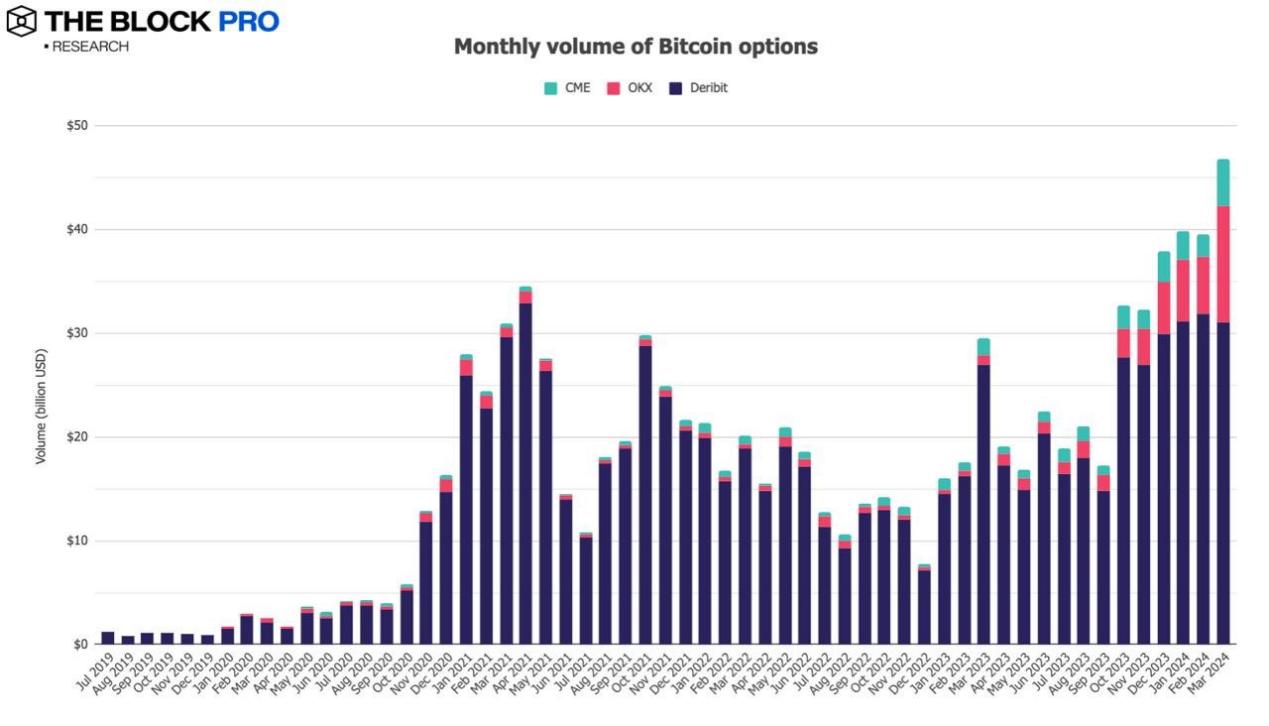
11. In terms of cryptocurrency options, open interest in Bitcoin options fell by 1.9% in March, and Ethereum open interest also fell by 6.6%. In addition, in terms of Bitcoin and Ethereum options trading volume, both hit historical highs on March 29. Bitcoin options trading volume reached a new high of US$46.75 billion, an increase of 18.5%; Ethereum options trading volume reached 20.99 billion. The dollar hit a new high, up 23.6%.