
Crypto Market Sentiment Research Report (2024.03.22-03.29): Exploring the Merger of Three Major AI Projects from the Perspective of ASI (Artificial Superintelligence)
Explore the merger of three major AI projects from ASI (Artificial Superintelligence)
What is ASI?

Artificial intelligence can be divided into three main levels: Artificial Narrow Intelligence (ANI), Artificial General Intelligence (AGI) and Artificial Superintelligence (ASI).
Weak artificial intelligence (ANI): Weak artificial intelligence refers to artificial intelligence systems designed to solve specific problems or perform specific tasks. They perform well in specific areas but lack cross-domain intelligence and learning capabilities. Many current artificial intelligence applications, such as voice assistants, image recognition and recommendation systems, are weak artificial intelligence.
General artificial intelligence (AGI): General artificial intelligence refers to an artificial intelligence system with intelligence levels and capabilities similar to humans. They can understand and learn a variety of tasks, possessing human-like reasoning, problem-solving and learning abilities. The goal of general artificial intelligence is to achieve the ability of machines to think and create autonomously and to perform tasks in a variety of different fields.
Super artificial intelligence (ASI): Super artificial intelligence refers to an artificial intelligence system whose intelligence level exceeds human intelligence. Super artificial intelligence has cognitive abilities and wisdom that far exceed human intelligence, and can demonstrate excellent performance in various tasks and fields. This kind of superintelligence may have creative thinking, comprehensive domain knowledge and ultra-fast computing power, and can surpass human intelligence in many aspects.
It is worth noting that super artificial intelligence (ASI) currently still belongs to the field of theory and research, and has not yet been actually realized. There are various opinions and predictions about the development and possibility of superintelligence, but it remains an open question awaiting future scientific and technological developments.
Five major ASI development trends
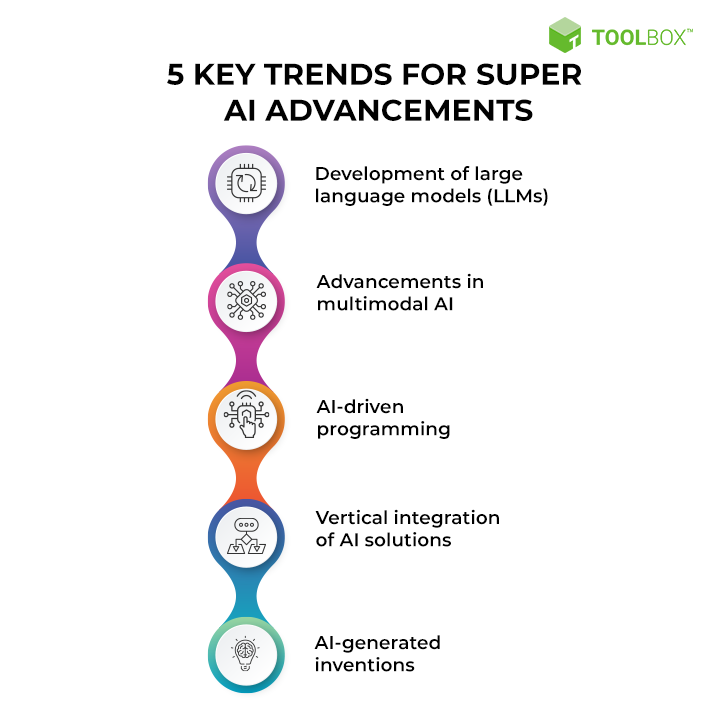
Image Source:https://www.spiceworks.com/tech/artificial-intelligence/articles/super-artificial-intelligence/
The development of large language models (LLMs): Language models utilize natural language processing (NLP) techniques and algorithms to predict the occurrence of a sequence of words in a sentence. These models are expert systems that can summarize text data and create visualizations. LLM models are trained on large-scale data sets. Some of the famous LLM examples include OpenAI’s GPT-2 and GPT-3 and Google’s BERT.
Advances in Multimodal AI: Multimodal AI combines visual and speech modalities to create scenes that match human perception. OpenAI’s DALL-E is a recent example of multimodal AI that can generate images from text. Another example is NVIDIA’s GauGAN 2 model, which can generate photorealistic photos based on text input. It uses text-to-image generation technology to create the most beautiful and realistic artwork.
AI-driven programming: AI-driven programming has made significant progress in recent years. Several tools such as Amazons CodeGuru can provide recommendations to improve code quality and identify expensive code in your application.
Vertical integration of AI solutions: Top AI vendors such as Amazon, Google, and Microsoft have now commercialized their AI-based products. The fusion of all these technologies, combined with cutting-edge research in LLM, conversational AI, and multimodal AI, will make the development of super artificial intelligence possible.
AI-generated inventions: AI is already driving innovation in almost every field, from creating music, art, and literature to developing scientific theories.
The above are five major development trends, coupled with NVIDIAs high-performance computing support, making it possible to build an open platform for artificial intelligence applications and services.
The powerful combination of Agents (FET) + Data (Ocean) + AGI (AGIX) is named ASI
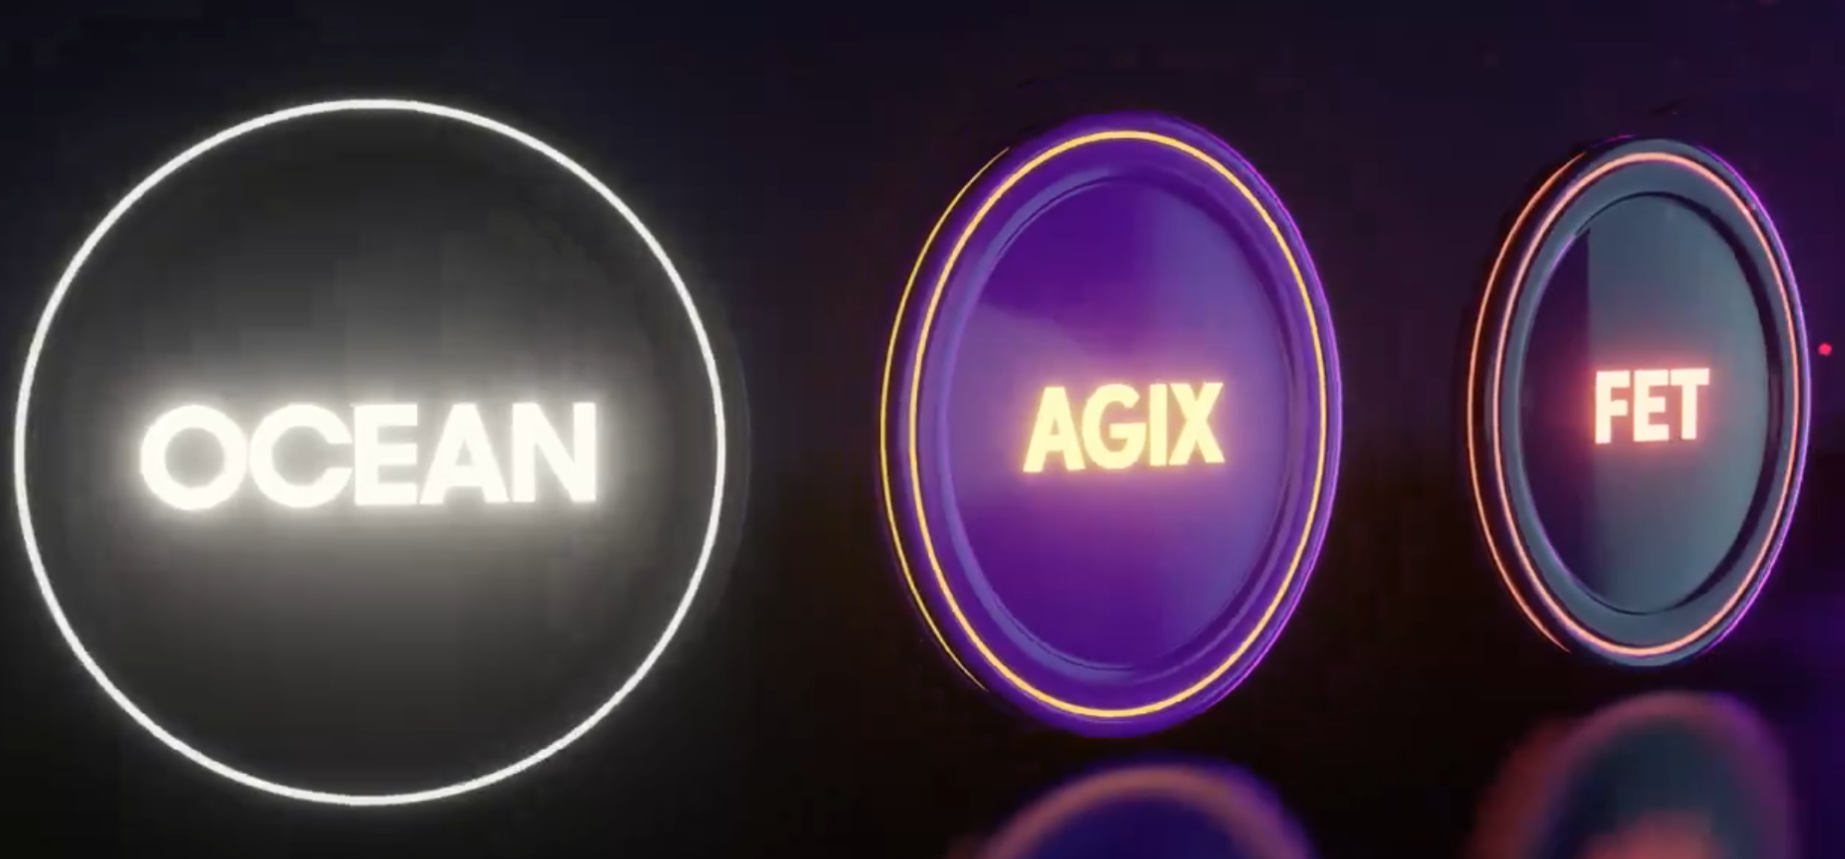
Fetch.aiIt is a company that has accumulated relatively mature experience in AI agents. Deutsche Telekom announced on February 20 that it is partnering with the Fetch.ai Foundation to become Fetch.ai’s first corporate ally, and that Deutsche Telekom’s subsidiary MMS will become a validator of Fetch.ai. Additionally, Fetch.ai announced a launch called"Fetch Compute"’s infrastructure investment project, with an investment scale of US$100 million, plans to deploy Nvidia H 200, H 100 and A 100 GPUs to provide developers and users with a computing power platform.
Ocean Protocol has built multiple module services in decentralized data sharing, access control and payment. According to reports, its product Predictoor has achieved sales of more than $800 million within six months of its launch.
SingularityNET is one of the three projects that explores the most in the field of AGI (artificial general intelligence). SingularityNETs AGI team, together with partners TrueAGI and the OpenCog community, has been working on the AGI framework OpenCog Hyperon since 2020. SingularityNET also plans to launch a decentralized artificial intelligence platform this year, aiming to create a basic environment suitable for running AGI systems.
The prices of FET, Ocean, and AGIX experienced a pullback after a short-term rise following this week’s news about the merger of the three projects. The future development trends in the field of decentralized artificial intelligence deserve continued attention.
Bitcoin halving is about 22 days away from today (2024.03.29)
Countdown to halving:https://www.nicehash.com/countdown/btc-halving-2024-05-10-12-00?_360safeparam=1289146171
Market technical and emotional environment analysis
Sentiment analysis components
Technical indicators
Price trend
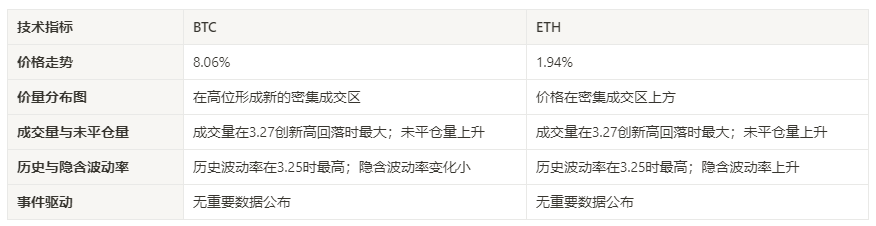
BTC price increased by 8.06% and ETH price increased by 1.94% in the past week.
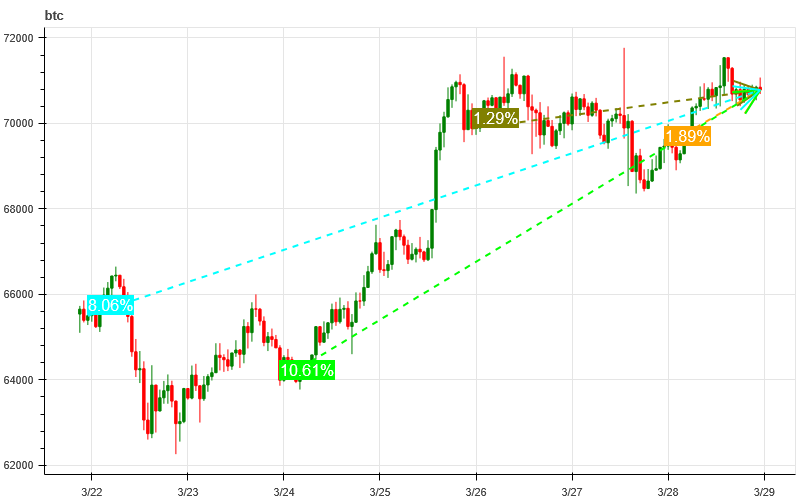
The picture above is the price chart of BTC over the past week
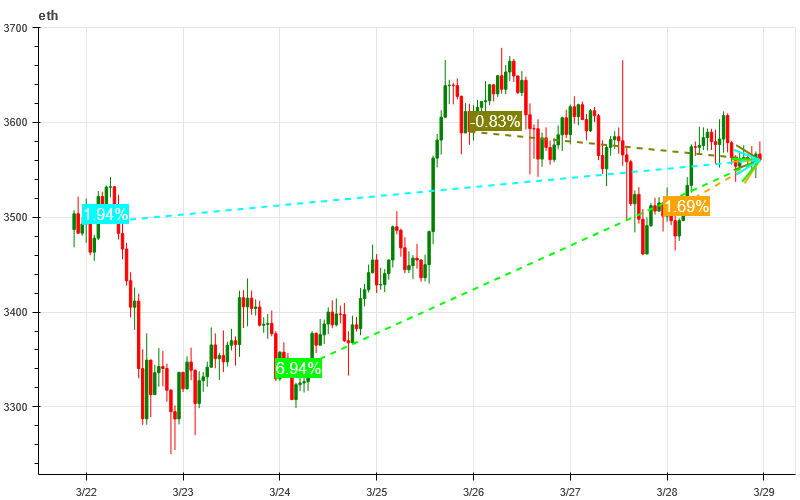
The picture above is the price chart of ETH over the past week
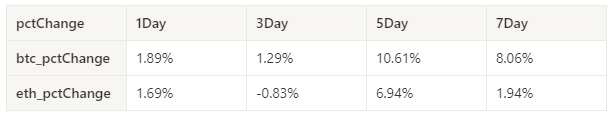
Table showing the rate of price change over the past week
Price and volume distribution chart (support and resistance)
BTC has formed a new dense trading zone at its highs over the past week while ETH price is trading above a dense trading zone.
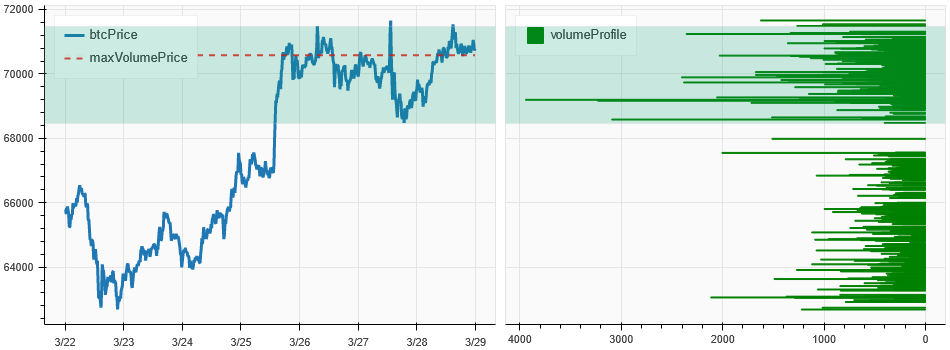
The picture above is the distribution map of BTC’s intensive trading areas in the past week.
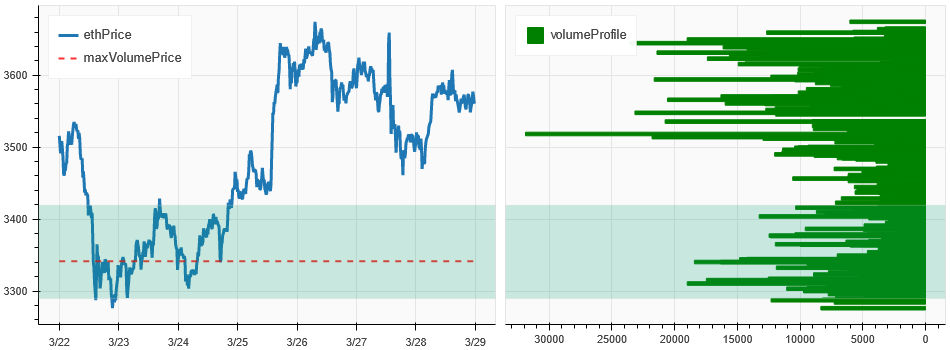
The picture above is the distribution map of ETH’s intensive trading areas in the past week.
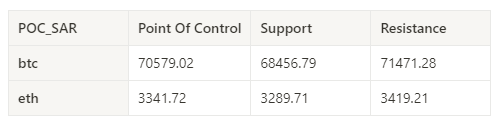
Table showing the intensive weekly trading ranges for BTC and ETH over the past week
Volume and Open Interest
The trading volume of BTC and ETH in the past week was the largest when it fell back from the new high of 3.27; the open interest of both BTC and ETH increased.
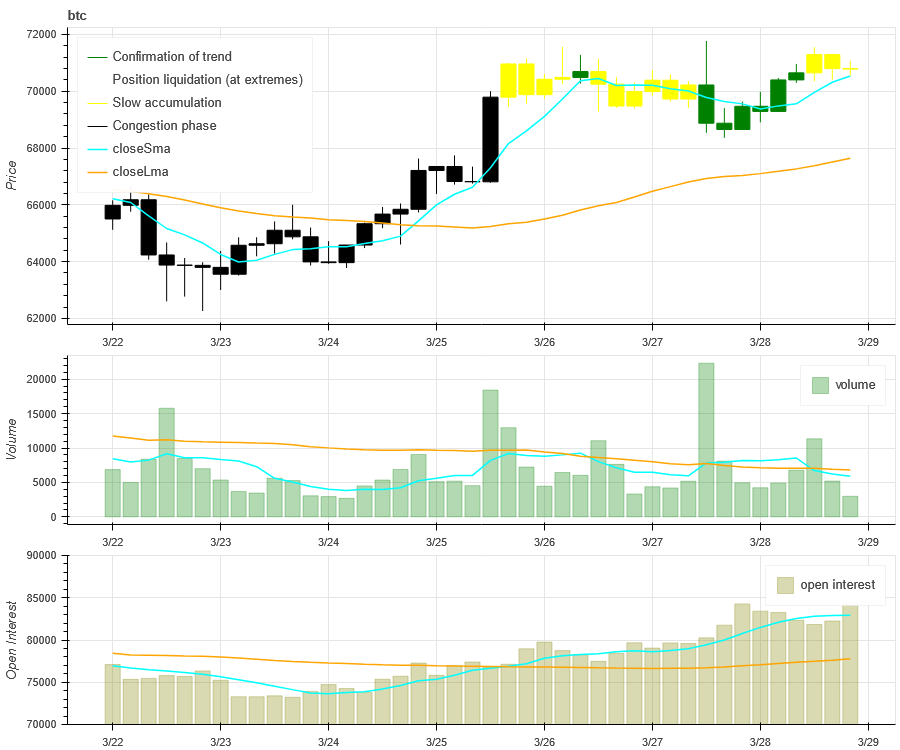
The price trend of BTC at the top of the picture above, the middle is the trading volume, the bottom is the open interest, the light blue is the 1-day average, and the orange is the 7-day average. The color of the K line represents the current status. Green means that the price rise is supported by trading volume, red means positions are being closed, yellow means positions are slowly accumulating, and black means congestion.
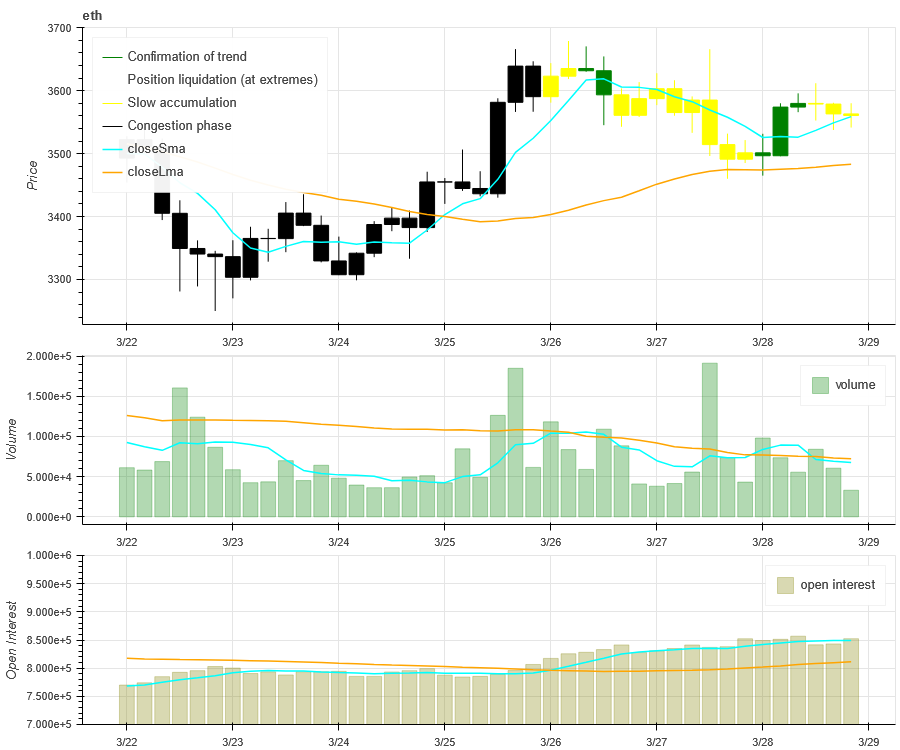
The price trend of ETH at the top of the picture above, the middle is the trading volume, the bottom is the open interest, the light blue is the 1-day average, and the orange is the 7-day average. The color of the K line represents the current status. Green means that the price rise is supported by trading volume, red means positions are being closed, yellow means positions are slowly accumulating, and black means congestion.
Historical Volatility vs. Implied Volatility
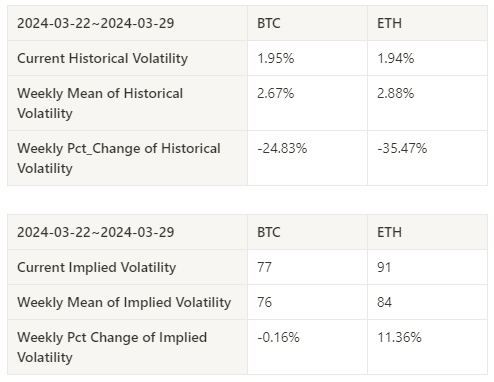
The historical volatility of BTC and ETH in the past week was the highest at 3.25; the implied volatility of BTC changed little while ETH increased from the beginning of the week.
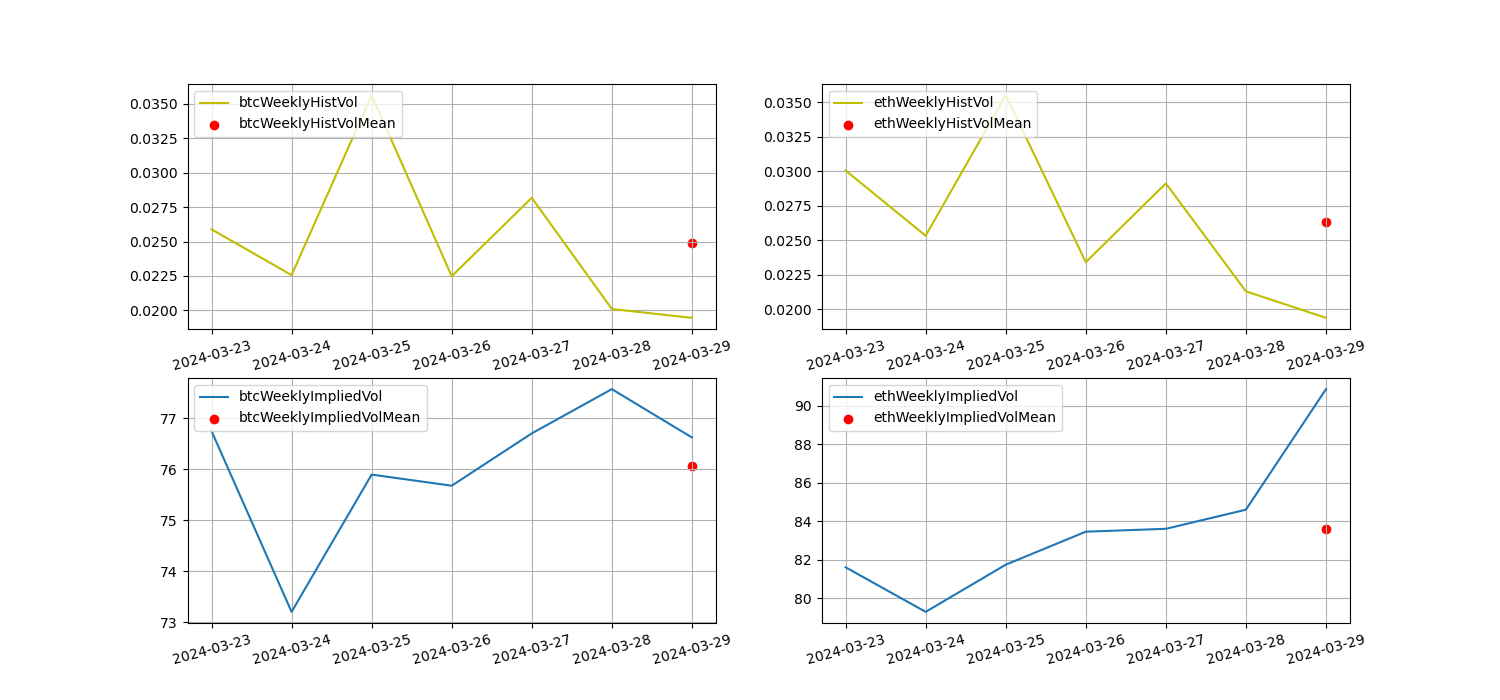
The yellow line is historical volatility, the blue line is implied volatility, and the red dot is its 7-day average
event driven
There are no major data releases this week.
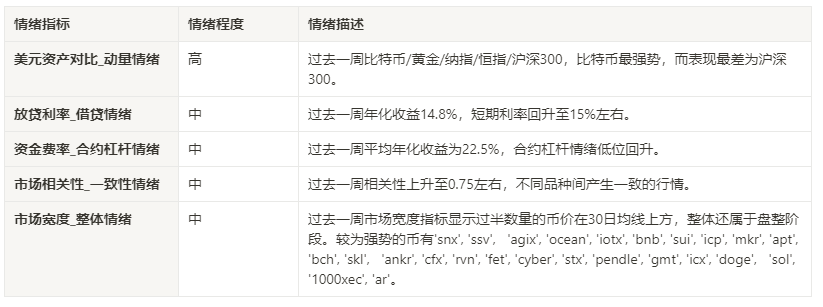
sentiment indicator
momentum sentiment
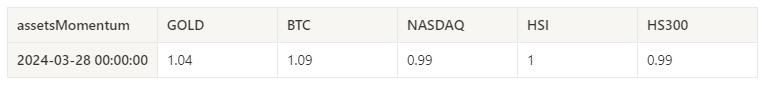
Among Bitcoin/Gold/Nasdaq/Hang Seng Index/CSI 300, Bitcoin was the strongest in the past week, while the worst performer was CSI 300.
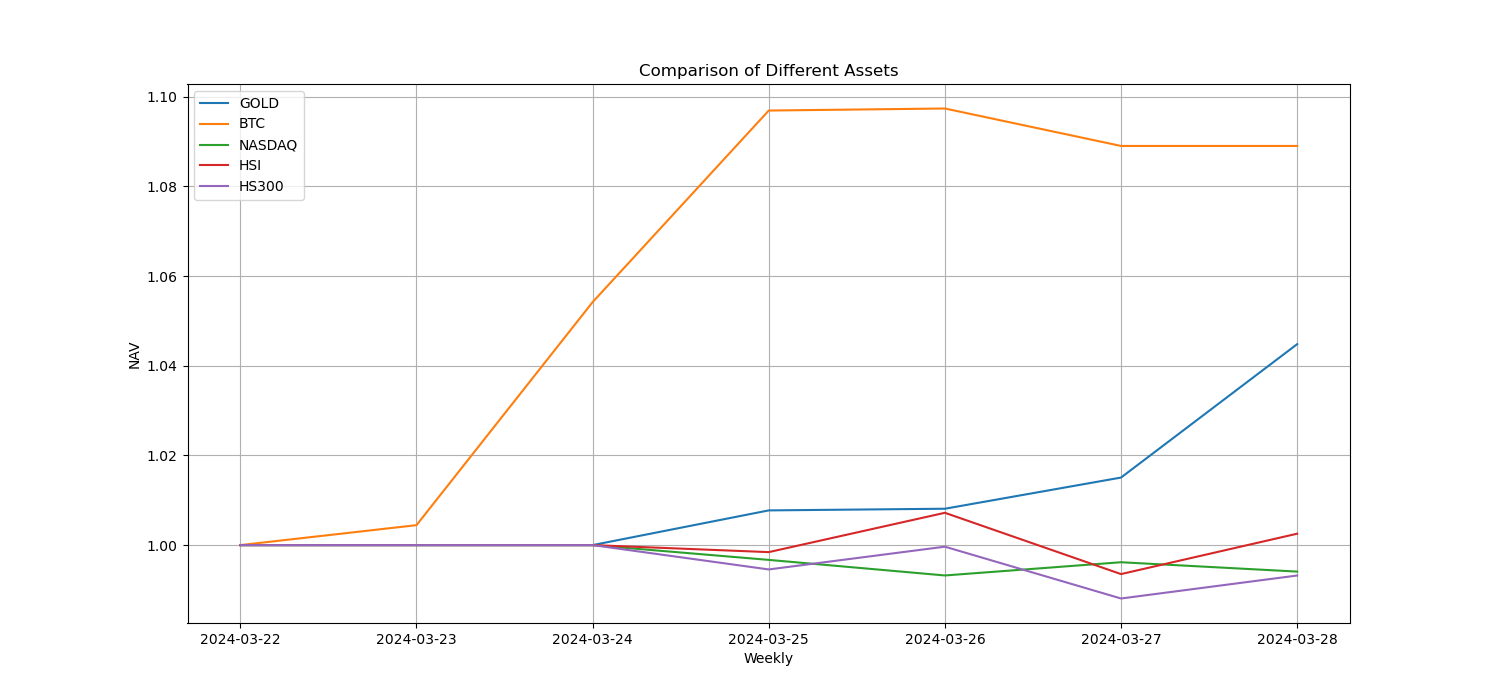
The picture above shows the trends of different assets over the past week.
Lending interest rate_Lending sentiment
The annualized return on USD lending averaged 14.8% in the past week, and short-term interest rates rose to around 15%.
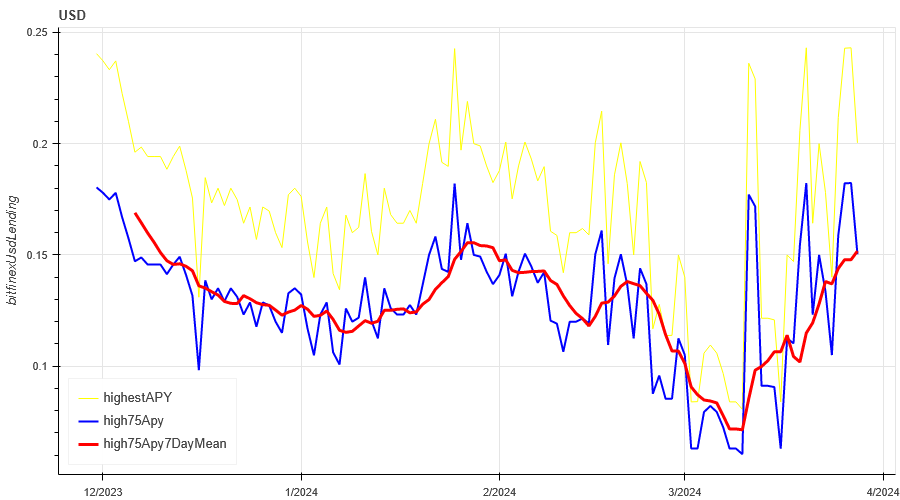
The yellow line is the highest price of the USD interest rate, the blue line is 75% of the highest price, and the red line is the 7-day average of 75% of the highest price
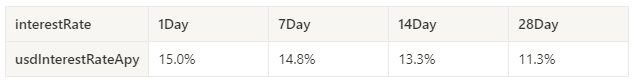
The table shows the average return of USD interest rate for different holding days in the past
Funding Rate_Contract Leverage Sentiment
The average annualized return on BTC tariffs in the past week was 22.5%, and contract leverage sentiment has rebounded from lows.
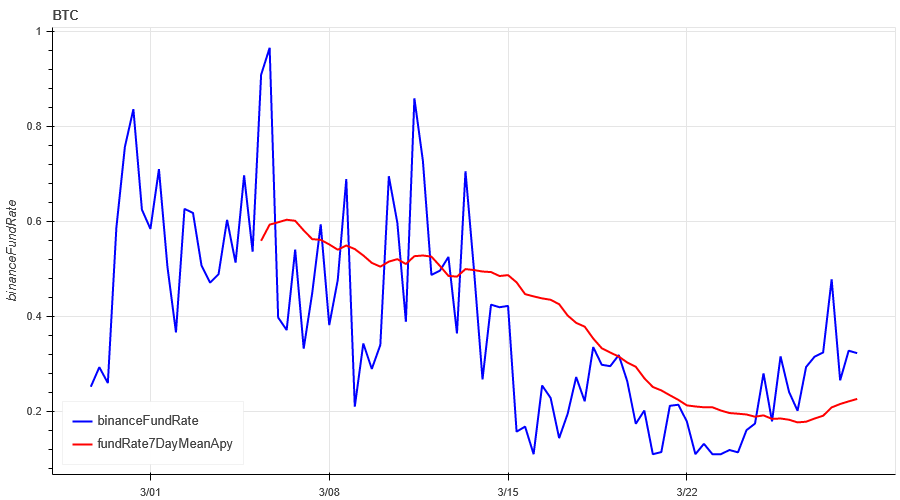
The blue line is the funding rate of BTC on Binance, and the red line is its 7-day average
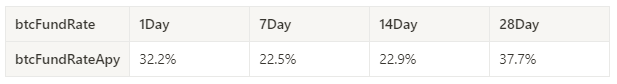
The table shows the average return of BTC fees for different holding days in the past
Market Correlation_Consistent Sentiment
The correlation among the 129 coins selected in the past week has increased to around 0.75, resulting in relatively consistent prices among different varieties.
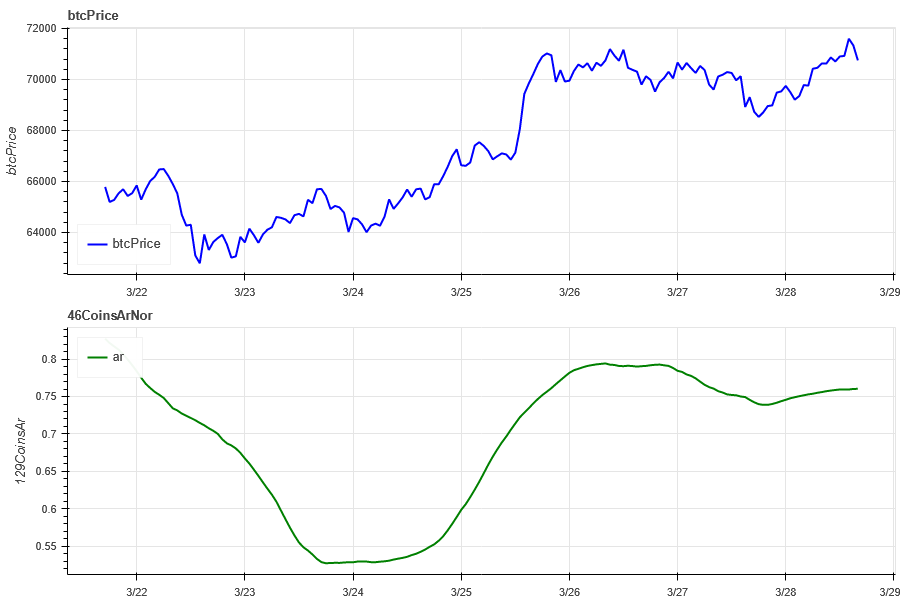
The blue line in the above picture first shows the Bitcoin price, and the green line is [1000 floki, 1000 lunc, 1000 pepe, 1000 shib, 100 0x ec, 1inch, aave, ada , agix, algo, ankr, ant, ape, apt, arb, ar, astr, atom, audio, avax, axs, bal, band, bat, bch, bigtime, blur, bnb, btc, celo, cfx, chz, ckb , comp, crv, cvx, cyber, dash, dgb, doge, dot, dydx, egld, enj, ens, eos,etc, eth, fet, fil, flow, ftm, fxs, gala, gmt, gmx, grt, hbar , hot, icp, icx, imx, inj, iost, iotx, jasmy, kava, klay, ksm, ldo, link, loom, lpt, lqty, lrc, ltc, luna 2, magic, mana, matic, meme, mina, mkr, near, neo, ocean, one, ont, op, pendle, qnt, qtum, rndr, rose, rune , rvn, sand, sei, sfp, skl, snx, sol, ssv, stg, storj, stx, sui, sushi, sxp, theta, tia, trx, t, uma, uni, vet, waves, wld, woo, xem , xlm, xmr, xrp, xtz, yfi, zec, zen, zil, zrx] overall correlation
Market Breadth_Overall Sentiment
Of the 129 coins selected in the past week, 53% had prices above the 30-day moving average, compared to 31% of BTC prices above the 30-day moving average, and 48% had prices greater than 20% from the lowest price in the past 30 days. , the proportion that is less than 10% from the highest price in the past 30 days is 22%. The market width indicator in the past week shows that more than half of the currency prices are above the 30-day moving average, and the overall situation is still in the consolidation stage.
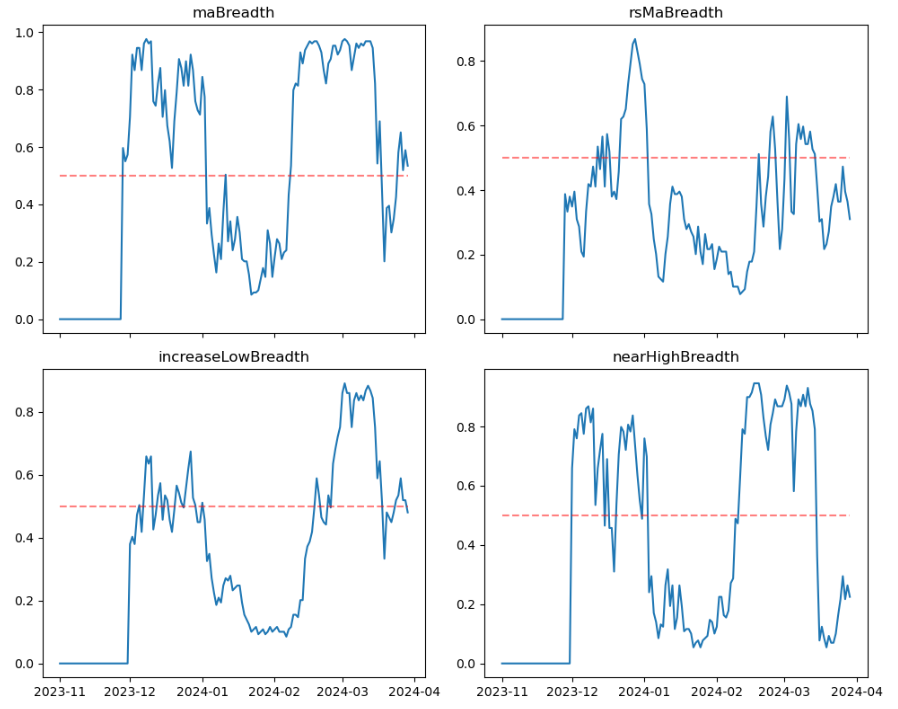
The picture above is [1000 floki, 1000 lunc, 1000 pepe, 1000 shib, 100 0x ec, 1inch, aave, ada, agix, algo, ankr, ant, ape, apt, arb, ar, astr, atom, audio, avax, axs, bal, band , bat, bch, bigtime, blur, bnb, btc, celo, cfx, chz, ckb, comp, crv, cvx, cyber, dash, dgb, doge, dot, dydx, egld, enj, ens, eos,etc, eth , fet, fil, flow, ftm, fxs, gala, gmt, gmx, grt, hbar, hot, icp, icx, imx, inj, iost, iotx, jasmy, kava, klay, ksm, ldo, link, loom, lpt , lqty, lrc, ltc, luna 2, magic, mana, matic, meme, mina, mkr, near, neo , ocean, one, ont, op, pendle, qnt, qtum, rndr, rose, rune, rvn, sand, sei, sfp, skl, snx, sol, ssv, stg, storj, stx, sui, sushi, sxp, theta , tia, trx, t, uma, uni, vet, waves, wld, woo, xem, xlm, xmr, xrp, xtz, yfi, zec, zen, zil, zrx] The proportion of each width indicator on the 30th day

Summarize
In the past week, the prices of Bitcoin (BTC) and Ethereum (ETH) have increased to a certain extent. Bitcoin has increased by 8.06%. The historical volatility has been the largest when it increased at 3.25. The trading volume has dropped to a new high of 3.27. The largest, open interest volume has increased compared with the beginning of the week. Implied volatility BTC was little changed while ETH was up from the start of the week. In addition, funding rates have rebounded from low levels, indicating that contract trading sentiment is gradually recovering. The market width indicator shows that more than half of the currency prices are above the 30-day moving average, and the overall price is still in the consolidation stage. In terms of events, there was no major data release in the past week, and we are waiting for the non-agricultural data at the beginning of next month.
Twitter: @DerivativesCN
Website: https://dcbot.ai/


