
加密市场情绪研究报告(2024.02.02-02.09): 2023资产表现回顾与2024的展望
2023 Asset Performance Review
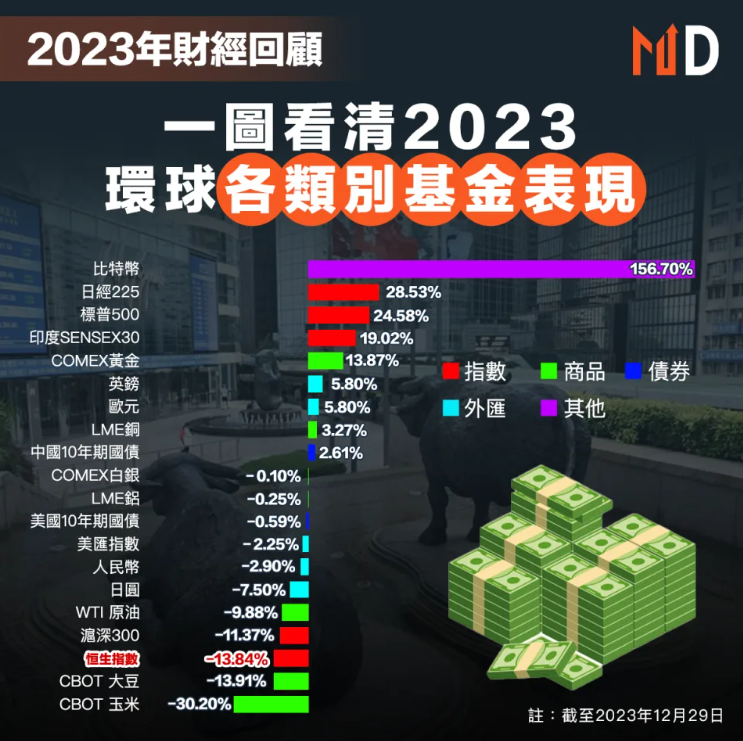
Image Source:https://hk.finance.yahoo.com/news/2023 Financial Review - Pictures show the performance of various global assets - 041856444.html? guccounter= 1guce_referrer=aHR0cHM6Ly93d3cuZ29vZ2xlLmNvbS8guce_referrer_sig=AQAAANupdakYERm6uNaTKDlgFF-ZnzxX1 mjnzBgaYJ1Q6a_WKsi0IpXbEKxIqxyJWKCrlLeYQOrPTEElgpNQK3PLrjGT5ufZAKT2jIdXOV_C6GDO8Fz5IwZMK3v4LbfoDHldLWNDSkcp-PAiC 2 Kw-WomVJyTiP--Fj -mwEQ 9 eVwb 24 yc
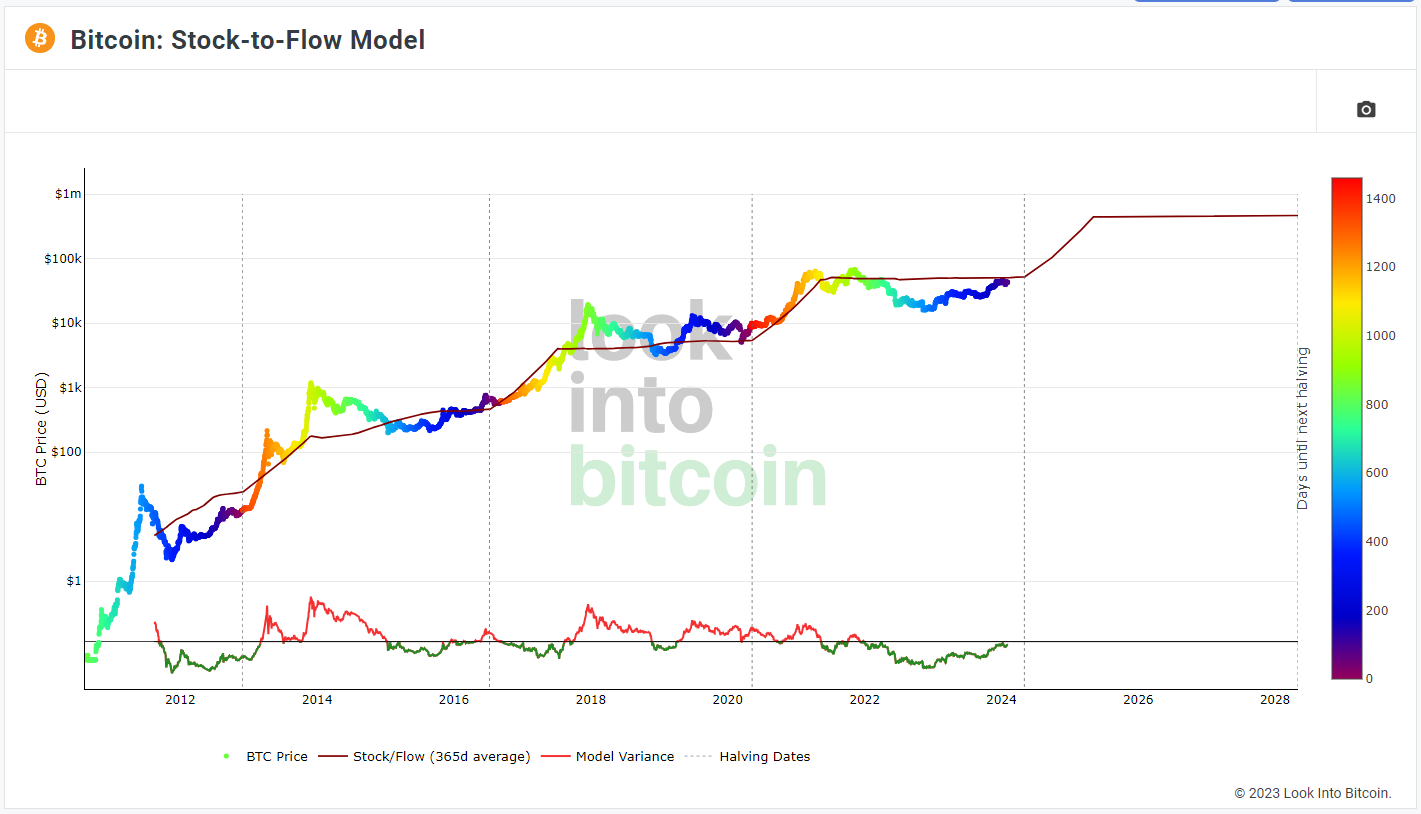
Data Sources:https://www.lookintobitcoin.com/charts/stock-to-flow-model/
Price performance of major assets since 2023
Bitcoin and Nasdaq are the best assets to hold in 2023, with the Hang Seng Index and CSI 300 being the worst. The popularity of blockchain crypto assets has made a comeback. Major financial institutions have issued Bitcoin ETFs, and the Federal Reserve has raised interest rates to It will stop after July 2023, and Bitcoin will be halved in 2024. Bitcoin will continue to receive more investor favor in the next year, and the Stock-to-Flow model predicts that the Bitcoin price will reach $440,000 in 2026. (For reference only), the market value reaches US$9 trillion, and the bull market is expected to bring more investment opportunities.
More ways to get involved with crypto assets
Take the initiative to contact professional crypto investment managers around you
Learn about blockchain’s social media and investment opportunities (x.com: @DerivativesCn)
Plan the capital planning and execution of investment allocation
The Bitcoin halving is about 71 days away from today (2024.02.09)
Countdown to halving:https://www.nicehash.com/countdown/btc-halving-2024-05-10-12-00?_360safeparam=1289146171
Market technical and emotional environment analysis
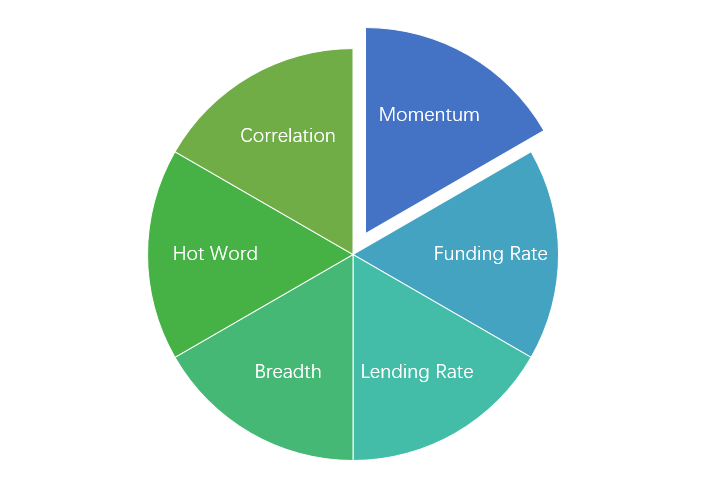
Sentiment analysis components

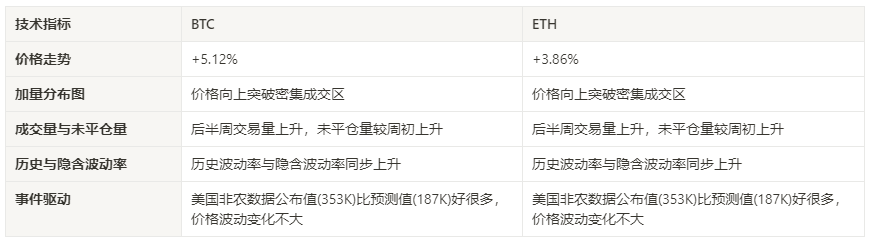
Technical indicators
Price trend
BTC price increased by 5.12% and ETH price increased by 5% in the past week.
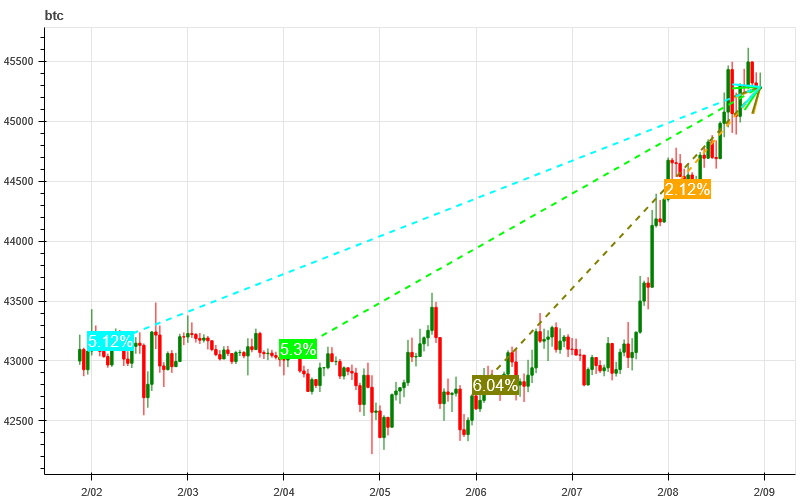
The picture above is the price chart of BTC over the past week
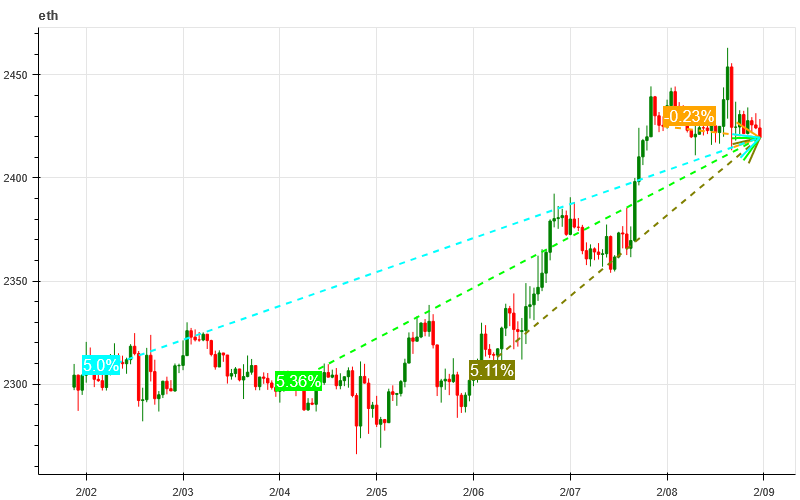
The picture above is the price chart of ETH over the past week
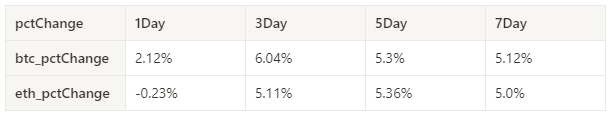
Table showing the rate of price change over the past week
Price and volume distribution chart (support and resistance)
In the past week, BTC and ETH prices broke through intensive trading areas upward.
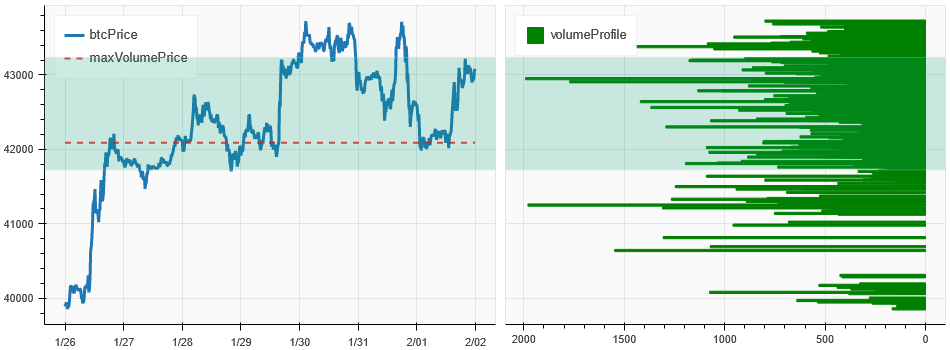
The picture above is the distribution map of BTC’s intensive trading areas in the past week.
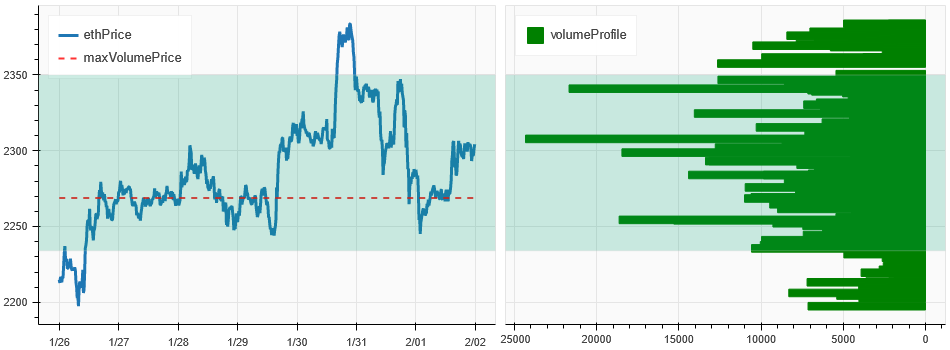
The picture above is the distribution map of ETH’s intensive trading areas in the past week.
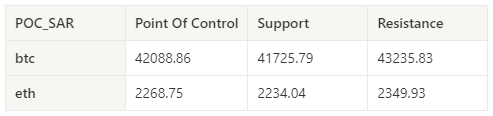
Table showing the intensive weekly trading ranges for BTC and ETH over the past week
Volume and Open Interest
In the past week, the prices and trading volumes of BTC and ETH increased simultaneously in the second half of the week; the open interest of BTC and ETH both increased compared with the beginning of the week.
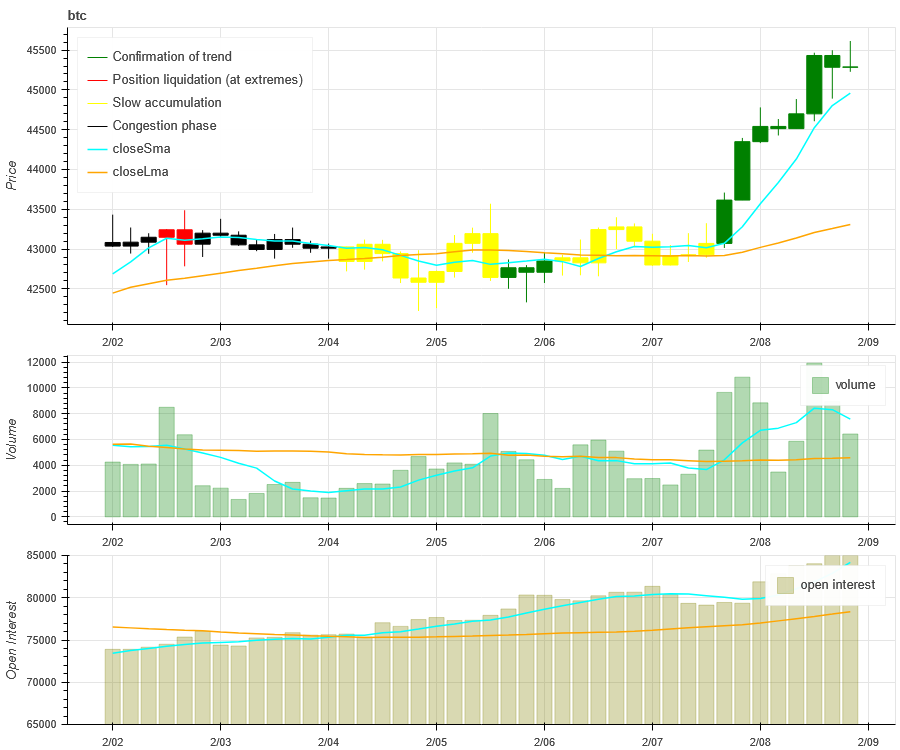
The price trend of BTC at the top of the picture above, the middle is the trading volume, the bottom is the open interest, the light blue is the 1-day average, and the orange is the 7-day average. The color of the K line represents the current status. Green means that the price rise is supported by trading volume, red means positions are being closed, yellow means positions are slowly accumulating, and black means congestion.
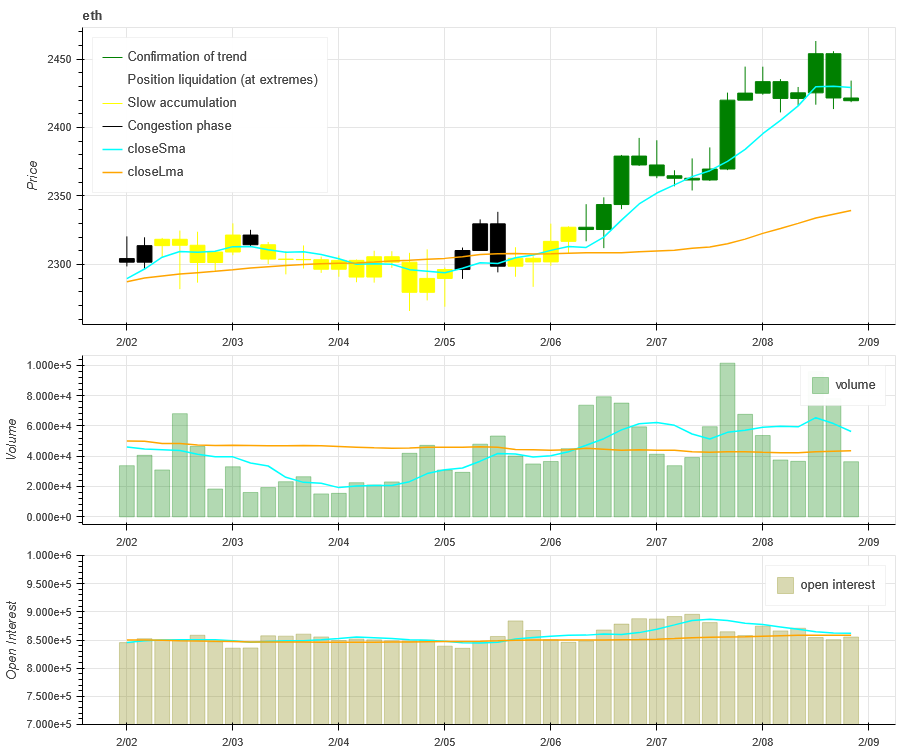
The price trend of ETH at the top of the picture above, the middle is the trading volume, the bottom is the open interest, the light blue is the 1-day average, and the orange is the 7-day average. The color of the K line represents the current status. Green means that the price rise is supported by trading volume, red means positions are being closed, yellow means positions are slowly accumulating, and black means congestion.
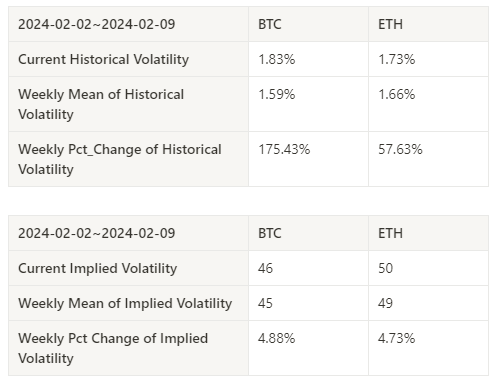
Historical Volatility vs. Implied Volatility
The historical and implied volatility of BTC and ETH increased in tandem over the past week.
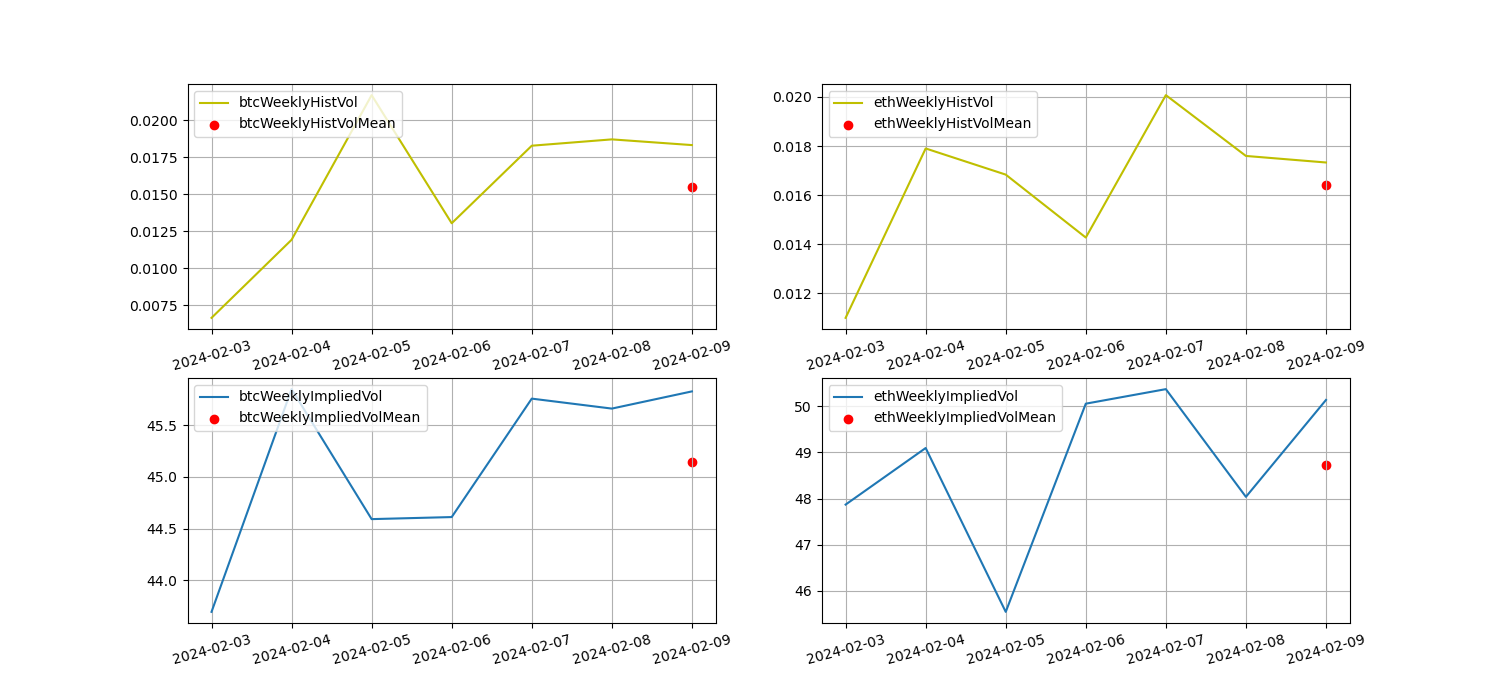
The yellow line is historical volatility, the blue line is implied volatility, and the red dot is its 7-day average
event driven
This week’s U.S. non-agricultural data time (2024.02.02 21:30 Beijing time), the announced value (353 K) is much better than the predicted value (187 K). After the announcement, the Bitcoin price fell slightly and then rebounded, with little price fluctuation. Then it started to rise continuously on 2024.02.06.
sentiment indicator
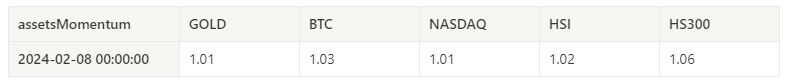
momentum sentiment
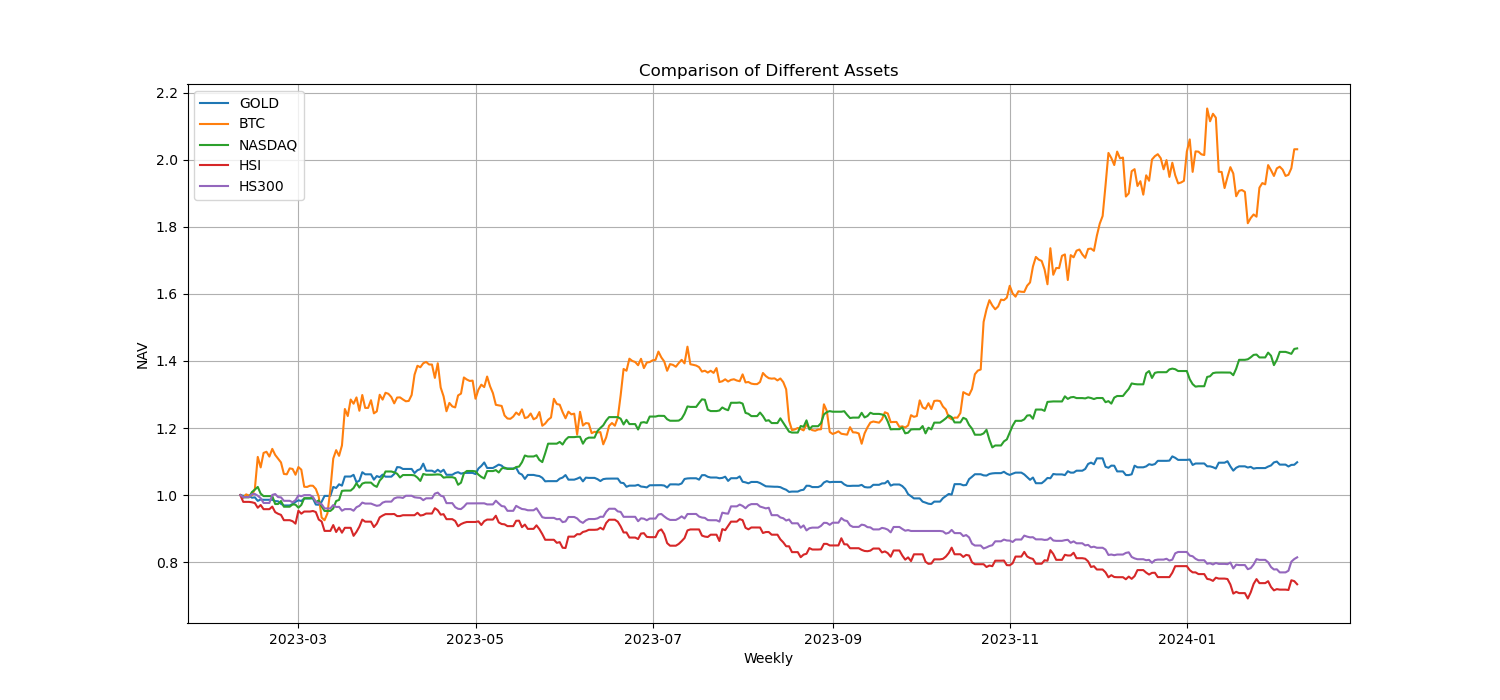
Among Bitcoin/Gold/Nasdaq/HSI/CSI 300, CSI 300 was the strongest, while gold was the worst performer.
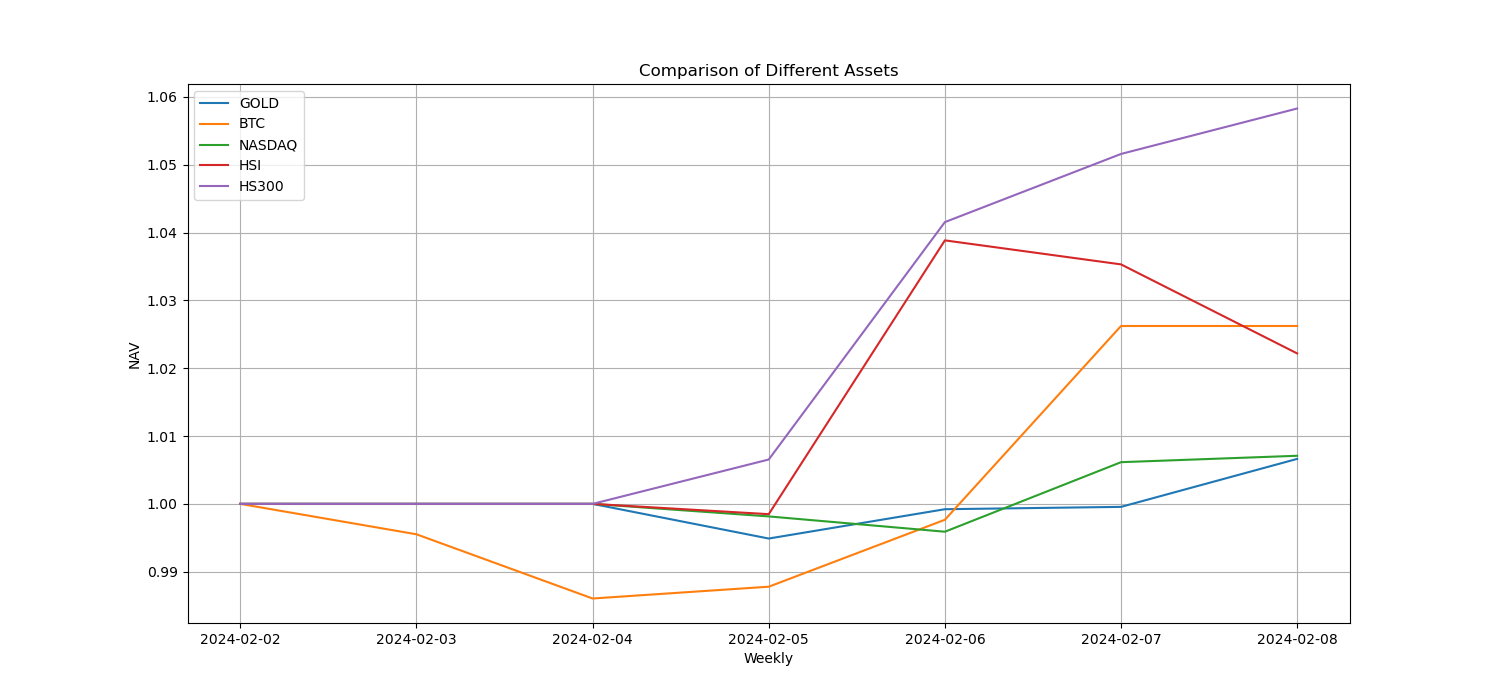
The picture above shows the trends of different assets over the past week.
Lending interest rate_Lending sentiment
The annualized return on USD lending averaged 14.3% in the past week, and short-term interest rates remained around 14%.
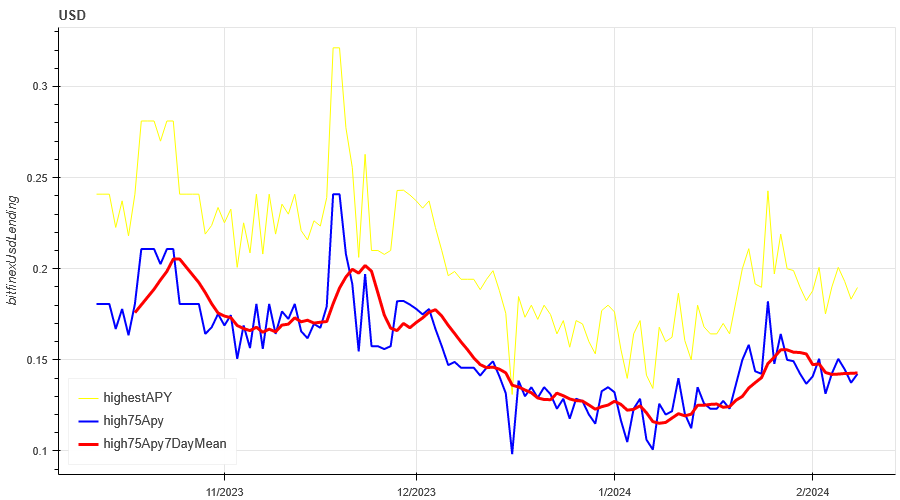
The yellow line is the highest price of the USD interest rate, the blue line is 75% of the highest price, and the red line is the 7-day average of 75% of the highest price
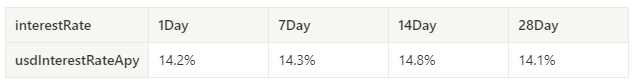
The table shows the average return of USD interest rate for different holding days in the past
Funding Rate_Contract Leverage Sentiment
The average annualized return on BTC tariffs in the past week was 9.4%, and contract leverage sentiment continues to be low.
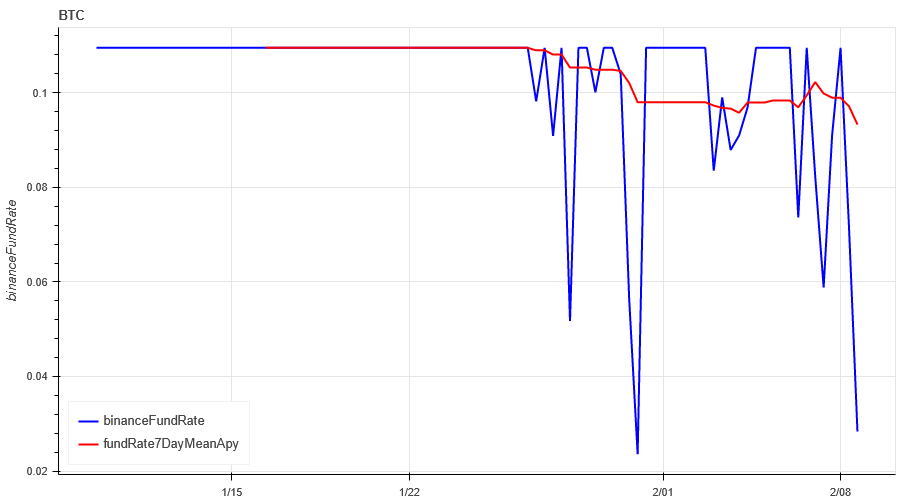
The blue line is the funding rate of BTC on Binance, and the red line is its 7-day average
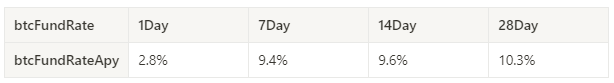
The table shows the average return of BTC fees for different holding days in the past
Market Correlation_Consistent Sentiment
Among the 129 coins selected in the past week, the correlation dropped to around 0.5, resulting in divergent prices among different varieties.
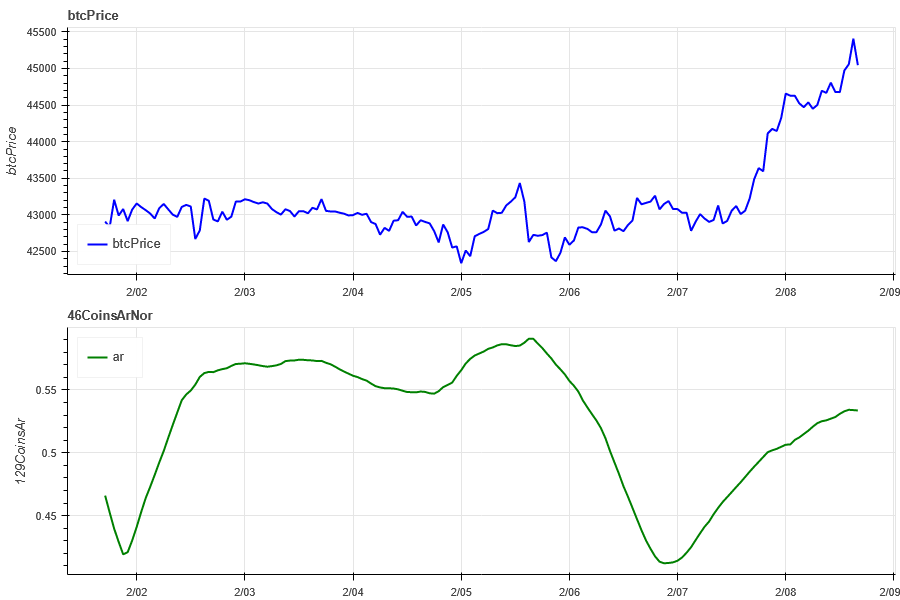
The blue line in the above picture first shows the Bitcoin price, and the green line is [1000 floki, 1000 lunc, 1000 pepe, 1000 shib, 100 0x ec, 1inch, aave, ada , agix, algo, ankr, ant, ape, apt, arb, ar, astr, atom, audio, avax, axs, bal, band, bat, bch, bigtime, blur, bnb, btc, celo, cfx, chz, ckb , comp, crv, cvx, cyber, dash, dgb, doge, dot, dydx, egld, enj, ens, eos,etc, eth, fet, fil, flow, ftm, fxs, gala, gmt, gmx, grt, hbar , hot, icp, icx, imx, inj, iost, iotx, jasmy, kava, klay, ksm, ldo, link, loom, lpt, lqty, lrc, ltc, luna 2, magic, mana, matic, meme, mina, mkr, near, neo, ocean, one, ont, op, pendle, qnt, qtum, rndr, rose, rune , rvn, sand, sei, sfp, skl, snx, sol, ssv, stg, storj, stx, sui, sushi, sxp, theta, tia, trx, t, uma, uni, vet, waves, wld, woo, xem , xlm, xmr, xrp, xtz, yfi, zec, zen, zil, zrx] overall correlation
Market Breadth_Overall Sentiment
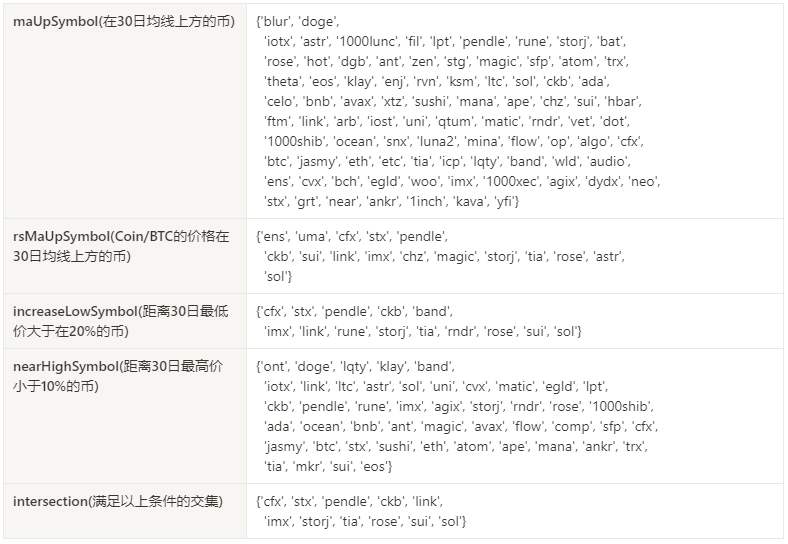
Of the 129 coins selected in the past week, 65% have prices above the 30-day moving average, 10% have BTC prices above the 30-day moving average, and 15% have prices greater than 20% from the lowest price in the past 30 days. , 35% are less than 10% from the highest price in the past 30 days. Most of the overall market has rebounded above the 30-day moving average. Bitcoin prices are strong. Other stronger coins are cfx, stx, pendle , ckb, link, imx, storj, tia, rose, sui, sol.
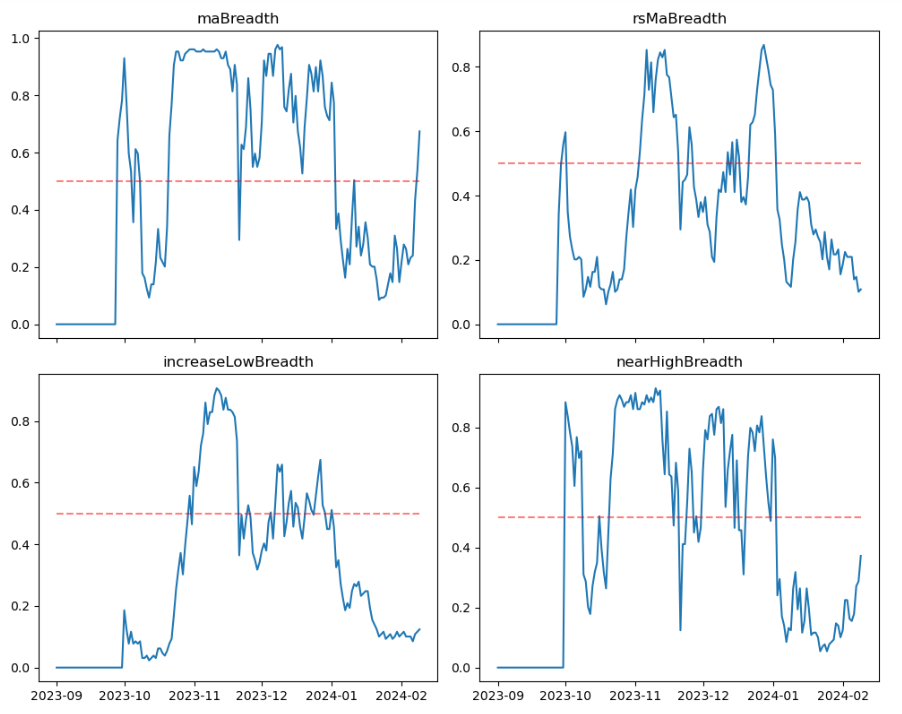
The picture above is [1000 floki, 1000 lunc, 1000 pepe, 1000 shib, 100 0x ec, 1inch, aave, ada, agix, algo, ankr, ant, ape, apt, arb, ar, astr, atom, audio, avax, axs, bal, band , bat, bch, bigtime, blur, bnb, btc, celo, cfx, chz, ckb, comp, crv, cvx, cyber, dash, dgb, doge, dot, dydx, egld, enj, ens, eos,etc, eth , fet, fil, flow, ftm, fxs, gala, gmt, gmx, grt, hbar, hot, icp, icx, imx, inj, iost, iotx, jasmy, kava, klay, ksm, ldo, link, loom, lpt , lqty, lrc, ltc, luna 2, magic, mana, matic, meme, mina, mkr, near, neo , ocean, one, ont, op, pendle, qnt, qtum, rndr, rose, rune, rvn, sand, sei, sfp, skl, snx, sol, ssv, stg, storj, stx, sui, sushi, sxp, theta , tia, trx, t, uma, uni, vet, waves, wld, woo, xem, xlm, xmr, xrp, xtz, yfi, zec, zen, zil, zrx] The proportion of each width indicator on the 30th day
Summarize
This weeks market prices for BTC and ETH increased by 5% overall. The trading volume, open interest, historical volatility and implied volatility of both have increased compared with the beginning of the week. The market has obviously picked up; 129 Binance width indicators show Most of this week has rebounded to above the 30-day moving average, and the price of Bitcoin is strong. Other stronger coins are cfx, stx, pendle, ckb, link, imx, storj , tia, rose, sui, sol; In terms of events, this weeks US non-agricultural data time (Beijing time 2024.02.02 21:30), the published value (353 K) is higher than the predicted value (187 K) was much better. After the announcement, the price of Bitcoin dropped slightly and then rebounded. The price fluctuation did not change much, and then began to continue to rise on 2024.02.06.
Twitter: @DerivativesCN
Website: https://dcbot.ai/


