
加密市场情绪研究报告(2024.01.26-02.02):议息会议时间段比特币急跌后企稳
Bitcoin price stabilized after falling sharply (-4.3%) during the interest rate meeting
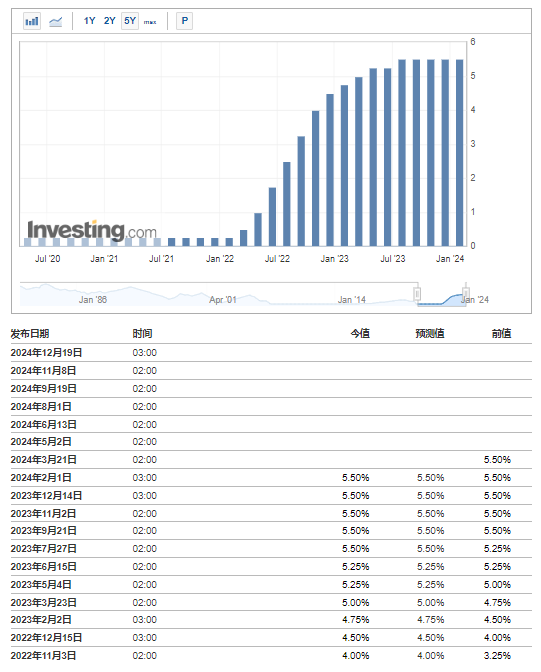
In the early morning of February 1, Beijing time, the Federal Reserve announced that it would keep the federal funds target rate unchanged at 5.25-5.5%, in line with market expectations, and continue to implement balance sheet reduction in accordance with its previous plan. This is the fourth consecutive time the Federal Reserve has paused raising interest rates since its September 2023 interest rate meeting. It hinted that the rate hike was completed but did not provide a timetable for rate cuts. The price of Bitcoin stabilized after plummeting from 43,750 to a low of 41,866 (-4.3%) during the Federal Reserve’s interest rate meeting (2:00 am Beijing time), and then rebounded to around 43,000.
The Bitcoin halving is about 68 days away from today (2024.02.02)
Countdown to halving:https://www.nicehash.com/countdown/btc-halving-2024-05-10-12-00?_360safeparam=1289146171
Market technical and emotional environment analysis
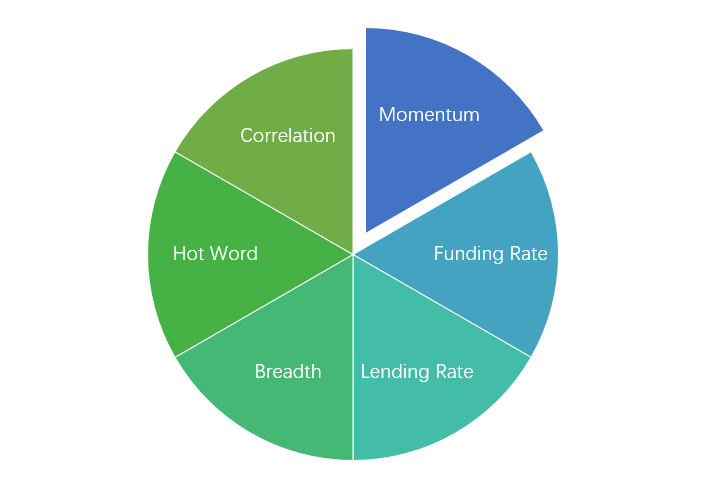
Sentiment analysis components
Technical indicators
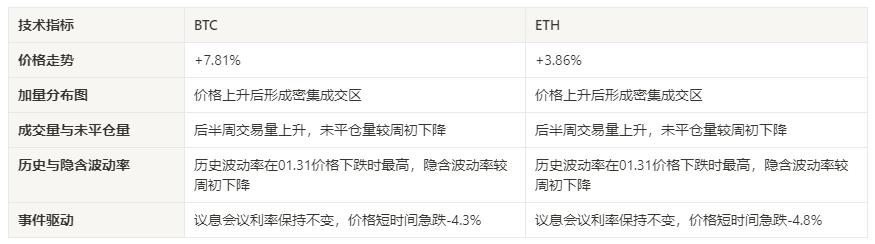
Price trend
BTC price increased by 7.81% and ETH price increased by 3.86% in the past week.
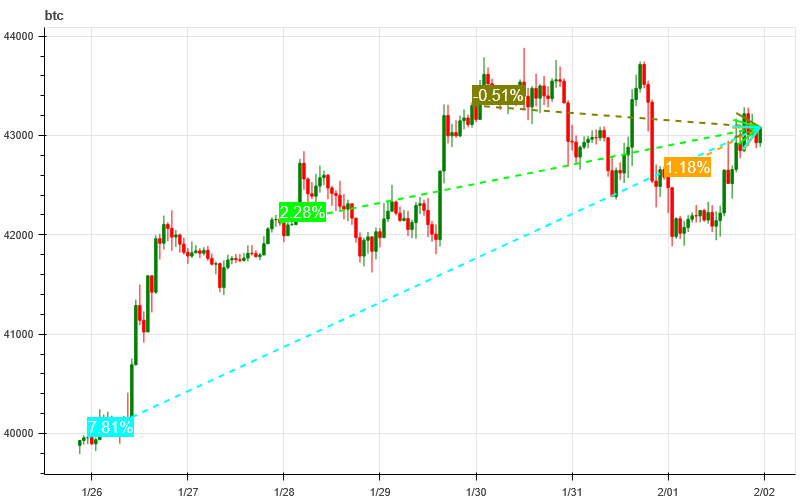
The picture above is the price chart of BTC over the past week
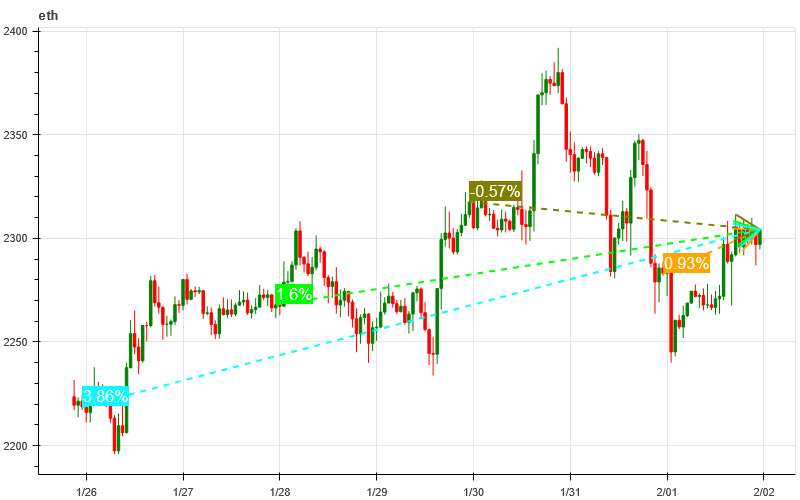
The picture above is the price chart of ETH over the past week
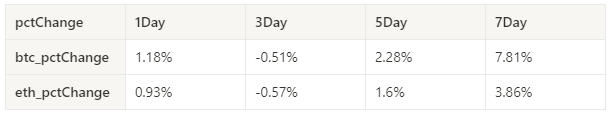
Table showing the rate of price change over the past week
Price and volume distribution chart (support and resistance)
BTC and ETH formed intensive trading areas after rising prices in the past week.
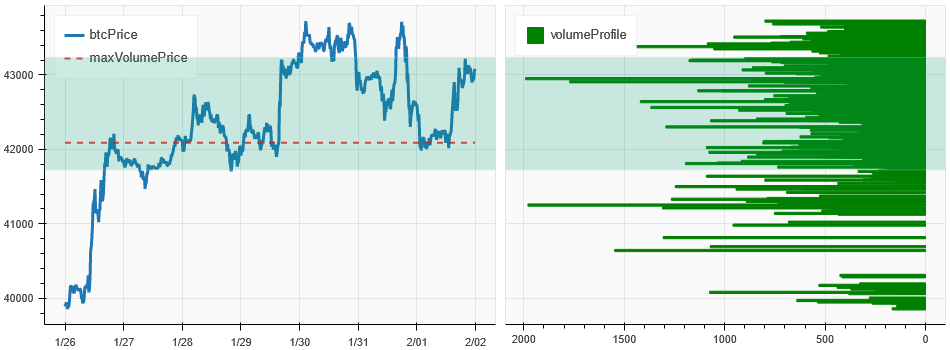
The picture above is the distribution map of BTC’s intensive trading areas in the past week.
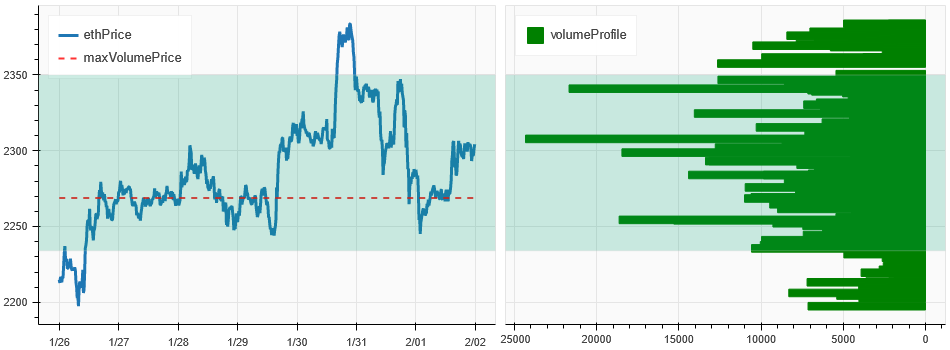
The picture above is the distribution map of ETH’s intensive trading areas in the past week.
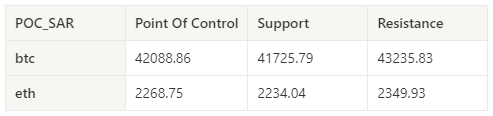
Table showing the intensive weekly trading ranges for BTC and ETH over the past week
Volume and Open Interest
In the past week, the trading volume of BTC and ETH increased in the second half of the week; the open interest of BTC and ETH both decreased compared with the beginning of the week.
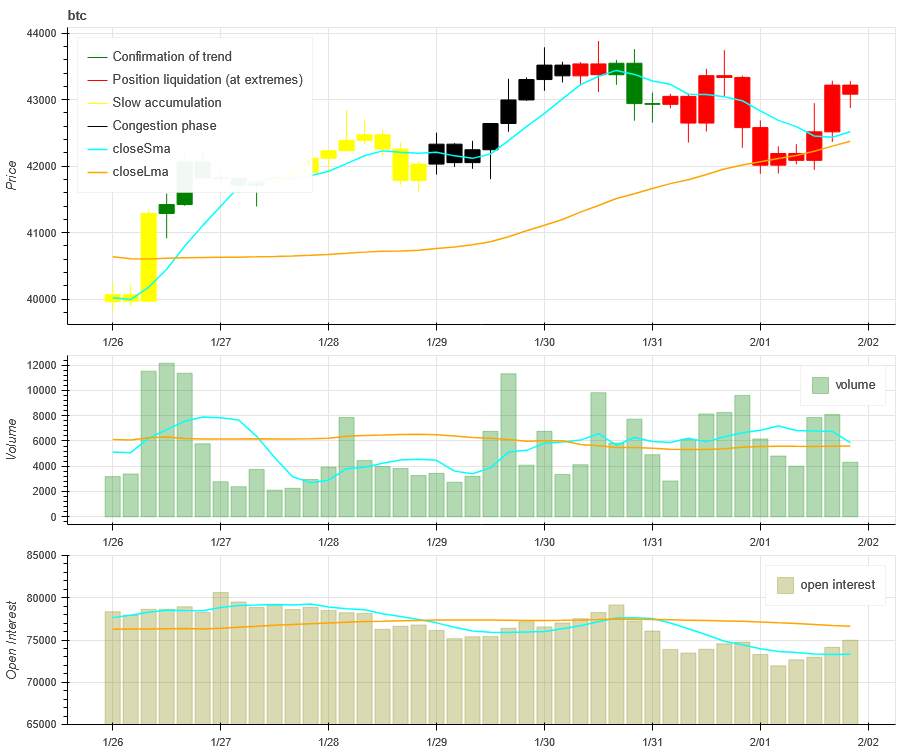
The price trend of BTC at the top of the picture above, the middle is the trading volume, the bottom is the open interest, the light blue is the 1-day average, and the orange is the 7-day average. The color of the K line represents the current status. Green means that the price rise is supported by trading volume, red means positions are being closed, yellow means positions are slowly accumulating, and black means congestion.
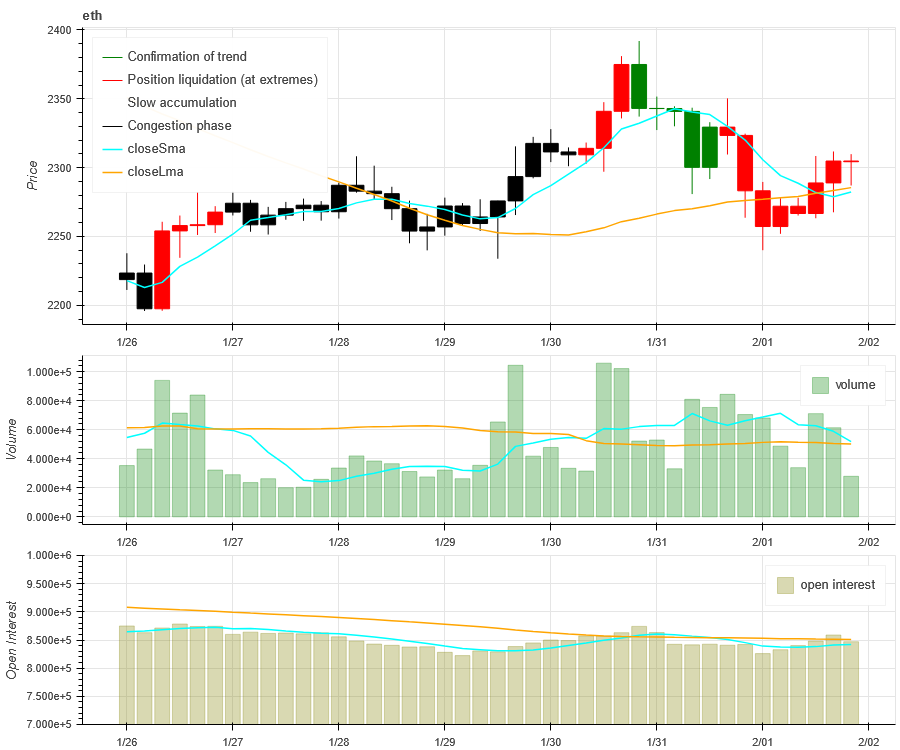
The price trend of ETH at the top of the picture above, the middle is the trading volume, the bottom is the open interest, the light blue is the 1-day average, and the orange is the 7-day average. The color of the K line represents the current status. Green means that the price rise is supported by trading volume, red means positions are being closed, yellow means positions are slowly accumulating, and black means congestion.
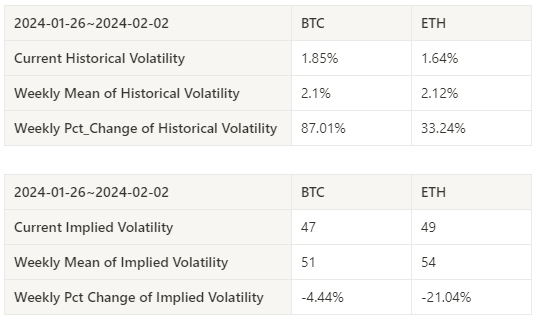
Historical Volatility vs. Implied Volatility
Historical volatility for BTC and ETH over the past week was highest at 01.31 when prices dropped, with implied volatility down from the start of the week.
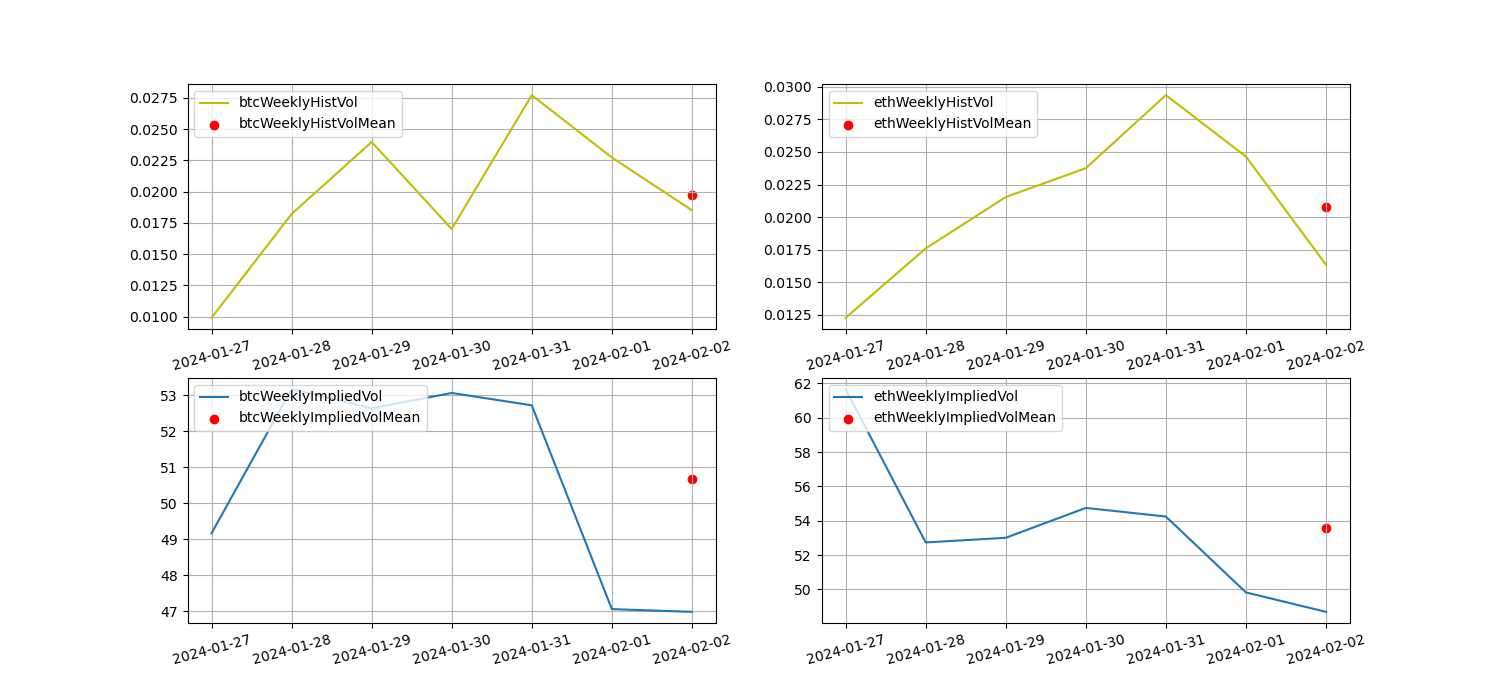
The yellow line is historical volatility, the blue line is implied volatility, and the red dot is its 7-day average
event driven
This weeks Federal Reserve interest rate meeting time (2:00 am Beijing time), the federal funds target interest rate was kept unchanged at 5.25-5.5%, in line with market expectations. The price of Bitcoin plummeted from 43750 to a minimum of 41866 (-4.3%) and then stabilized. It then rebounded to around 43,000.
sentiment indicator
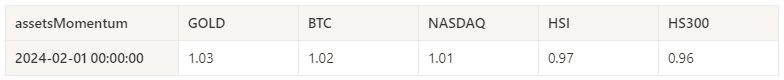
momentum sentiment
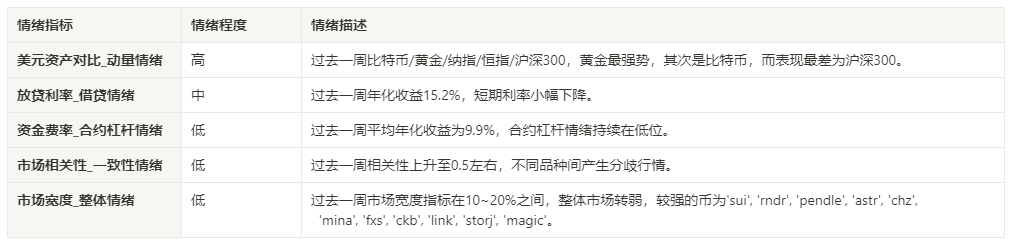
Among Bitcoin/Gold/Nasdaq/HSI/CSI 300, gold was the strongest in the past week, while the worst performer was CSI 300.
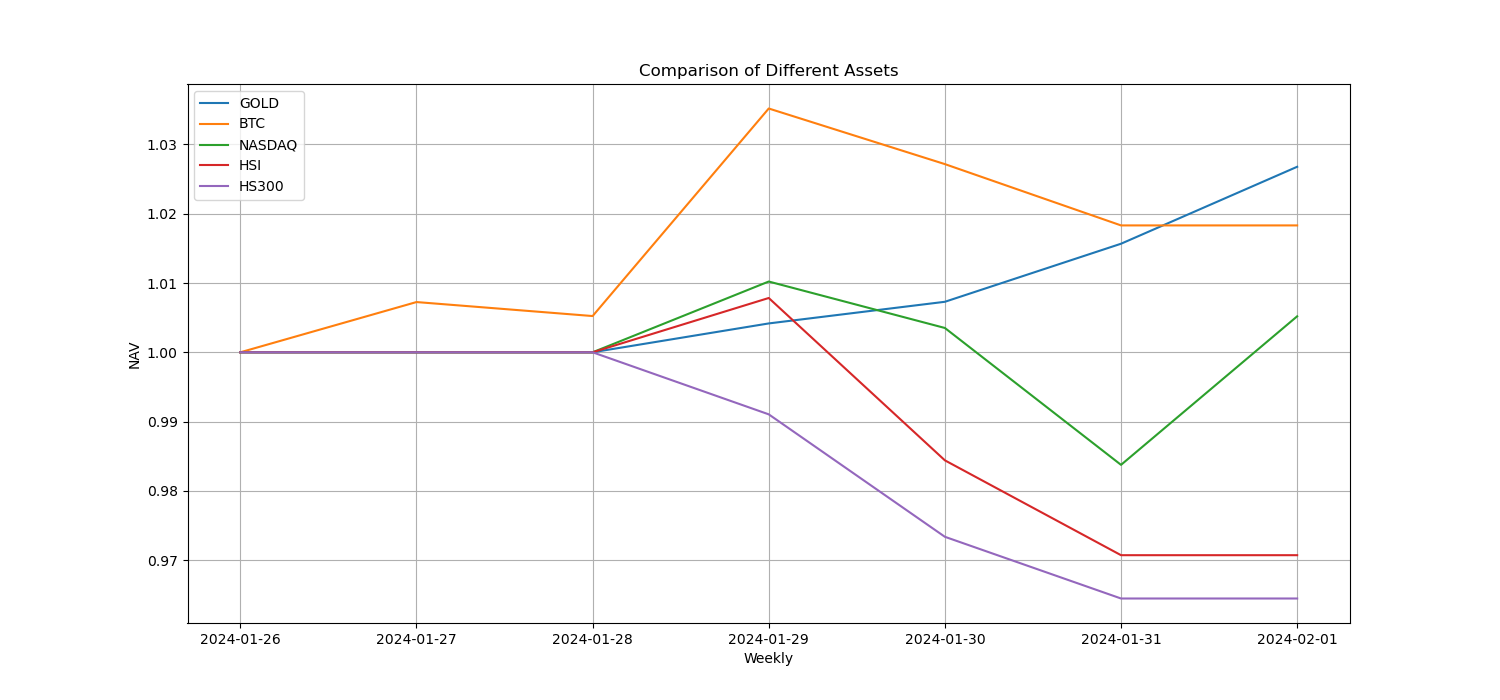
The picture above shows the trends of different assets over the past week.
Lending interest rate_Lending sentiment
The annualized return on USD lending averaged 15.2% in the past week, and short-term interest rates fell slightly.
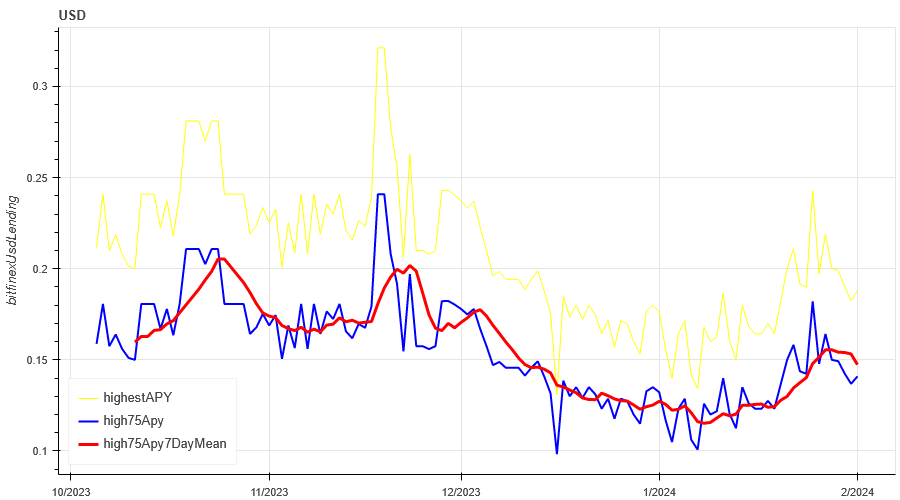
The yellow line is the highest price of the USD interest rate, the blue line is 75% of the highest price, and the red line is the 7-day average of 75% of the highest price
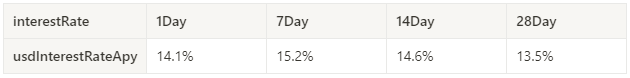
The table shows the average return of USD interest rate for different holding days in the past
Funding Rate_Contract Leverage Sentiment
The average annualized return on BTC tariffs in the past week was 9.9%, and contract leverage sentiment continues to be low.
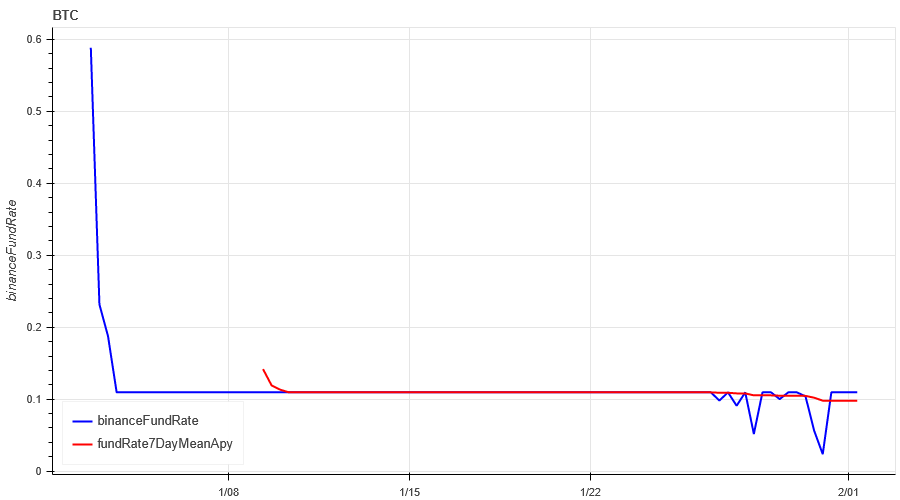
The blue line is the funding rate of BTC on Binance, and the red line is its 7-day average
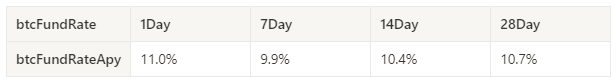
The table shows the average return of BTC fees for different holding days in the past
Market Correlation_Consistent Sentiment
Among the 129 coins selected in the past week, the correlation dropped to around 0.5, resulting in divergent prices among different varieties.
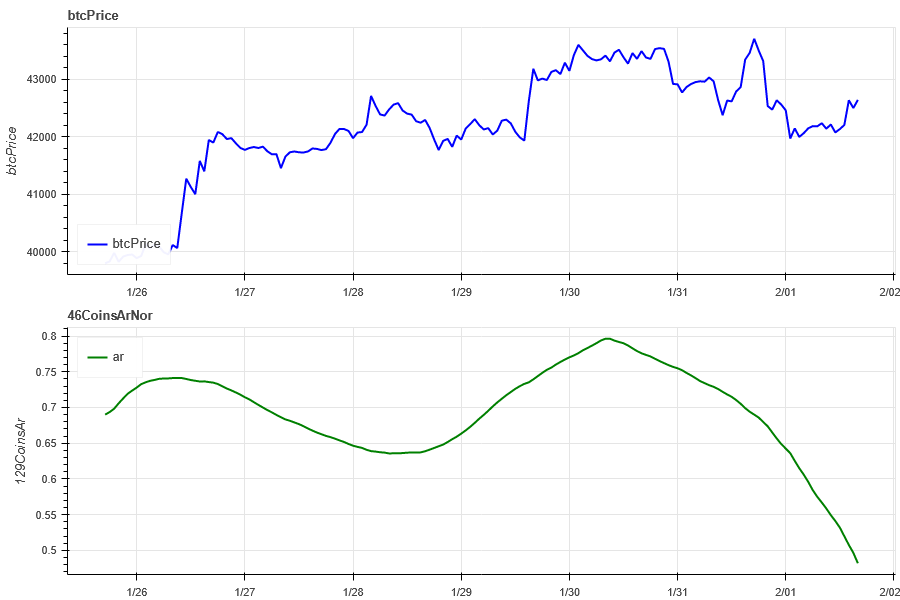
The blue line in the above picture first shows the Bitcoin price, and the green line is [1000 floki, 1000 lunc, 1000 pepe, 1000 shib, 100 0x ec, 1inch, aave, ada , agix, algo, ankr, ant, ape, apt, arb, ar, astr, atom, audio, avax, axs, bal, band, bat, bch, bigtime, blur, bnb, btc, celo, cfx, chz, ckb , comp, crv, cvx, cyber, dash, dgb, doge, dot, dydx, egld, enj, ens, eos,etc, eth, fet, fil, flow, ftm, fxs, gala, gmt, gmx, grt, hbar , hot, icp, icx, imx, inj, iost, iotx, jasmy, kava, klay, ksm, ldo, link, loom, lpt, lqty, lrc, ltc, luna 2, magic, mana, matic, meme, mina, mkr, near, neo, ocean, one, ont, op, pendle, qnt, qtum, rndr, rose, rune , rvn, sand, sei, sfp, skl, snx, sol, ssv, stg, storj, stx, sui, sushi, sxp, theta, tia, trx, t, uma, uni, vet, waves, wld, woo, xem , xlm, xmr, xrp, xtz, yfi, zec, zen, zil, zrx] overall correlation
Market Breadth_Overall Sentiment
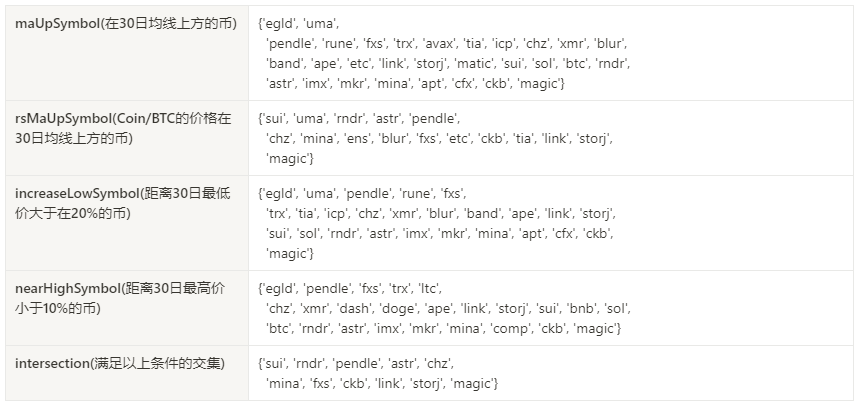
Of the 129 coins selected in the past week, 20% have prices above the 30-day moving average. Compared to BTC, 20% have prices above the 30-day moving average. 10% have prices greater than 20% from the lowest price in the past 30 days. , 20% are less than 10% from the highest price in the past 30 days. The overall market is still in a weak area. The stronger coins are sui, rndr, pendle, astr, chz, mina, fxs, ckb, link, storj, magic.
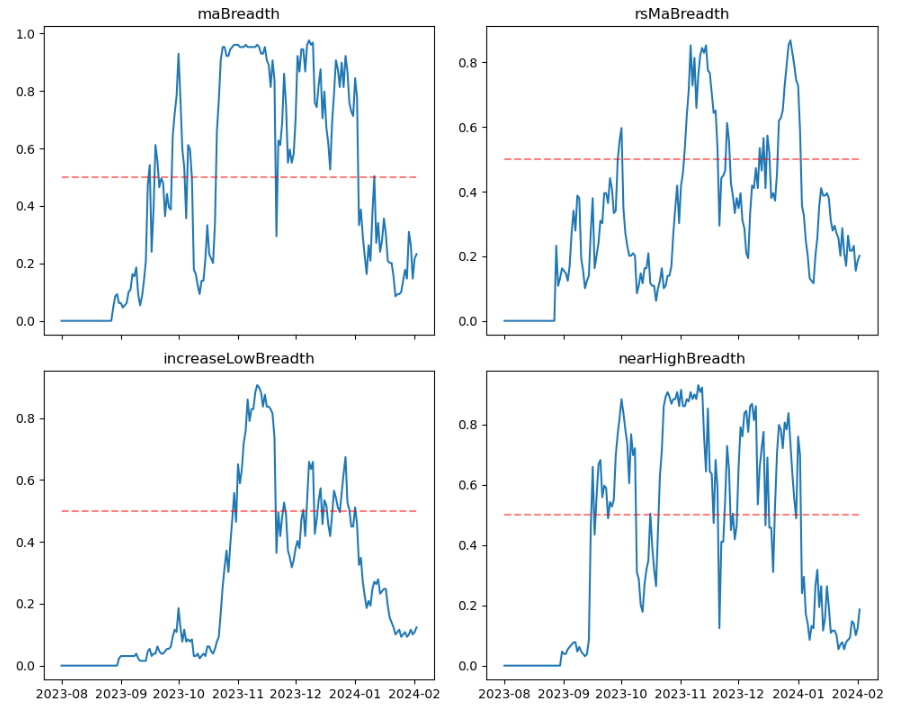
The picture above is [1000 floki, 1000 lunc, 1000 pepe, 1000 shib, 100 0x ec, 1inch, aave, ada, agix, algo, ankr, ant, ape, apt, arb, ar, astr, atom, audio, avax, axs, bal, band , bat, bch, bigtime, blur, bnb, btc, celo, cfx, chz, ckb, comp, crv, cvx, cyber, dash, dgb, doge, dot, dydx, egld, enj, ens, eos,etc, eth , fet, fil, flow, ftm, fxs, gala, gmt, gmx, grt, hbar, hot, icp, icx, imx, inj, iost, iotx, jasmy, kava, klay, ksm, ldo, link, loom, lpt , lqty, lrc, ltc, luna 2, magic, mana, matic, meme, mina, mkr, near, neo , ocean, one, ont, op, pendle, qnt, qtum, rndr, rose, rune, rvn, sand, sei, sfp, skl, snx, sol, ssv, stg, storj, stx, sui, sushi, sxp, theta , tia, trx, t, uma, uni, vet, waves, wld, woo, xem, xlm, xmr, xrp, xtz, yfi, zec, zen, zil, zrx] The proportion of each width indicator on the 30th day
Summarize
This weeks market prices for BTC and ETH have increased slightly overall. The implied volatility and open interest of both have declined compared with the beginning of the week. The market is still in a cold state; 129 Binance width indicators show that this week is still in a weak zone overall. , most of the coins in the market are relatively weak, and the coins with stronger prices include sui, rndr, pendle, astr, chz, mina, fxs, ckb, link , storj, magic; In terms of events, this week the price of Bitcoin plummeted from 43,750 to a minimum of 41,866 (-4.3%) during the Federal Reserves interest rate meeting (2:00 am Beijing time), stabilized, and then rebounded to 43,000 nearby.
Twitter: @DerivativesCN
Website: https://dcbot.ai/


