
Crypto Market Sentiment Research Report (12.08-12.15): US CPI data was in line with expectations, the Dow hit a record high, and Bitcoin rebounded strongly after a sharp decline
U.S. CPI data is in line with expectations, the Dow hits a record high, and Bitcoin rebounds strongly after a sharp decline
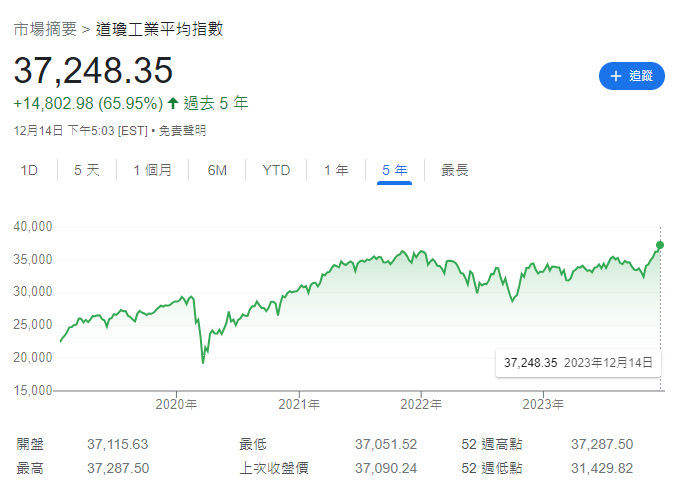
The Dow Jones Industrial Average topped 37,000 points for the first time as markets welcomed signals from the Federal Reserve to cut interest rates, largely dismissing them although Fed Chairman Jerome Powell left open the possibility of further rate hikes. The SP 500 and Nasdaq Composite gained 1.4% each. The Dow Jones surpassed 37,000 points for the first time and closed at a record high of 37,090 points.
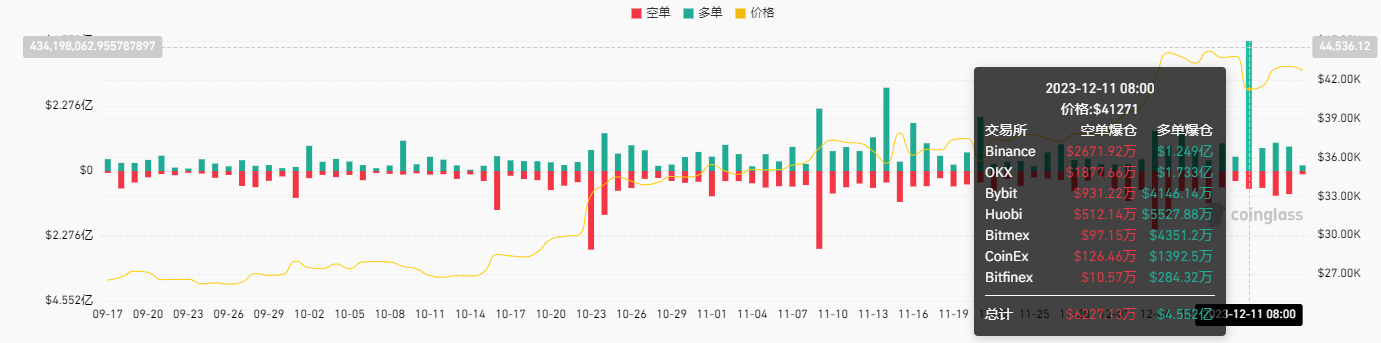
Data Sources:https://www.coinglass.com/zh/LiquidationData
The crypto market experienced a sharp decline on December 11, 2023, with the market liquidation reaching $455.2 million. Subsequently, the price recovered its losses and returned to the upward trend.
Bitcoin halving is about 132 days away from today (2023.12.15)
Countdown to halving:https://www.nicehash.com/countdown/btc-halving-2024-05-10-12-00?_360safeparam=1289146171
Market technical and emotional environment analysis
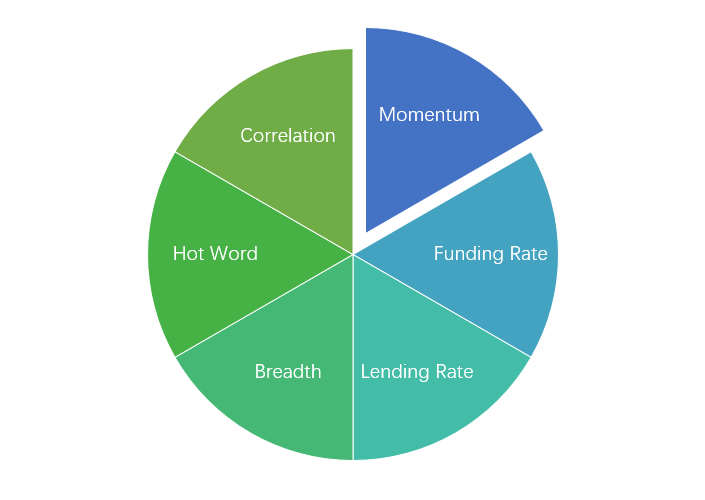
Sentiment analysis components

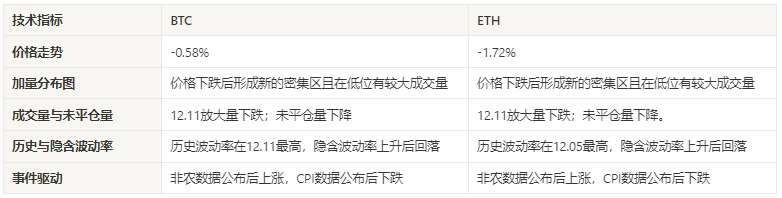
Technical indicators
Price trend
BTC price fell by -0.58% and ETH price fell by -1.72% in the past week.
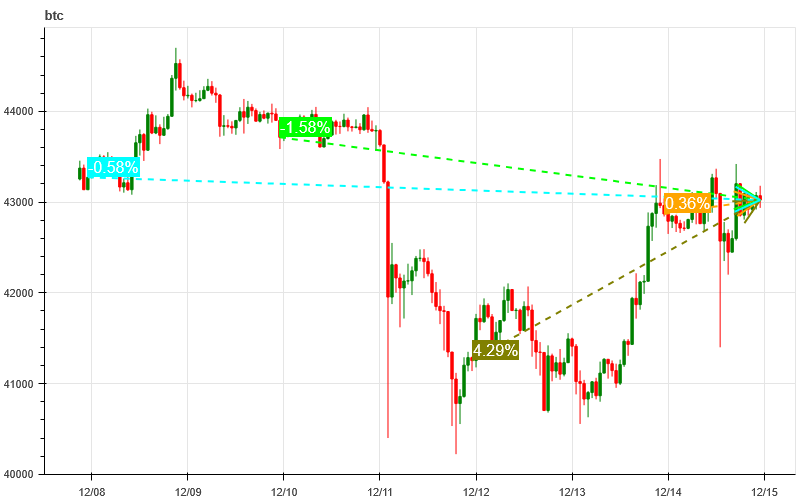
The picture above is the price chart of BTC over the past week
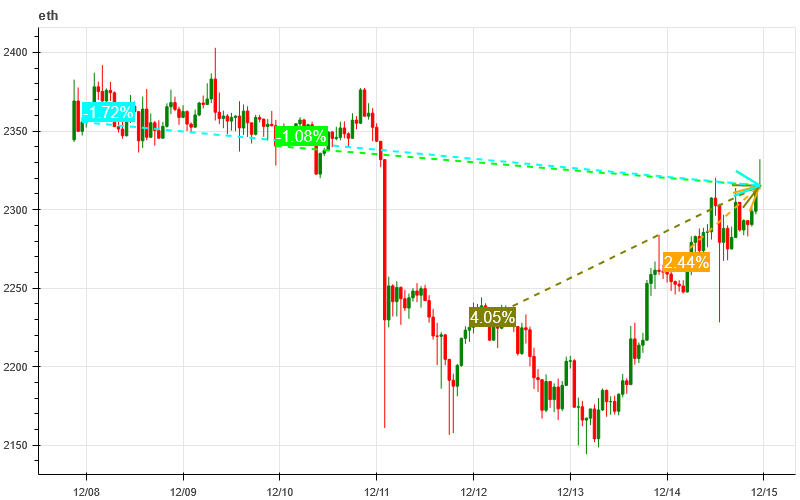
The picture above is the price chart of ETH over the past week
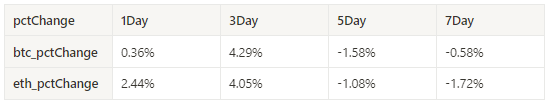
Table showing the rate of price change over the past week
Price and volume distribution chart (support and resistance)
After falling in price over the past week, BTC and ETH formed new dense areas with large trading volumes at low levels.
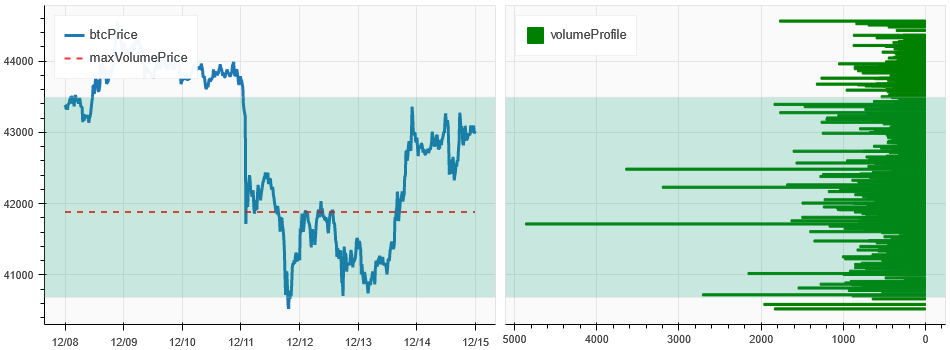
The picture above is the distribution map of BTC’s intensive trading areas in the past week.
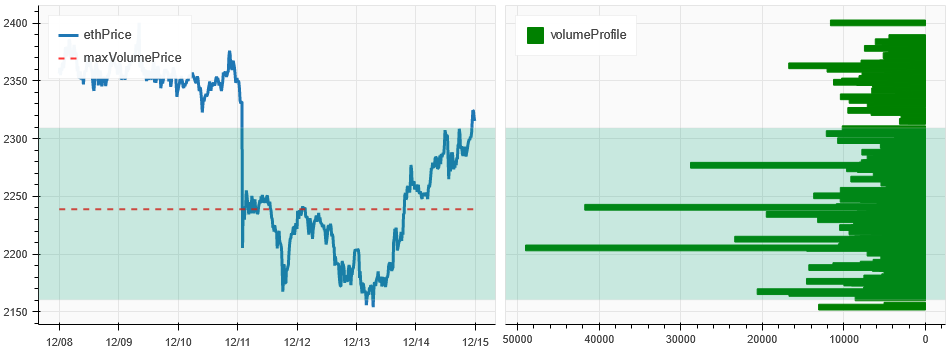
The picture above is the distribution map of ETH’s intensive trading areas in the past week.
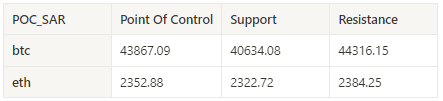
Table showing the intensive weekly trading ranges for BTC and ETH over the past week
Volume and Open Interest
Both BTC and ETH have fallen sharply at 12.11 over the past week; open interest has declined.
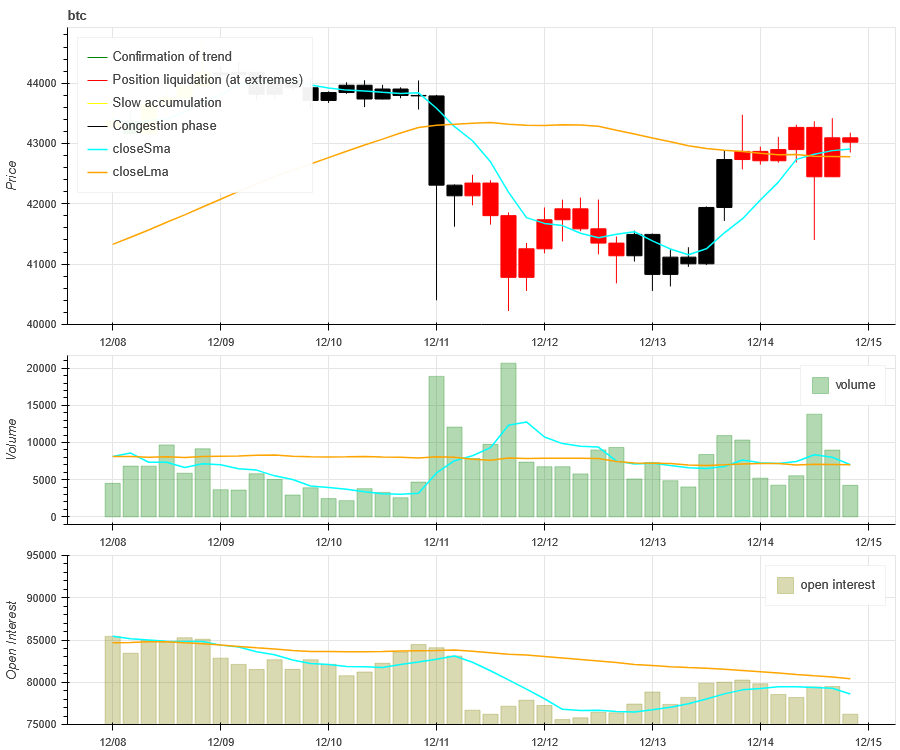
The price trend of BTC at the top of the picture above, the middle is the trading volume, the bottom is the open interest, the light blue is the 1-day average, and the orange is the 7-day average. The color of the K line represents the current status. Green means that the price rise is supported by trading volume, red means positions are being closed, yellow means positions are slowly accumulating, and black means congestion.
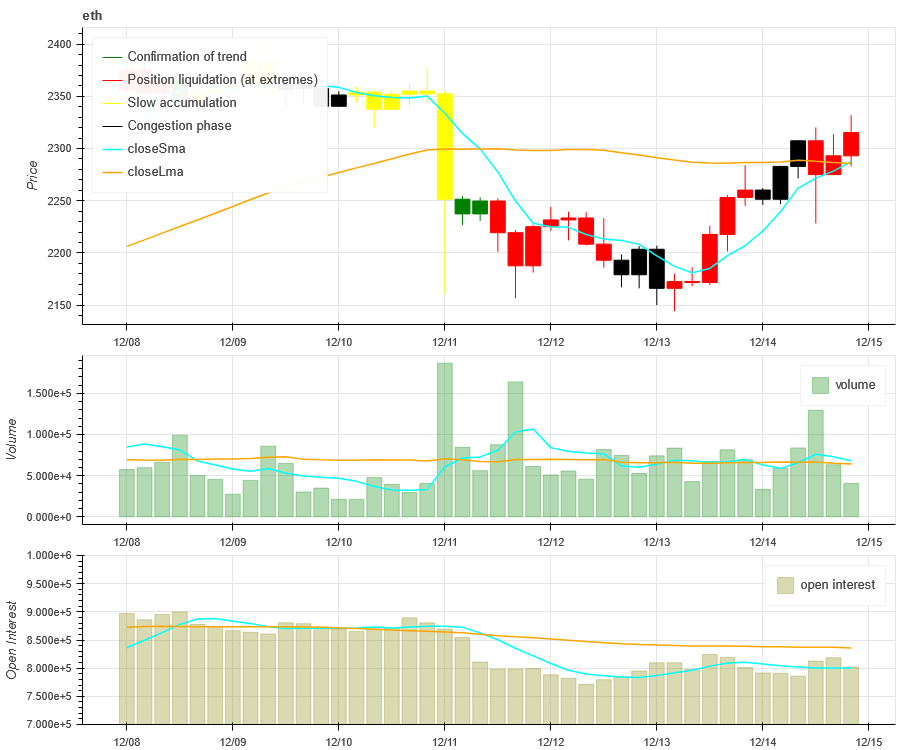
The price trend of ETH at the top of the picture above, the middle is the trading volume, the bottom is the open interest, the light blue is the 1-day average, and the orange is the 7-day average. The color of the K line represents the current status. Green means that the price rise is supported by trading volume, red means positions are being closed, yellow means positions are slowly accumulating, and black means congestion.
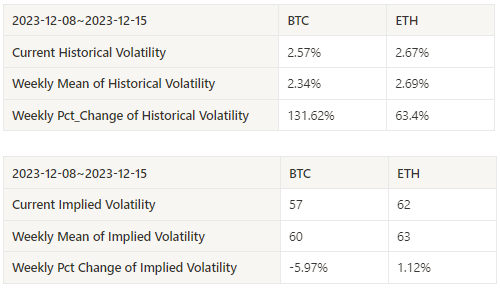
Historical Volatility vs. Implied Volatility
The historical volatility of BTC and ETH in the past week was the highest at 12.11, and the implied volatility fell back after rising.
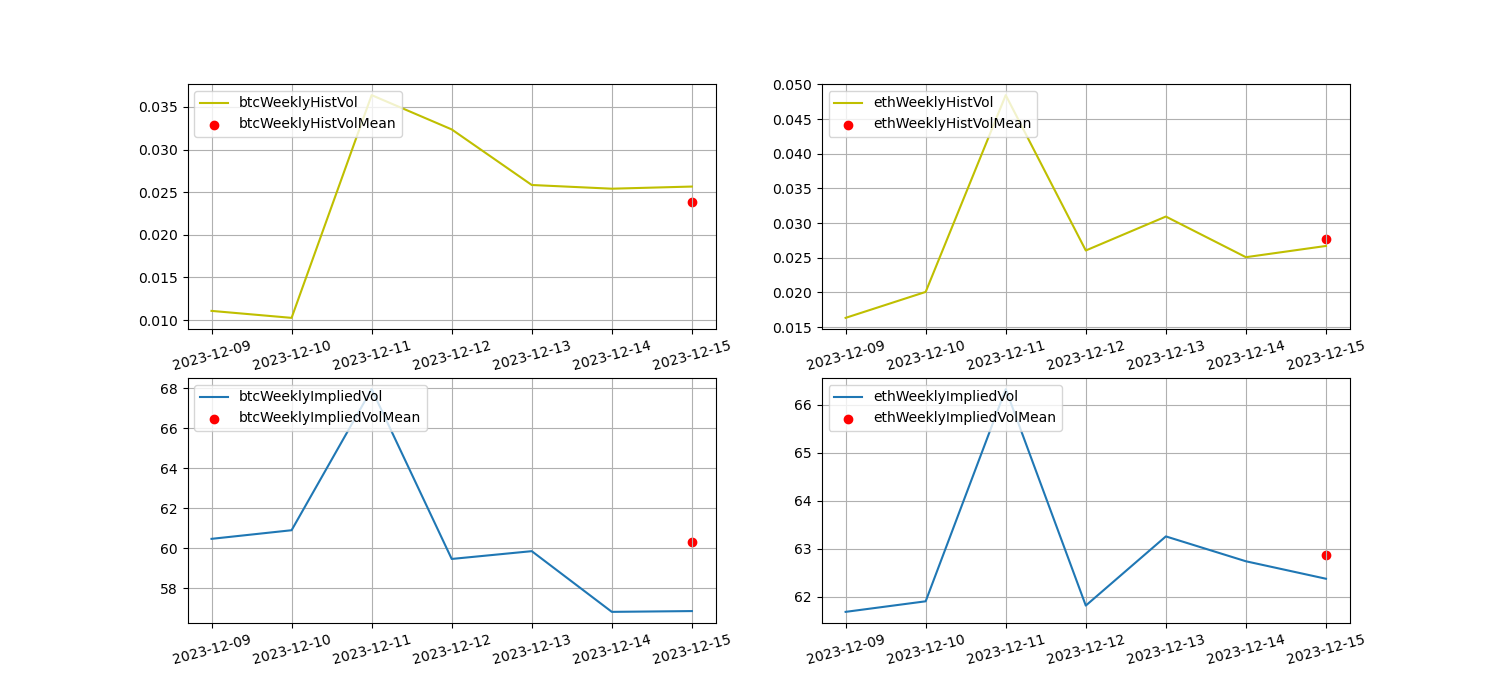
The yellow line is historical volatility, the blue line is implied volatility, and the red dot is its 7-day average
event driven
This weeks non-agricultural and CPI data were released (Beijing time), 2023.12.08 21:30. The non-agricultural data released was better than predicted, and then the price of Bitcoin rose from 43594 to a maximum of 44700 (2023.12.09 05:00), 2023.12.12 21 : 30 The published CPI data was consistent with the predicted value, and then the Bitcoin price fell from 42132 to a minimum of 40222 (2023.12.12 03:30).
sentiment indicator
momentum sentiment
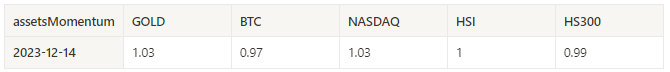
In the past week of Bitcoin/Gold/Nasdaq/HSI/CSI 300, Nasdaq and gold were relatively strong, while the worst performer was Bitcoin.
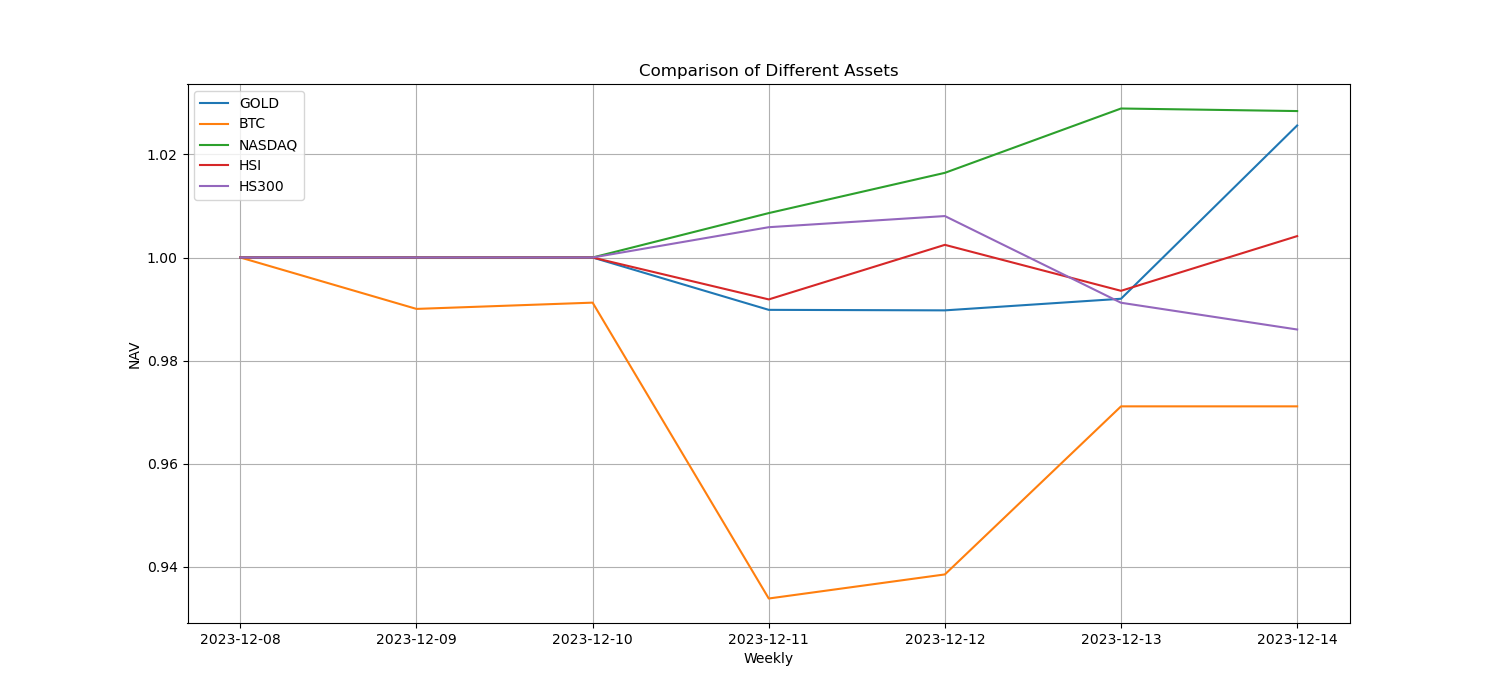
The picture above shows the trends of different assets over the past week.
Lending interest rate_Lending sentiment
The average annualized return on USD lending over the past week was 14.5%, and interest rates continued to fall.
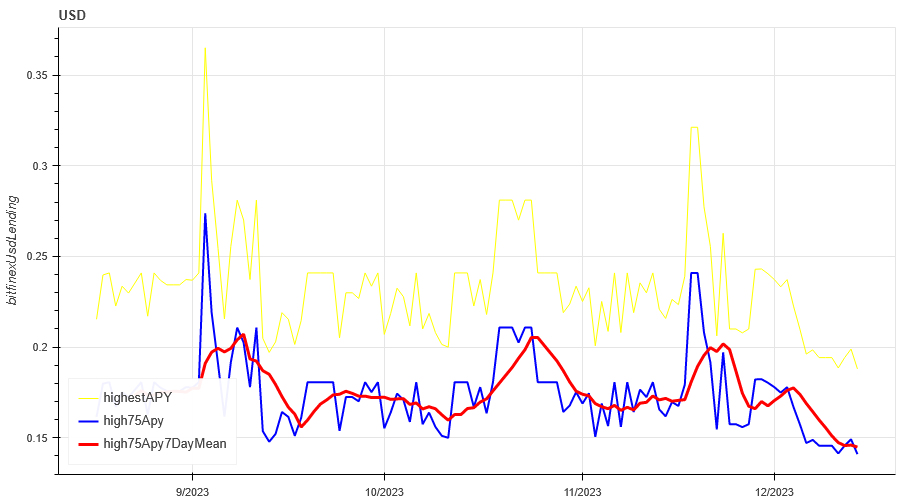
The yellow line is the highest price of the USD interest rate, the blue line is 75% of the highest price, and the red line is the 7-day average of 75% of the highest price
The table shows the average return of USD interest rate for different holding days in the past
Funding Rate_Contract Leverage Sentiment
The average annualized return on BTC tariffs in the past week was 15.8%, and contract leverage sentiment has increased.
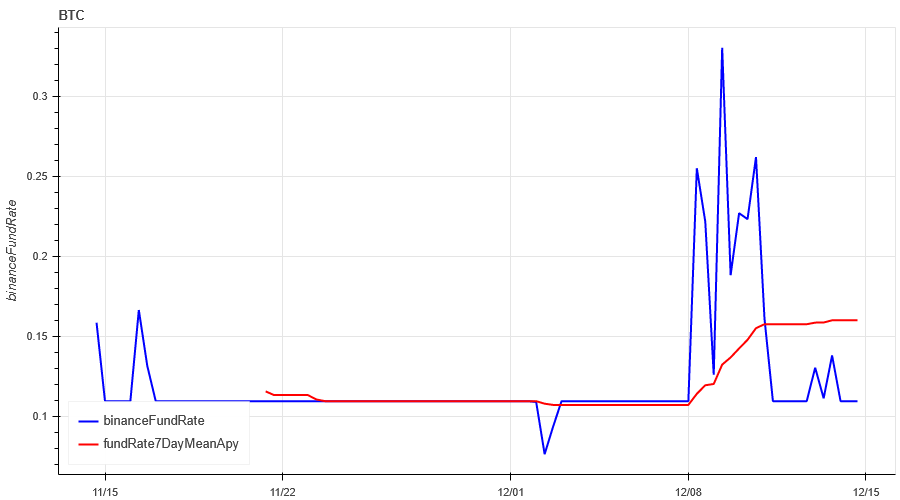
The blue line is the funding rate of BTC on Binance, and the red line is its 7-day average
The table shows the average return of BTC fees for different holding days in the past
Market Breadth_Overall Sentiment
85% of the 46 coins selected in the past week were above the 30-day moving average, which was slightly lower than last week.
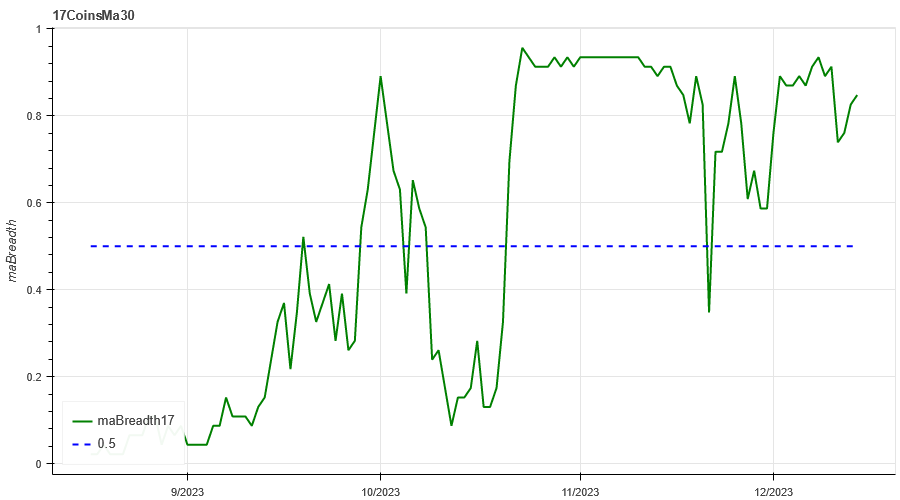
The picture above is [btc, eth, bnb, ltc, bch, doge, matic, sol,link,uni, enj,gala , mana, axs, dydx, fet ,gmx, xlm, xrp, ada, trx, sol, dot, avax, shib, atom, xmr, etc, ldo, hbar, apt, vet, qnt, vet,crv, aave, algo , ftm, ape, neo, sand, eos, xtz, rndr, theta, mkr] proportion above the 30-day moving average
Market Correlation_Consistent Sentiment
Among the 46 coins selected in the past week, the correlation dropped to around 0.47, resulting in divergent prices among different varieties.
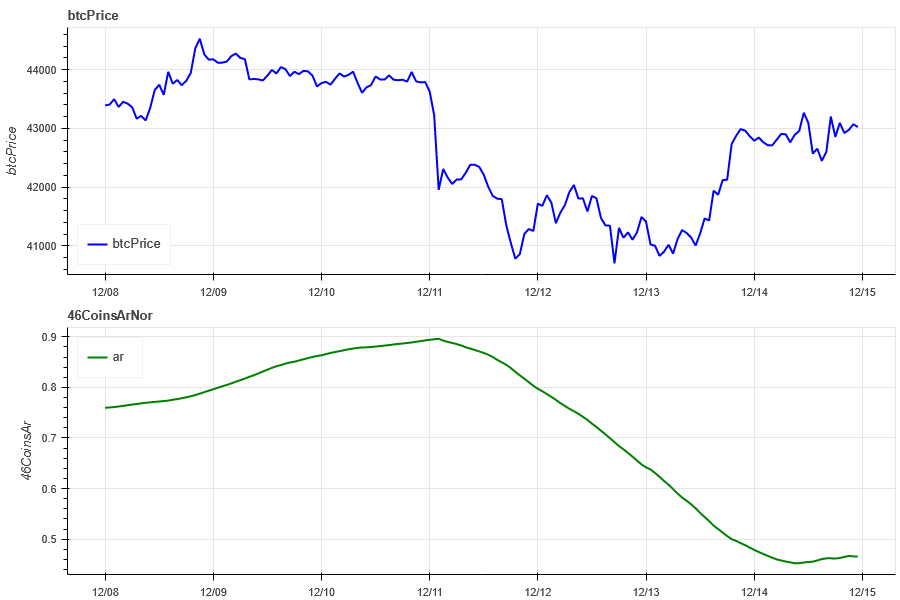
The blue line in the above picture first shows the Bitcoin price, and the green line is [btc, eth, bnb, ltc, bch, doge, matic, sol, link, uni, enj,gala, mana, axs, dydx, fet ,gmx, xlm, xrp, ada, trx, sol , dot, avax, shib, atom, xmr, etc, ldo, hbar, apt, vet, qnt, vet, crv, aave, algo, ftm, ape, neo, sand, eos, xtz, rndr, theta, mkr] overall Correlation
Market Hotspots_Social Media Sentiment
The most popular items in the past week were hbar/aave/fet/sol/ftm, and the rise in sentiment was also accompanied by a larger increase.
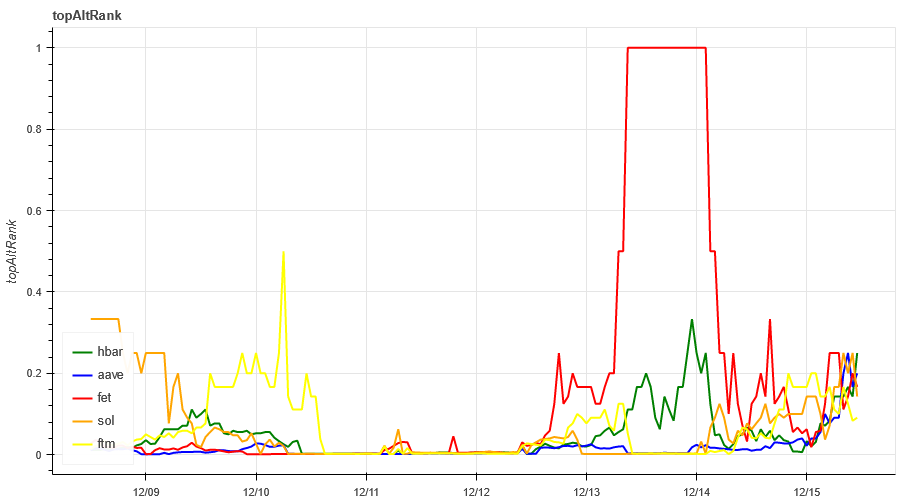
Data Sources:https://lunarcrush.com/categories/cryptocurrencies
Summarize
This weeks market prices of BTC and ETH have both rebounded from sharp declines. The implied volatility has fallen after rising on December 11, 2023. The width indicator shows that it is currently maintaining an upward trend; in terms of hot spots, hbar/aave/fet/sol/ftm has been relatively high recently. , prices continued to rise; in terms of events, the prices of mainstream currencies rose after the release of non-agricultural data, and the prices of mainstream currencies fell after the release of CPI data. The copying strategy has a return of 0.92% in the past 7 days and a return of 5.67% in the past 30 days.
Binance CopyTrading: CTA_ChannelCMT
Twitter: @DerivativesCN
Website: https://dcbot.ai/


