
Crypto Market Sentiment Research Report (11.24-12.03): Volatility leaves the low volatility range
Volatility breaks through the low volatility range and returns to historical levels, and trend strategies usher in good opportunities
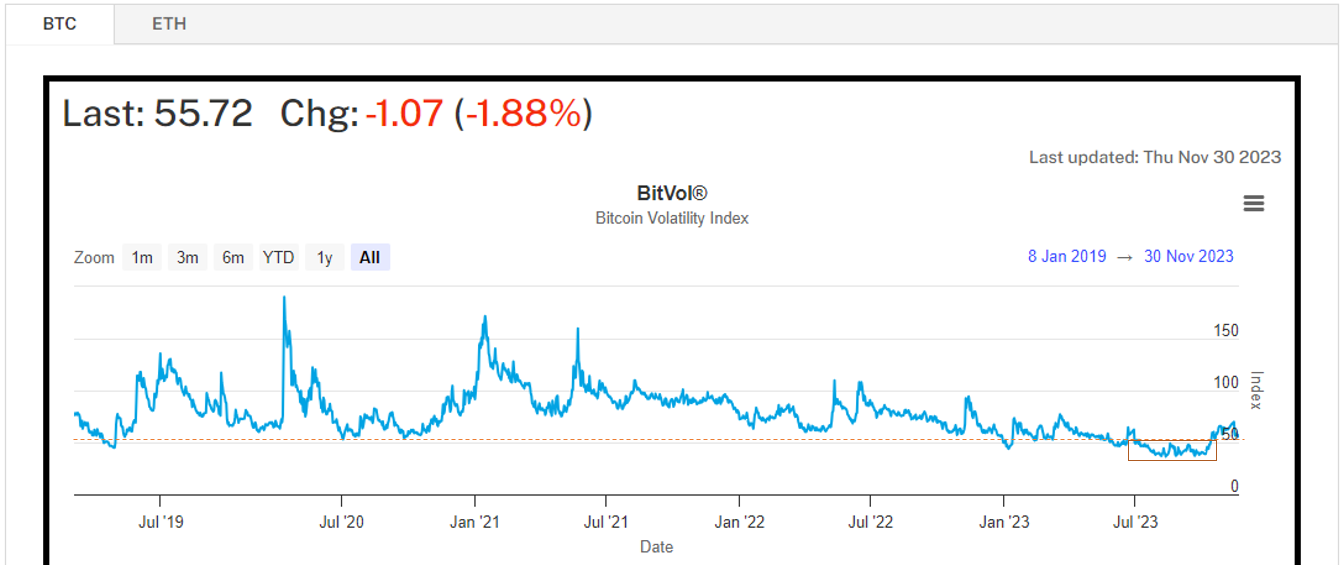
Data Sources:https://t3index.com/indexes/bit-vol/
Starting in July 2023, the Implied Volatility Index continued to fall, falling below a record low of 55, with average daily volatility only between 1.5% and 3%. This is a very challenging period for long volatility-based trend strategies, lasting about five months (150 days). However, since October 23, the market has ushered in a new dawn, and most trend strategies have begun to regain lost ground and entered an environment of rising volatility, bringing new opportunities to trend strategies.
Binance exchange opens new opportunities for copy trading and social media
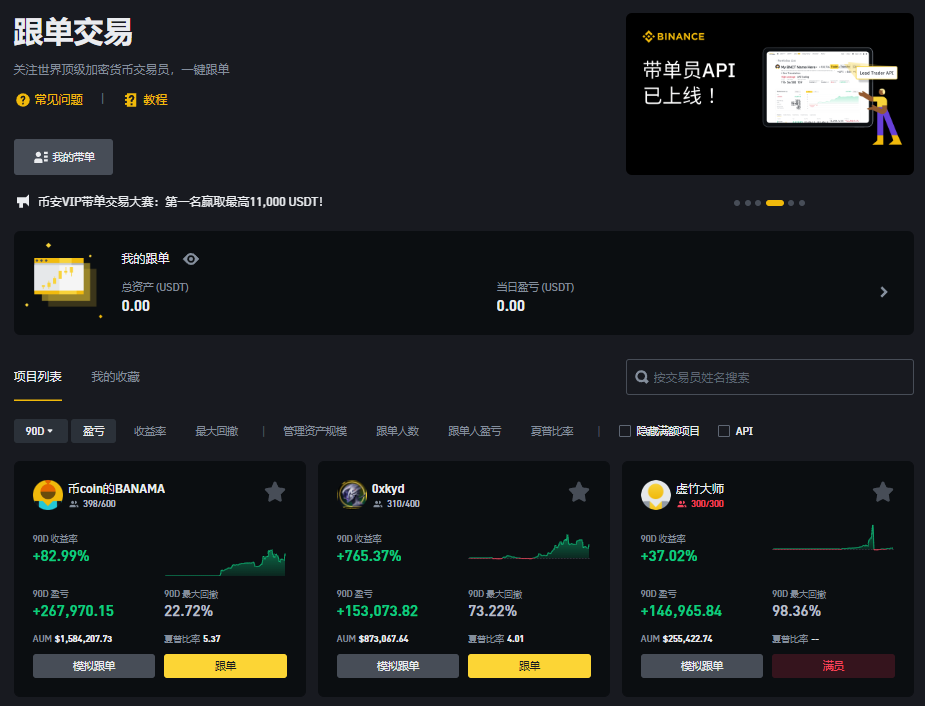
Binance Futures is about to launch a new copy trading function to maximize the benefits of your strategy!Starting from 14:45 on August 22, 2023 (Eastern Eighth District time), Binance Futures will gradually launch the copy trading function. As a strategy provider, you will have the opportunity to share your trading strategies and experiences for other users to follow and learn. By becoming a trader with orders, you will enjoy commission rebates and other exclusive rewards from copy traders. This means that your efforts and success will be greater recognized and rewarded, achieving a win-win situation for both parties.

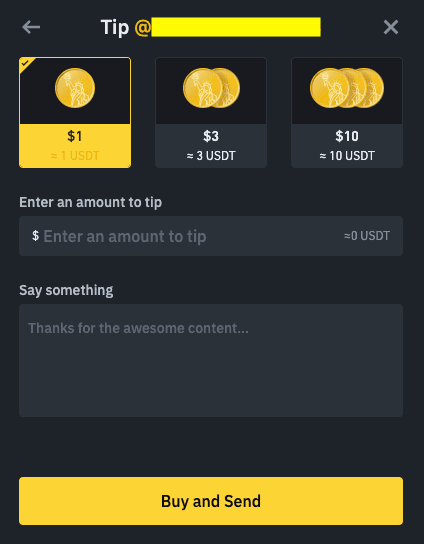
Binance launches a new social tipping feature, allowing you to become a creator and get rewards at the same time!On October 4, 2023, Binance introduced the Binance Feed social tipping function, bringing a new experience to users. Now, any user can become a content creator and share their insights and ideas with other users. Not only is this feature open to all users, it also adds an exciting new feature - the Tipping Function, which gives you the opportunity to reward creators who provide you with quality content. By using Binance Social Tips, you can express your gratitude and support to your favorite content creators. This not only recognizes the efforts of the creators, but also helps build closer community ties. You can choose an appropriate amount to tip so that creators can continue to produce valuable content and be rewarded for their efforts.

More and more trading platforms are beginning to develop in the direction of new media, providing strategists and content creators with more opportunities to leverage, maximize the returns they deserve for their efforts, and create a positive to cycle. The development of this positive cycle is also a win-win for the trading platform and users. The trading platform attracts more strategists and content creators by providing new media functions, increasing the attractiveness and user stickiness of the platform. At the same time, users can gain more trading insights and learning opportunities and improve their trading skills by following the trading strategies of strategists or consuming the works of content creators.
The Bitcoin halving is about 132 days away from today (2023.12.01)
Countdown to halving:https://www.nicehash.com/countdown/btc-halving-2024-05-10-12-00?_360safeparam=1289146171
Market technical and emotional environment analysis
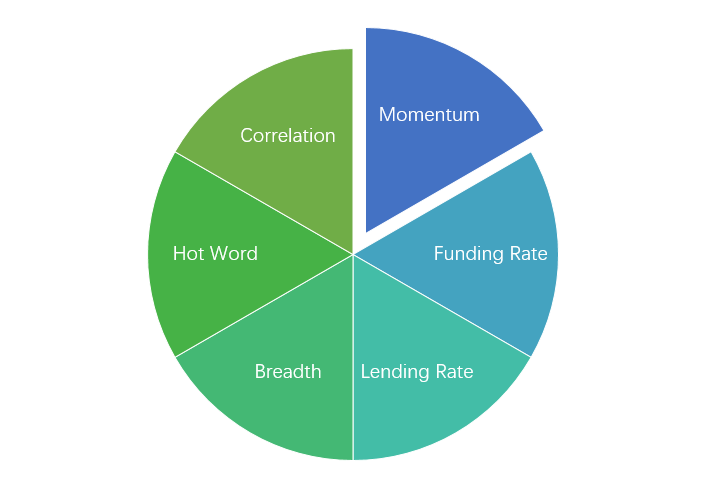
Sentiment analysis components
Technical indicators
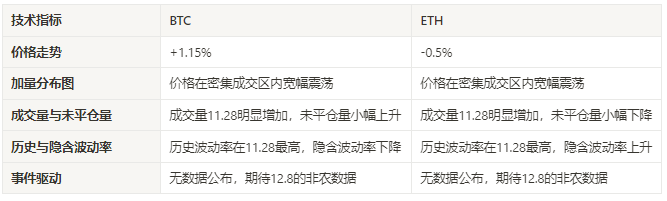
Price trend
BTC price increased by 1.15% over the past week, while ETH price fell by -0.5%.
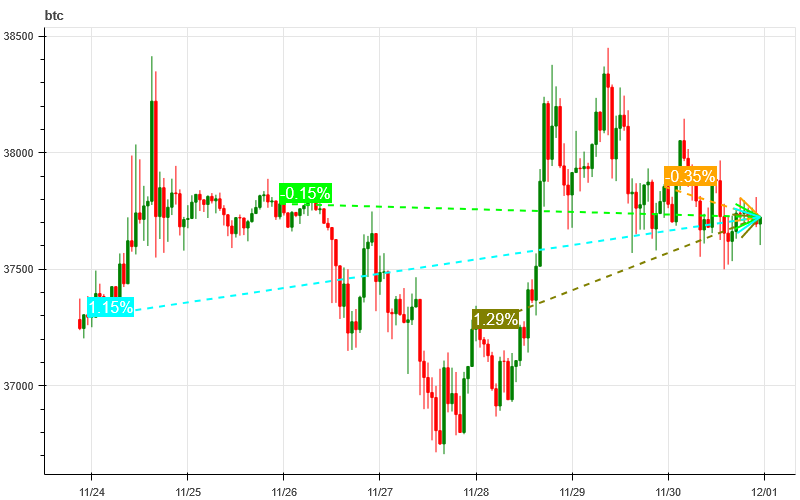
The picture above is the price chart of BTC over the past week
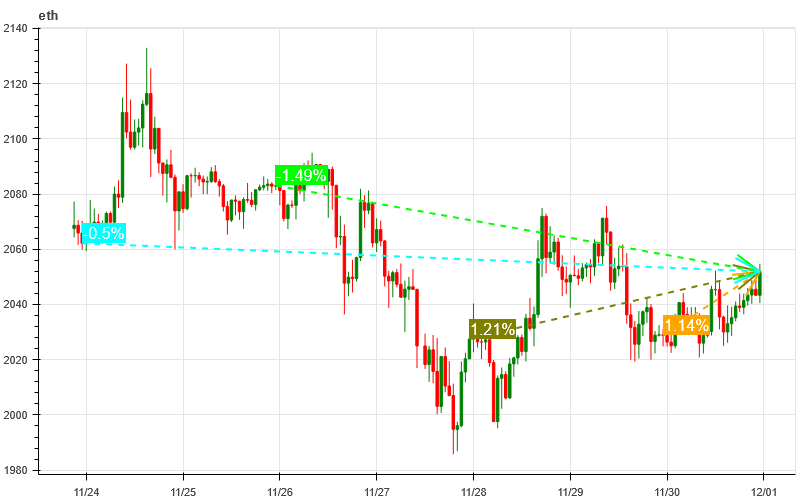
The picture above is the price chart of ETH over the past week
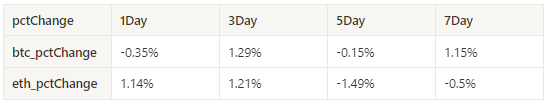
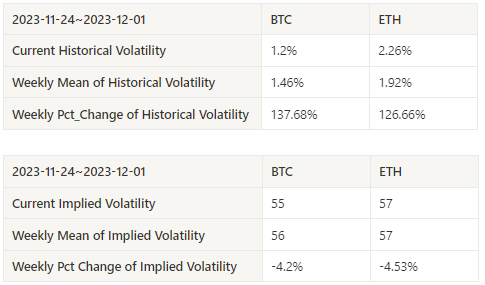
Table showing the rate of price change over the past week
Price and volume distribution chart (support and resistance)
The prices of BTC and ETH have fluctuated widely in intensive trading areas over the past week.
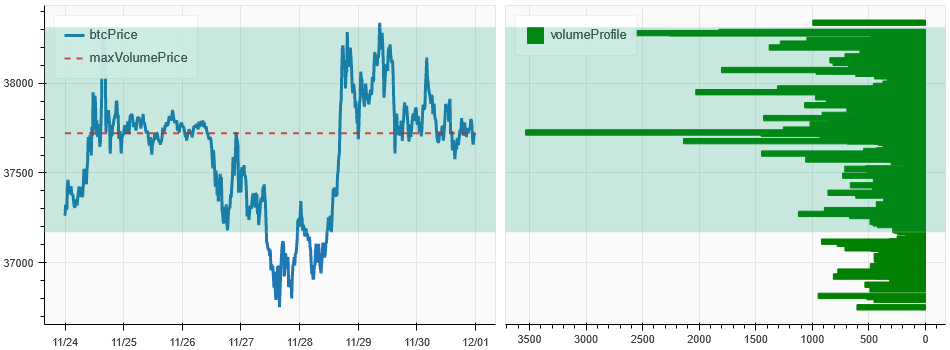
The picture above is the distribution map of BTC’s intensive trading areas in the past week.
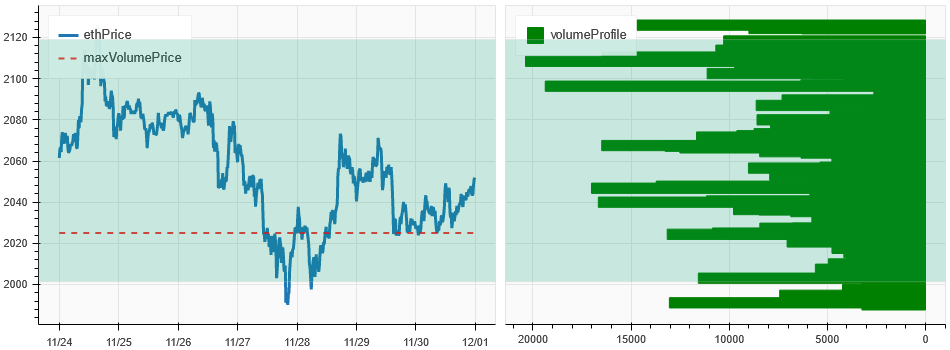
The picture above is the distribution map of ETH’s intensive trading areas in the past week.
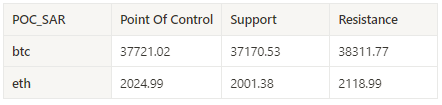
Table showing the intensive weekly trading ranges for BTC and ETH over the past week
Volume and Open Interest
In the past week, both BTC and ETH have seen a significant increase in rebound trading volume after falling from 11.28; the open interest of BTC increased slightly, while ETH decreased slightly.
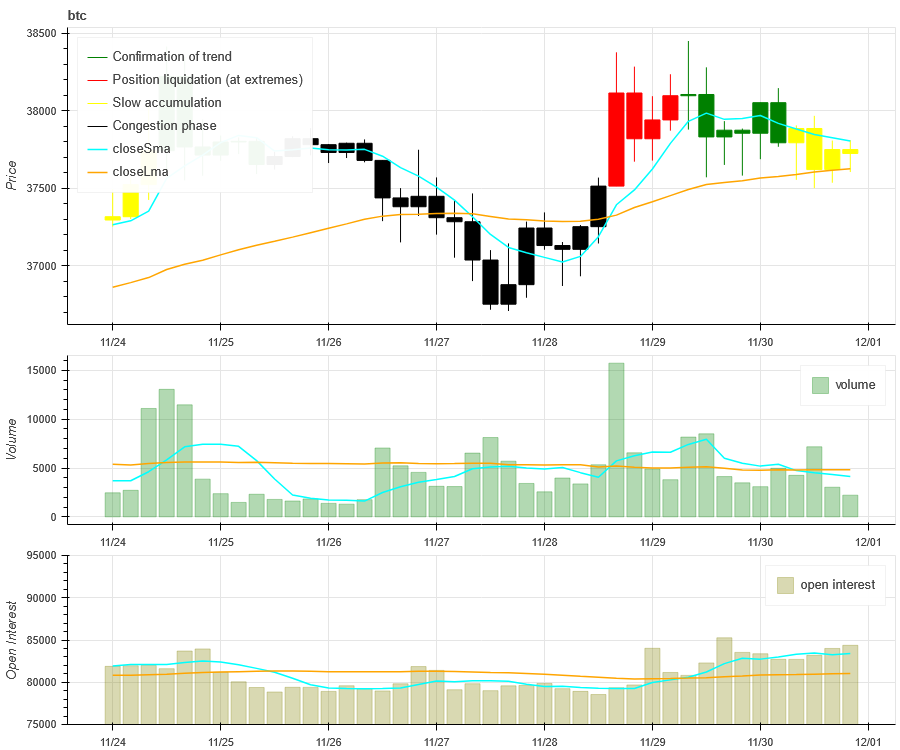
The price trend of BTC at the top of the picture above, the middle is the trading volume, the bottom is the open interest, the light blue is the 1-day average, and the orange is the 7-day average. The color of the K line represents the current status. Green means that the price rise is supported by trading volume, red means positions are being closed, yellow means positions are slowly accumulating, and black means congestion.
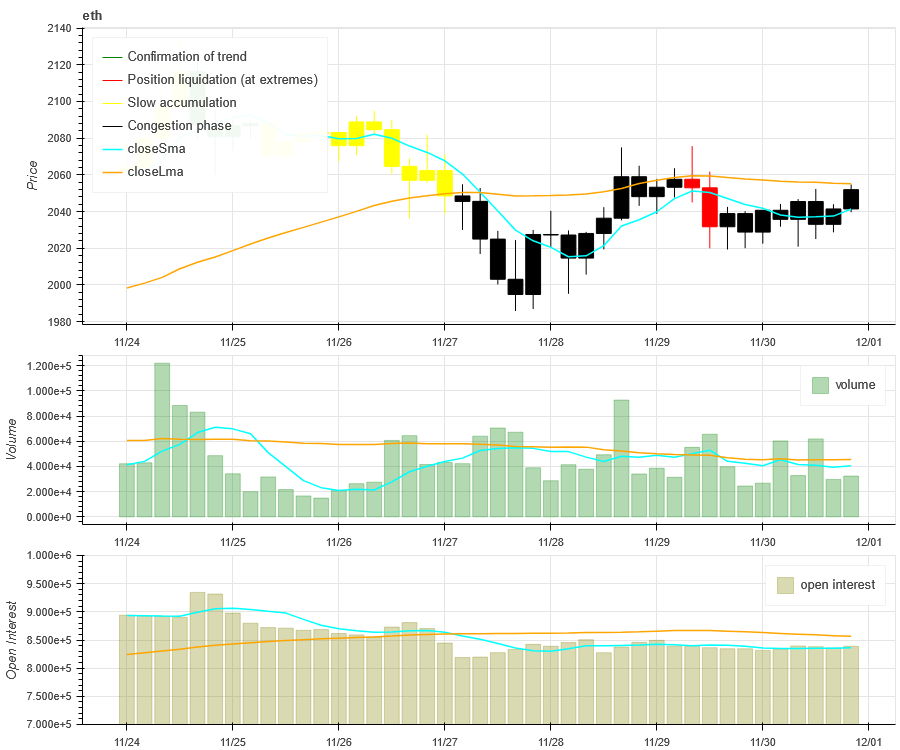
The price trend of ETH at the top of the picture above, the middle is the trading volume, the bottom is the open interest, the light blue is the 1-day average, and the orange is the 7-day average. The color of the K line represents the current status. Green means that the price rise is supported by trading volume, red means positions are being closed, yellow means positions are slowly accumulating, and black means congestion.
Historical Volatility vs. Implied Volatility
The historical volatility of BTC and ETH in the past week was the highest at 11.28, with the implied volatility of BTC falling and ETH rising.
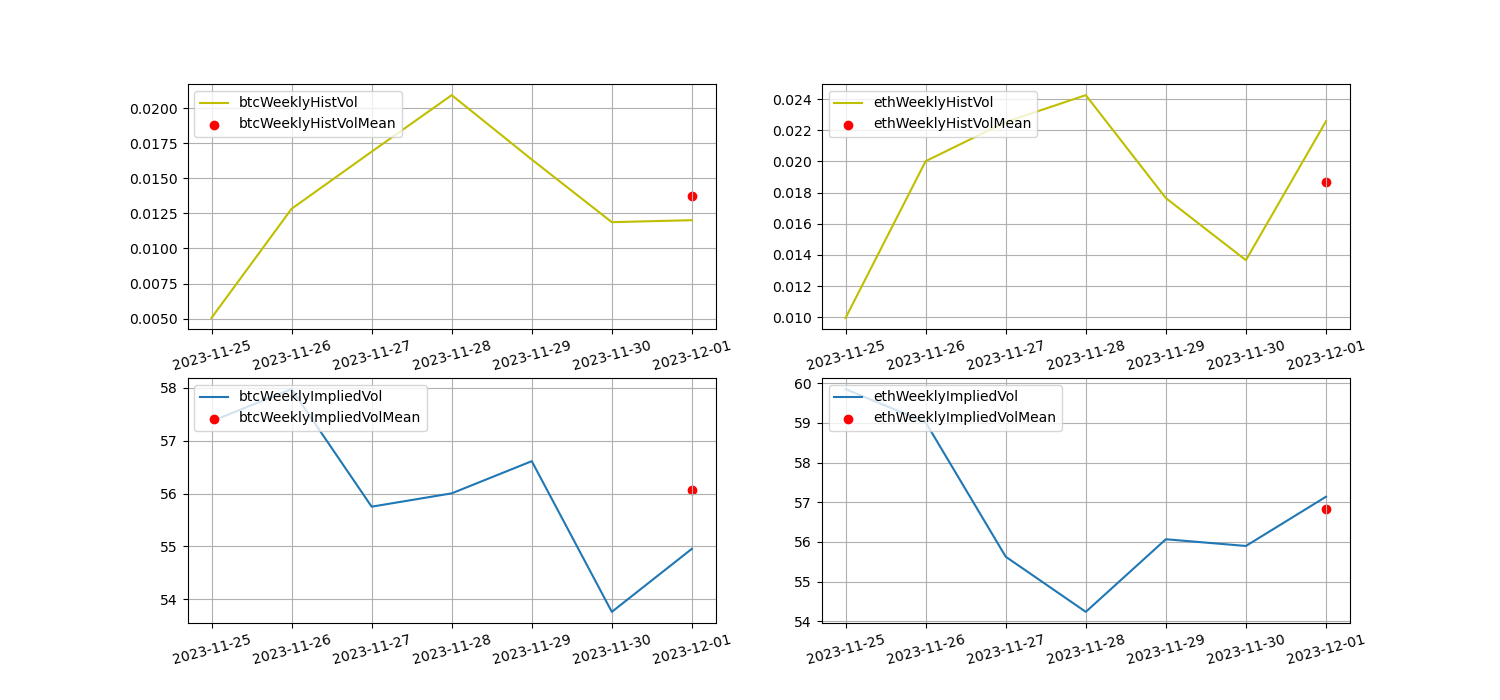
The yellow line is historical volatility, the blue line is implied volatility, and the red dot is its 7-day average
event driven
There is no data released this week, so look forward to the non-agricultural data tonight on 2023.12.01.
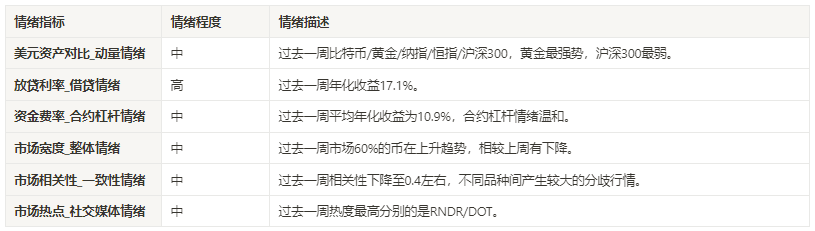
sentiment indicator
momentum sentiment
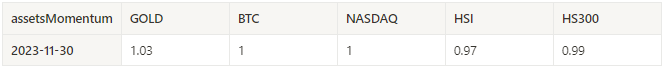
Among Bitcoin/Gold/Nasdaq/HSI/CSI 300, gold was the strongest in the past week, while the worst performer was CSI 300.
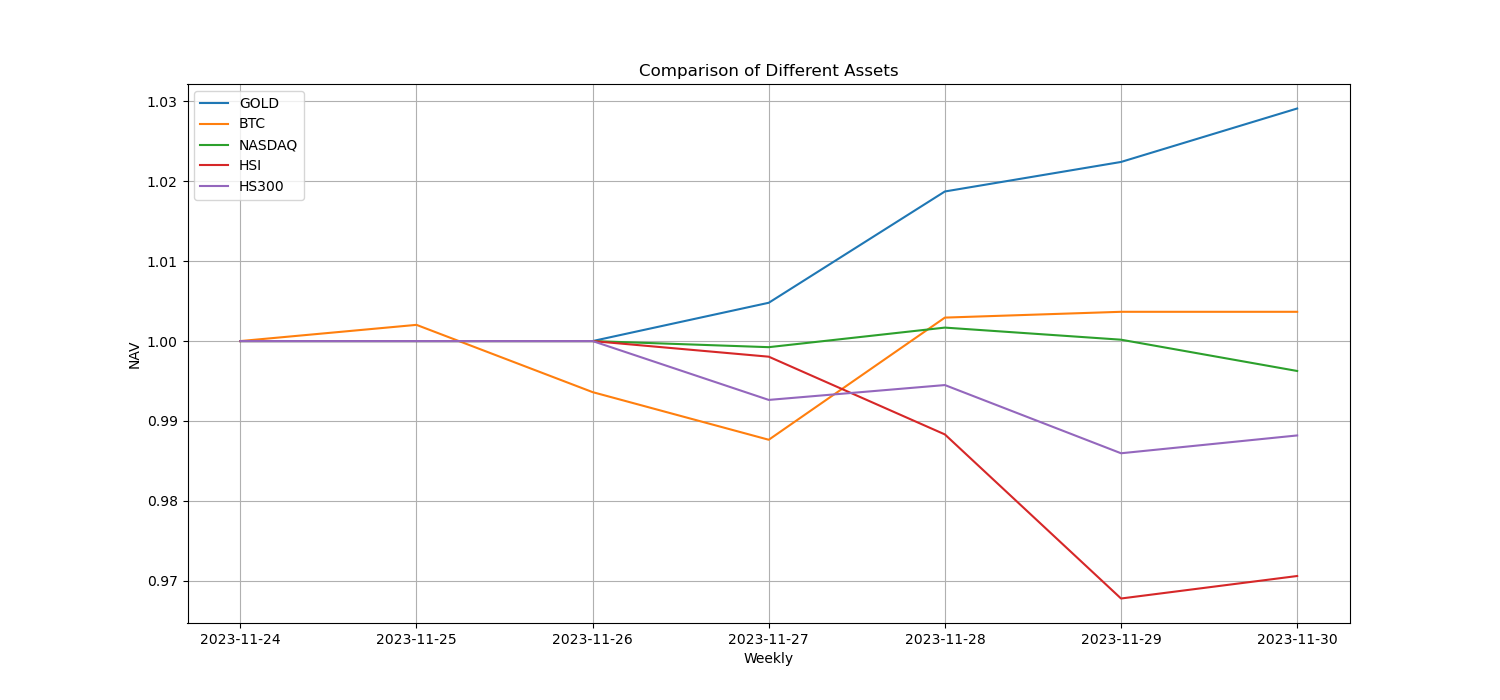
The picture above shows the trends of different assets over the past week.
Lending interest rate_Lending sentiment
The average annualized return on USD lending over the past week was 17.1%, with interest rates stable.
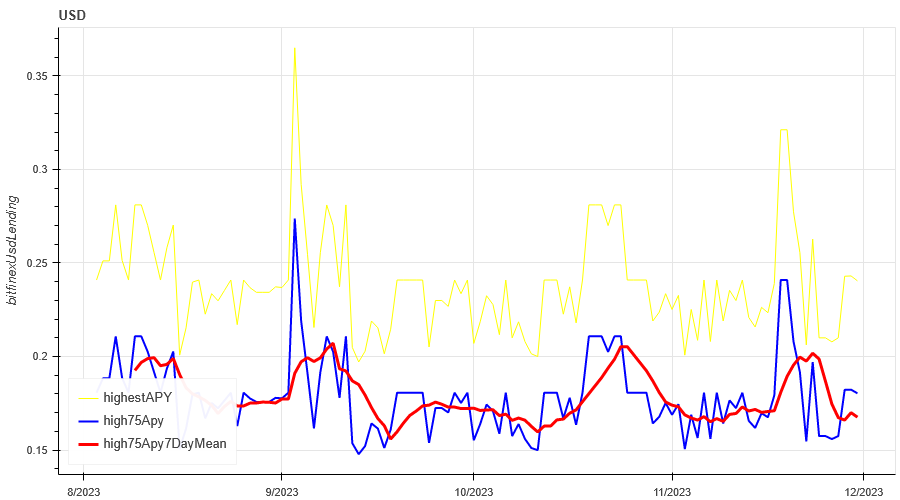
The yellow line is the highest price of the USD interest rate, the blue line is 75% of the highest price, and the red line is the 7-day average of 75% of the highest price
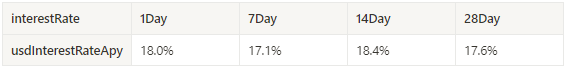
The table shows the average return of USD interest rate for different holding days in the past
Funding Rate_Contract Leverage Sentiment
The average annualized return on BTC tariffs in the past week was 10.9%, and contract leverage sentiment has fallen from highs.
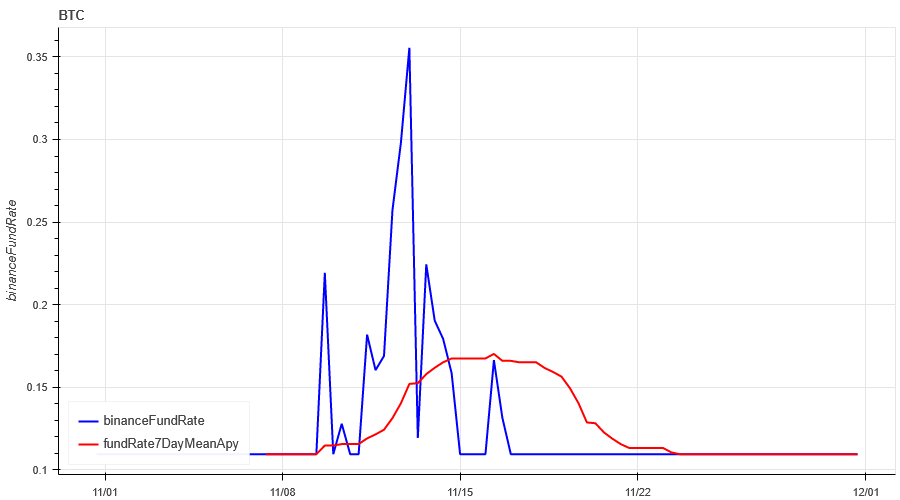
The blue line is the funding rate of BTC on Binance, and the red line is its 7-day average
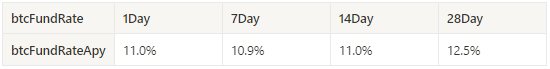
The table shows the average return of BTC fees for different holding days in the past
Market Breadth_Overall Sentiment
60% of the 46 coins selected in the past week were above the 30-day moving average, a decrease compared to last week.
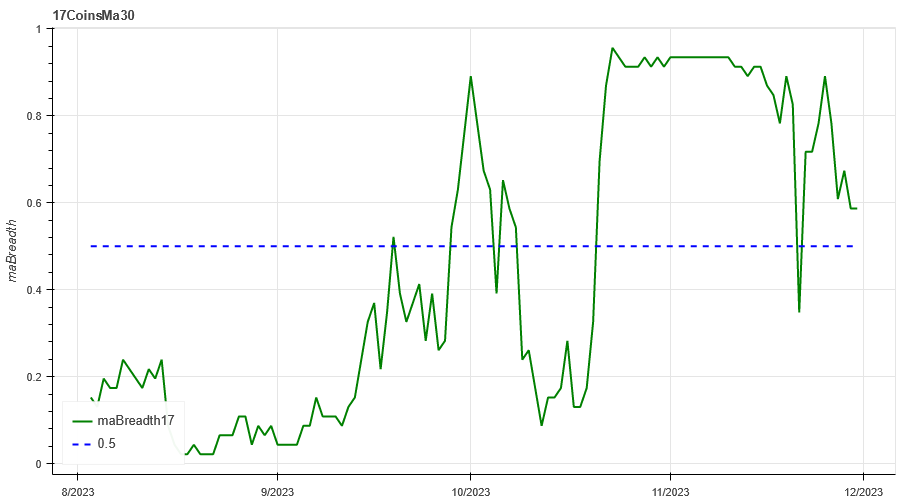
The picture above is [btc, eth, bnb, ltc, bch, doge, matic, sol,link,uni, enj,gala , mana, axs, dydx, fet ,gmx, xlm, xrp, ada, trx, sol, dot, avax, shib, atom, xmr, etc, ldo, hbar, apt, vet, qnt, vet,crv, aave, algo , ftm, ape, neo, sand, eos, xtz, rndr, theta, mkr] proportion above the 30-day moving average
Market Correlation_Consistent Sentiment
Among the 46 coins selected in the past week, the correlation dropped to around 0.4, resulting in large divergence of prices among different varieties.
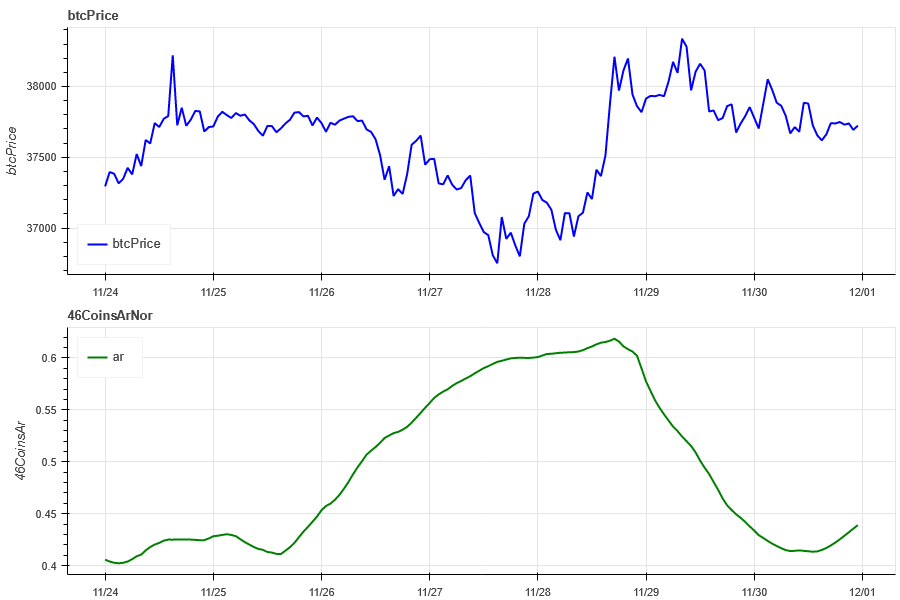
The blue line in the above picture first shows the Bitcoin price, and the green line is [btc, eth, bnb, ltc, bch, doge, matic, sol, link, uni, enj,gala, mana, axs, dydx, fet ,gmx, xlm, xrp, ada, trx, sol , dot, avax, shib, atom, xmr, etc, ldo, hbar, apt, vet, qnt, vet, crv, aave, algo, ftm, ape, neo, sand, eos, xtz, rndr, theta, mkr] overall Correlation
Market Hotspots_Social Media Sentiment
The most popular pair in the past week is RNDR/DOT.
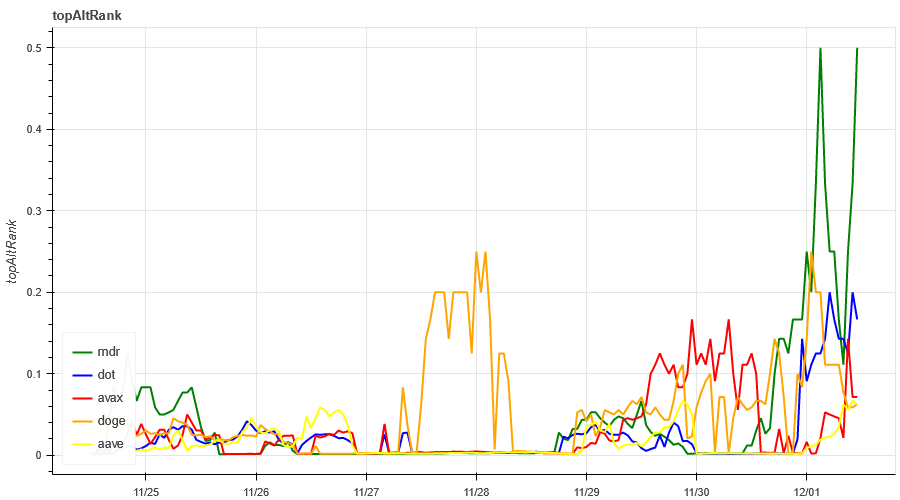
Data Sources:https://lunarcrush.com/categories/cryptocurrencies
Summarize
The market has not yet experienced a sustained rise this week, but continues to fluctuate at a high level. The implied volatility of BTC has decreased this week, and ETH has increased. In terms of price trends, BTC continues to fluctuate at a high level, while the ETH price continues to face the pressure of previous highs. Pressure; in terms of hot spots, RNDR and DOT have been relatively high recently and can be focused on; in terms of events, we need to pay attention to the non-agricultural data of 12.8.
Twitter: @DerivativesCN
Website: https://dcbot.ai/


