
Crypto Market Sentiment Research Report (11.17–11.26): CZ admits the charges, currency prices remain strong
CZ admits charges, currency price remains strong
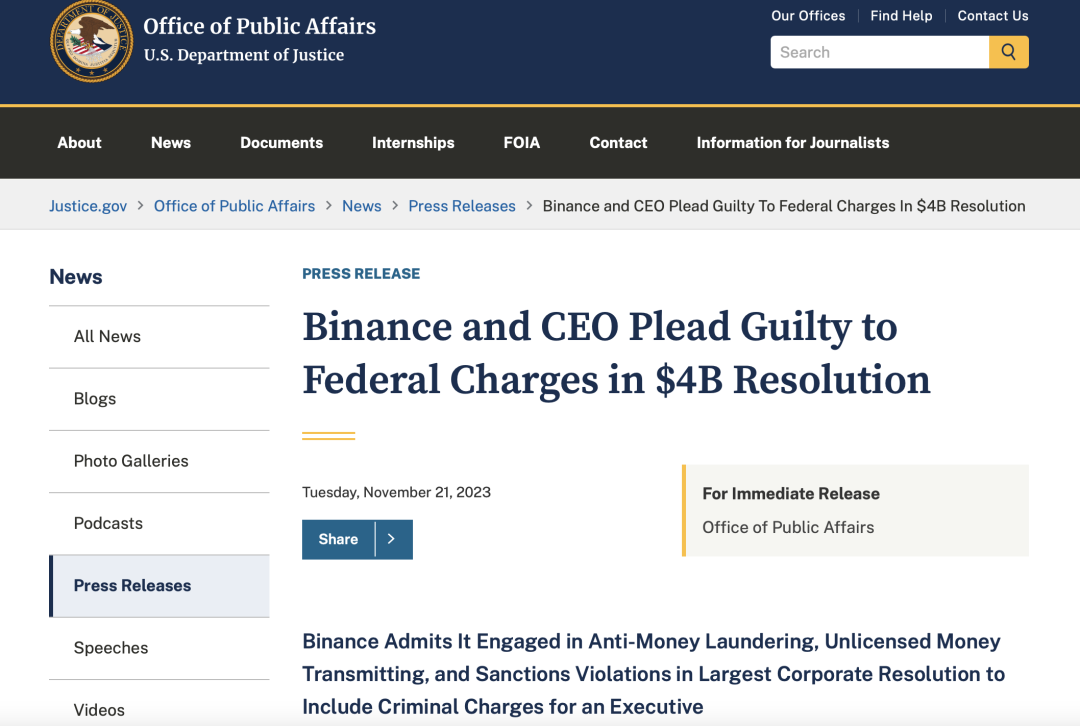
On Tuesday, November 21, local time in the United States, Binance and its CEO CZ pleaded guilty to criminal charges of anti-money laundering and violation of U.S. sanctions, and reached a settlement with U.S. regulators and paid a fine of more than $4 billion. This settlement case not only demonstrates the importance that regulators attach to ensuring transparency and compliance in financial markets, but also serves as a wake-up call to other centralized exchanges.
So far, supervision has extended its hand to large centralized exchanges such as FTX and Binance, imposing large financial penalties and even imprisonment for violations such as misappropriation of customer assets, money laundering, and financial cybercrime. This action of the regulatory agency has sent a message to the industry. A clear signal: Any violations will be severely punished. These measures are not only to protect the rights and interests of investors, but also to maintain the stability and sustainable development of the entire crypto market. Therefore, compliance will be what all current exchanges must face if they want to go further.
After experiencing barbaric growth, the blockchain industry is currently showing an obvious polarization trend: compliance is becoming more and more compliant, and decentralization is becoming more and more vigorous. In terms of compliance, exchanges such as Coinbase and Hashkey are regulated by local laws, and the establishment of ETFs will allow institutional funds to safely participate in cryptocurrency investments in the long term. In terms of decentralization, the rapid rise of the BTC ecosystem, the healthy development of the ETH ecosystem, the Phoenix Nirvana of the SOL ecosystem, and the constantly innovative decentralized technology and business models indicate that the future will continue to usher in vigorous development, and BTC, ETH, SOL prices remain strong.
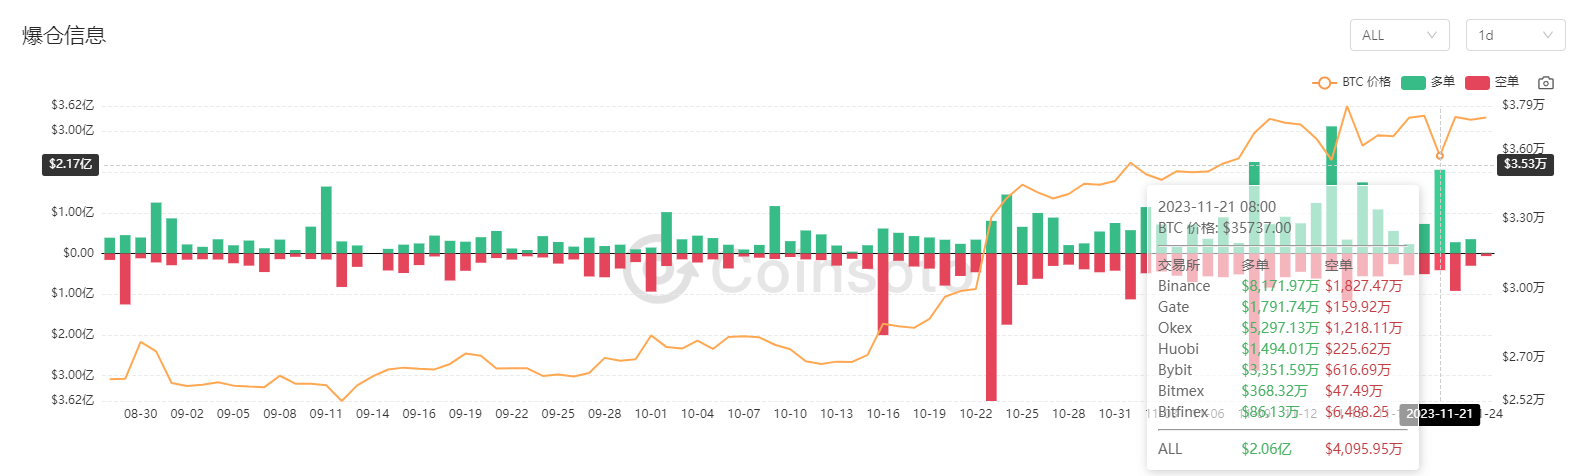
Data Sources:https://coinsoto.com/zh/liquidation
On November 21, 2023, due to the CZ incident, the market fell sharply in a short period of time, causing a large long position of 200 million to be liquidated, and the price subsequently rebounded and rose.
Bitcoin halving is about 152 days away from today (2023.11.24)
Countdown to halving:https://www.nicehash.com/countdown/btc-halving-2024-05-10-12-00?_360safeparam=1289146171
Market technical and emotional environment analysis
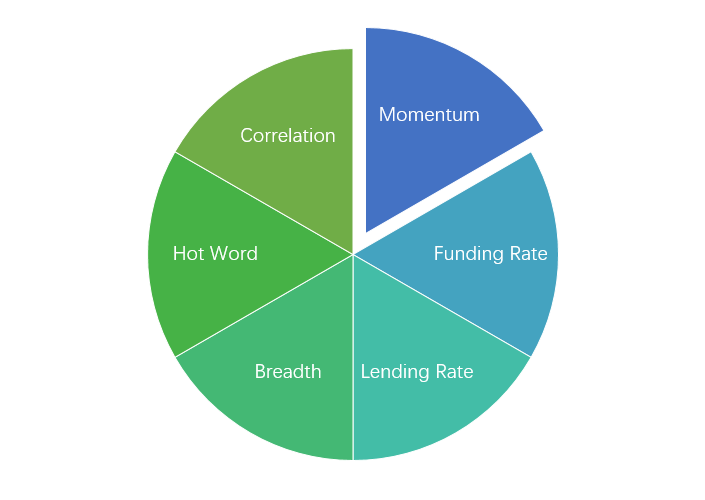
Sentiment analysis components

Technical indicators
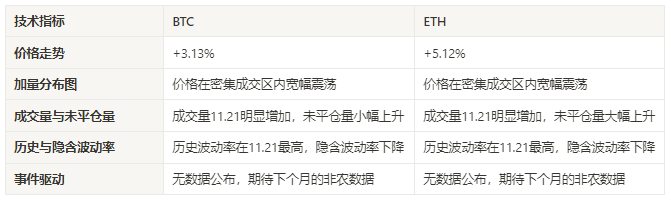
Price trend
BTC price increased by 3.13% and ETH price increased by 5.12% in the past week.
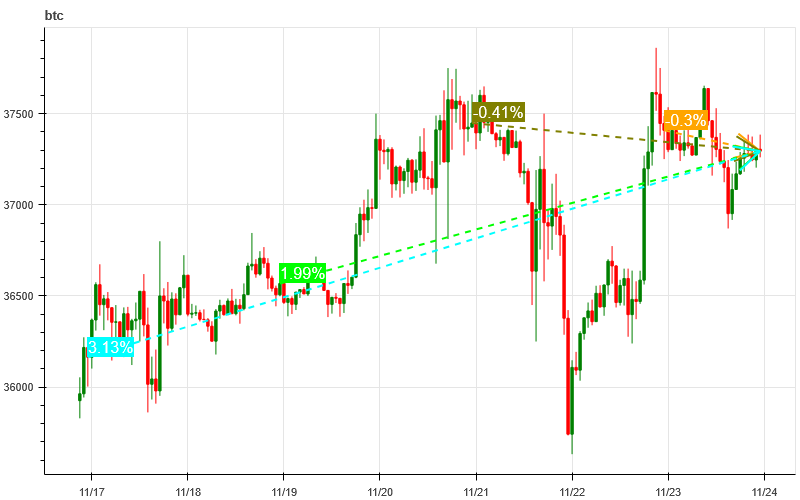
The picture above is the price chart of BTC over the past week
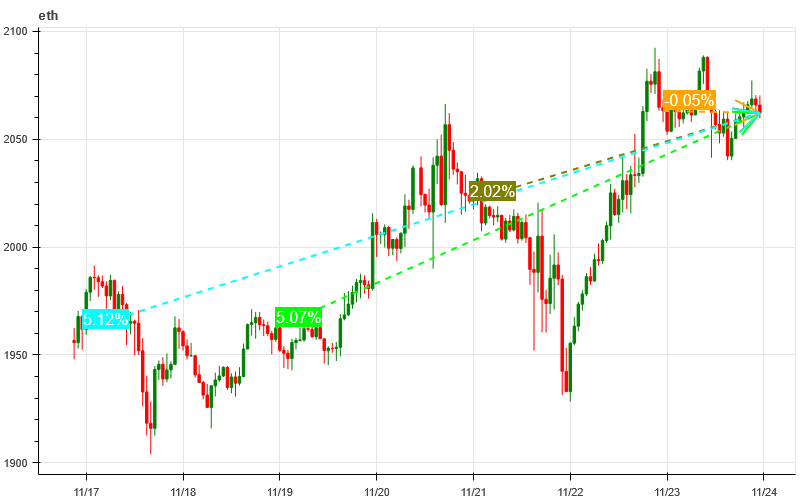
The picture above is the price chart of ETH over the past week
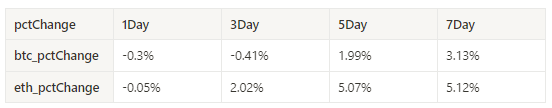
Table showing the rate of price change over the past week
Price and volume distribution chart (support and resistance)
In the past week, the prices of BTC and ETH have fluctuated widely in the intensive trading area, with large trading volumes changing hands at low levels.
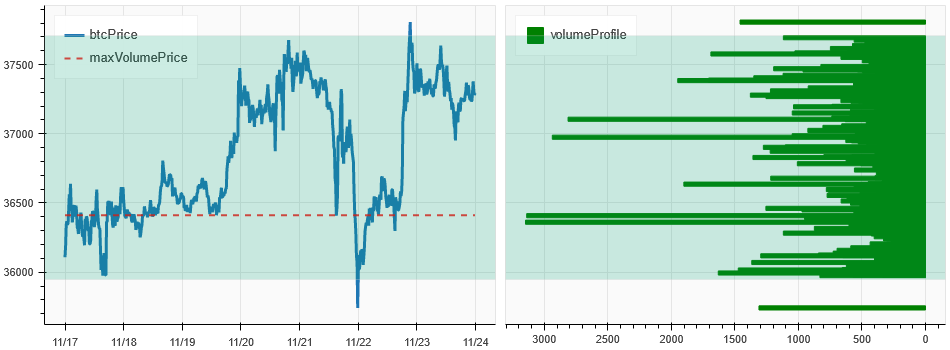
The picture above is the distribution map of BTC’s intensive trading areas in the past week.
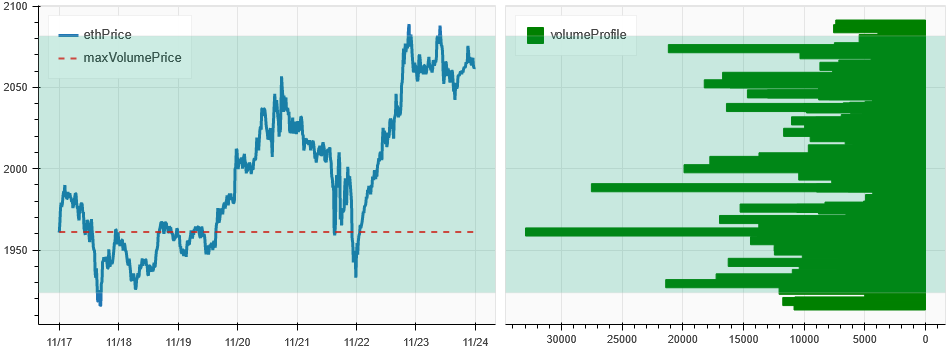
The picture above is the distribution map of ETH’s intensive trading areas in the past week.
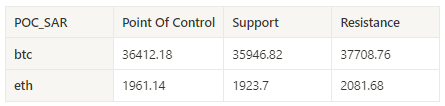
Table showing the intensive weekly trading ranges for BTC and ETH over the past week
Volume and Open Interest
In the past week, both BTC and ETH have seen a significant increase in trading volume after the news of 11.21 CZ; open interest in BTC increased slightly, while ETH increased significantly.
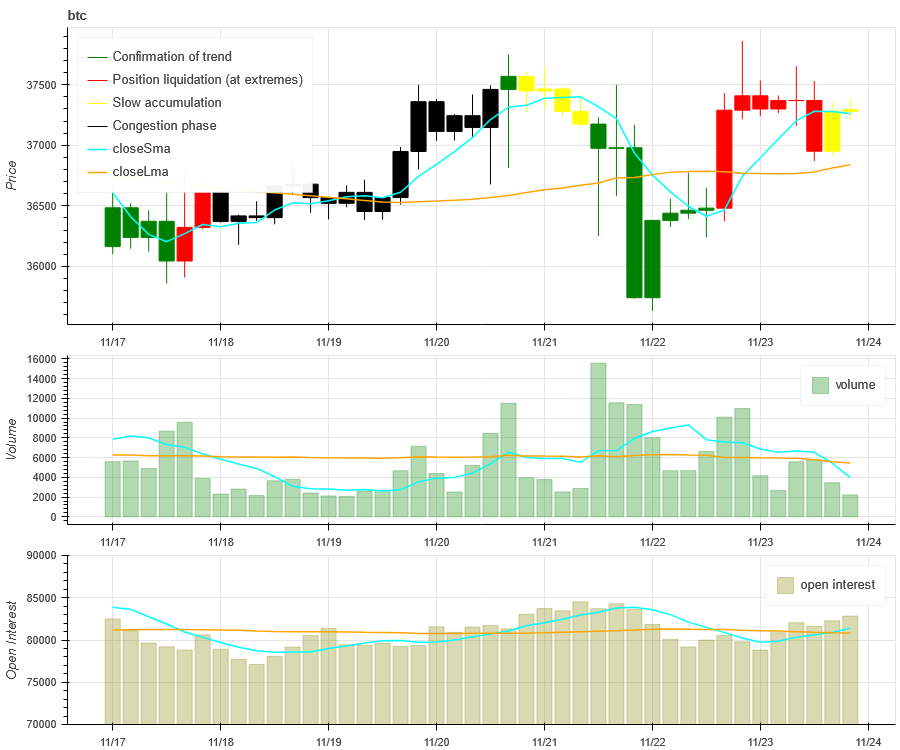
The price trend of BTC at the top of the picture above, the middle is the trading volume, the bottom is the open interest, the light blue is the 1-day average, and the orange is the 7-day average. The color of the K line represents the current status. Green means that the price rise is supported by trading volume, red means positions are being closed, yellow means positions are slowly accumulating, and black means congestion.
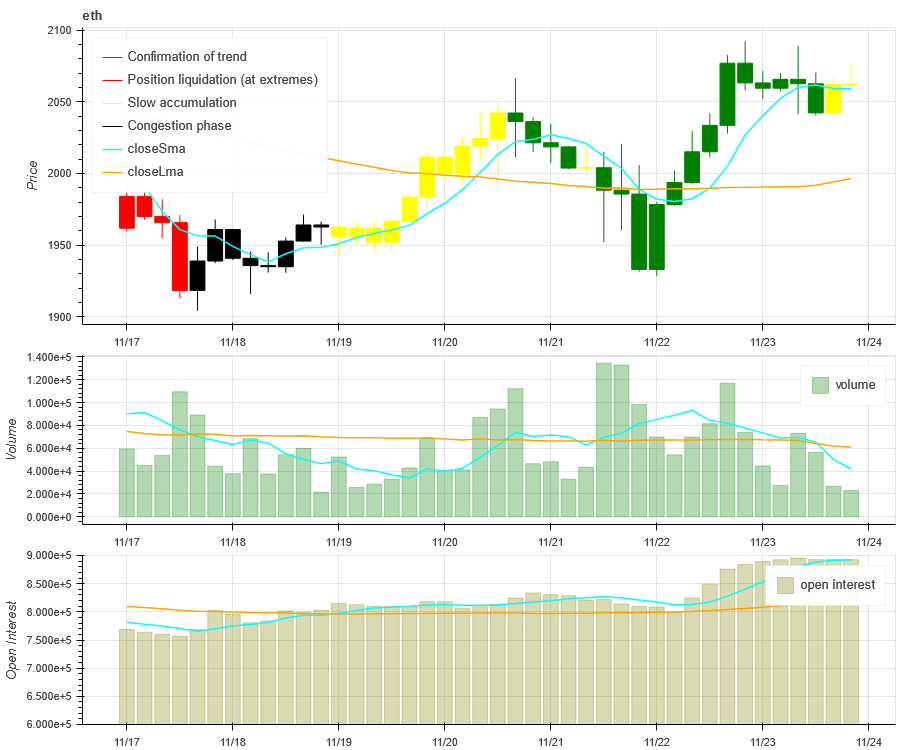
The price trend of ETH at the top of the picture above, the middle is the trading volume, the bottom is the open interest, the light blue is the 1-day average, and the orange is the 7-day average. The color of the K line represents the current status. Green means that the price rise is supported by trading volume, red means positions are being closed, yellow means positions are slowly accumulating, and black means congestion.
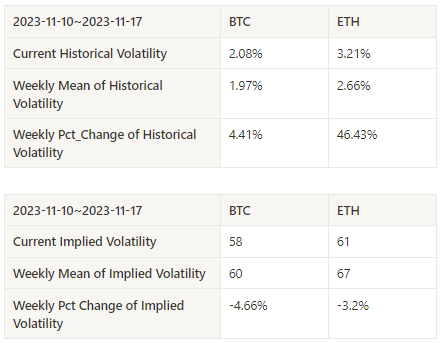
Historical Volatility vs. Implied Volatility
The historical volatility of BTC and ETH in the past week was the highest at 11.21, and the overall implied volatility decreased.
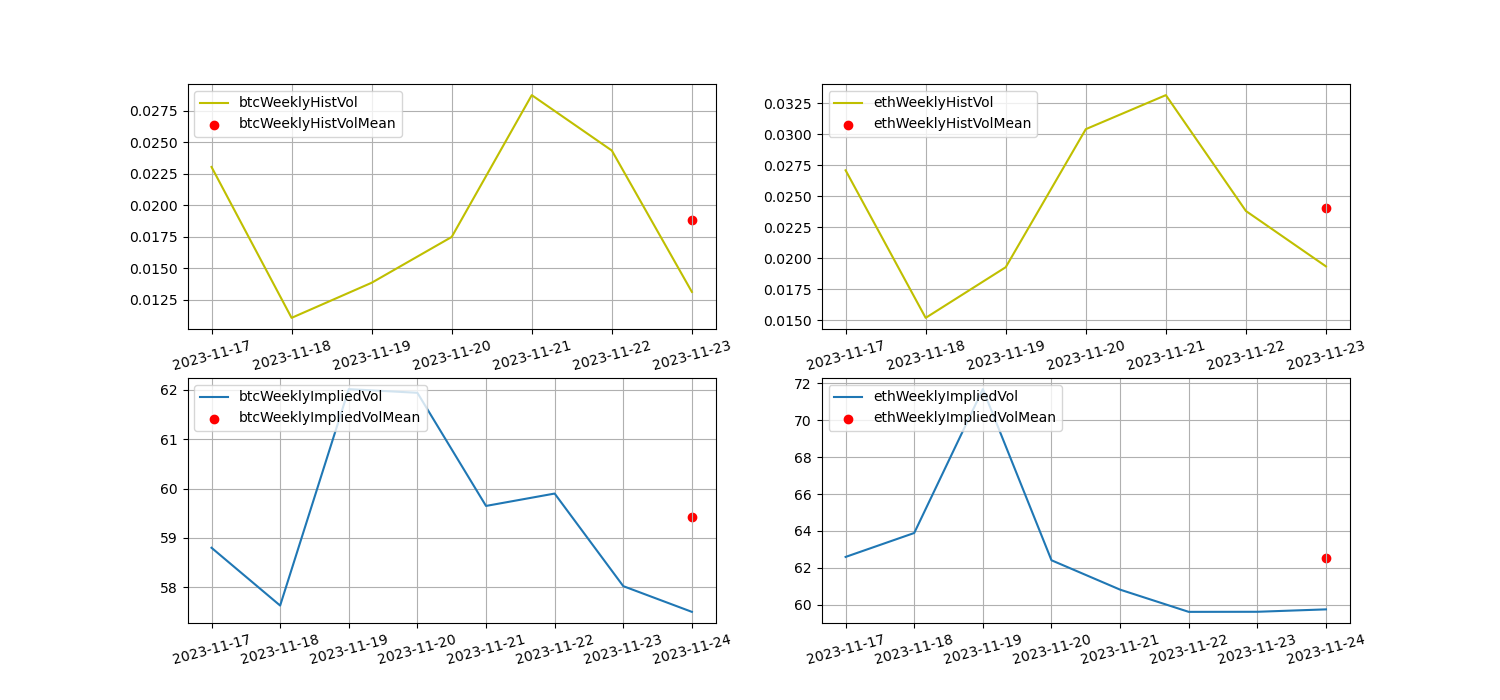
The yellow line is historical volatility, the blue line is implied volatility, and the red dot is its 7-day average
event driven
There is no data released this week, and we are looking forward to next month’s non-agricultural data on 2023.12.01.
sentiment indicator
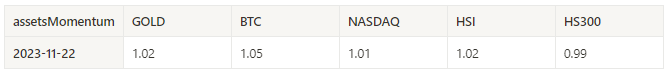
momentum sentiment
Among Bitcoin/Gold/Nasdaq/HSI/CSI 300, BTC was the strongest in the past week, while the worst performer was CSI 300.
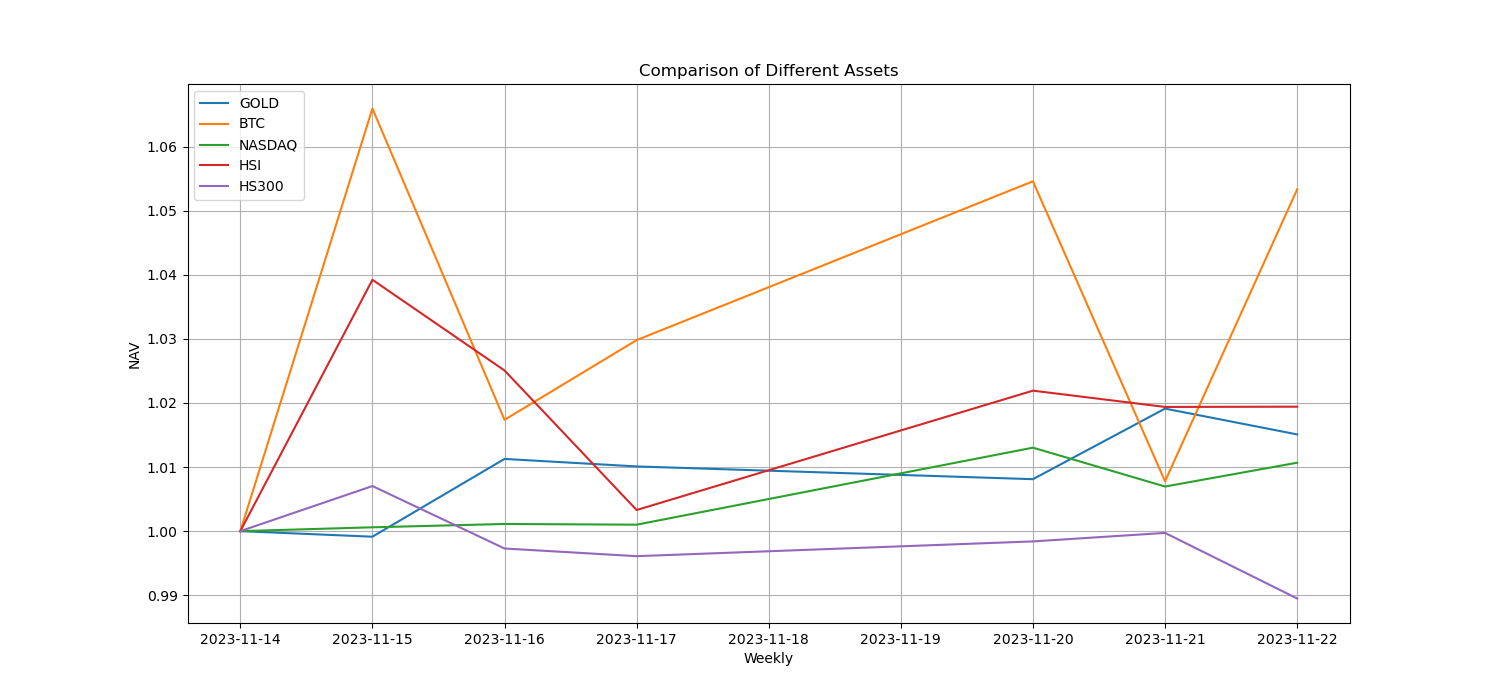
The picture above shows the trends of different assets over the past week.
Lending interest rate_Lending sentiment
The average annualized return on USD lending over the past week was 19.8%, with interest rates stable.
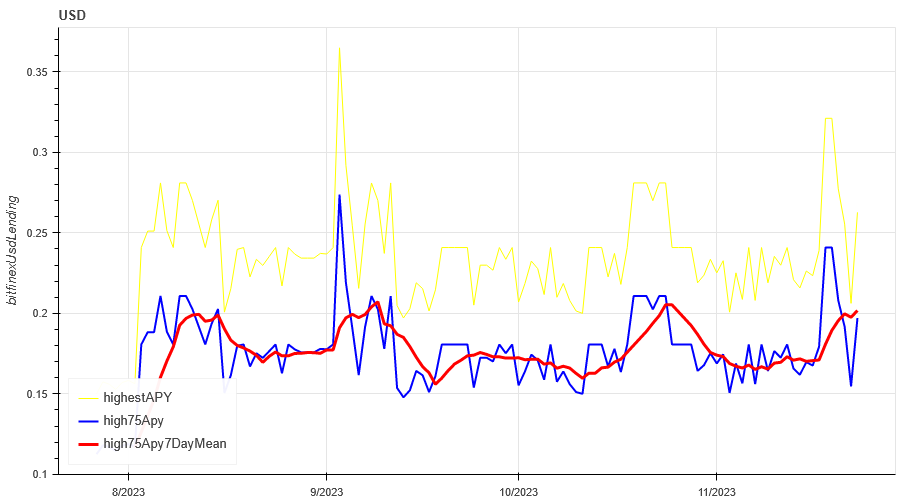
The yellow line is the highest price of the USD interest rate, the blue line is 75% of the highest price, and the red line is the 7-day average of 75% of the highest price
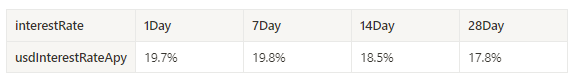
The table shows the average return of USD interest rate for different holding days in the past
Funding Rate_Contract Leverage Sentiment
The average annualized return on BTC tariffs in the past week was 11.3%, and contract leverage sentiment has fallen from highs.
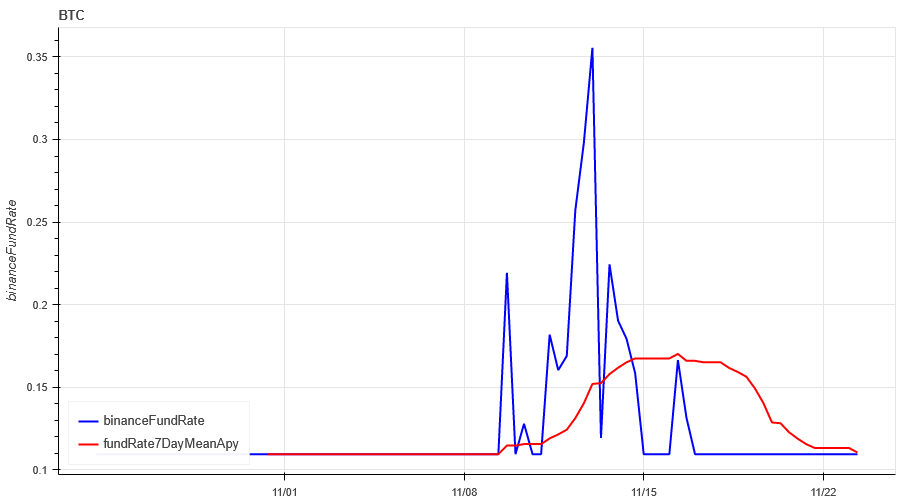
The blue line is the funding rate of BTC on Binance, and the red line is its 7-day average
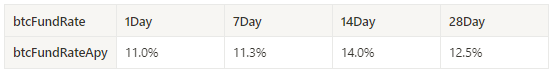
The table shows the average return of BTC fees for different holding days in the past
Market Breadth_Overall Sentiment
70% of the 46 coins selected in the past week are above the 30-day moving average, and most of the coins in the market have returned to the upward trend after rebounding from the decline.
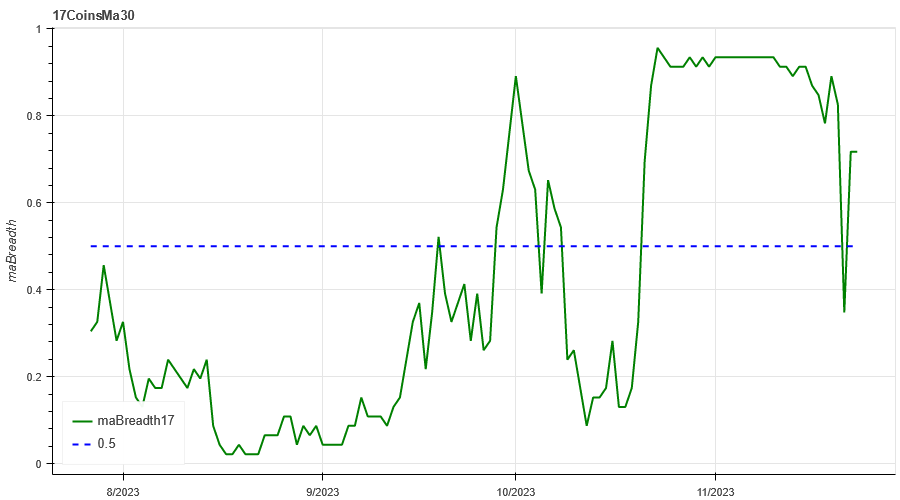
The picture above is [btc, eth, bnb, ltc, bch, doge, matic, sol,link,uni, enj,gala , mana, axs, dydx, fet ,gmx, xlm, xrp, ada, trx, sol, dot, avax, shib, atom, xmr, etc, ldo, hbar, apt, vet, qnt, vet,crv, aave, algo , ftm, ape, neo, sand, eos, xtz, rndr, theta, mkr] proportion above the 30-day moving average
Market Correlation_Consistent Sentiment
Among the 46 coins selected in the past week, the correlation dropped to around 0.4, resulting in large divergence of prices among different varieties.
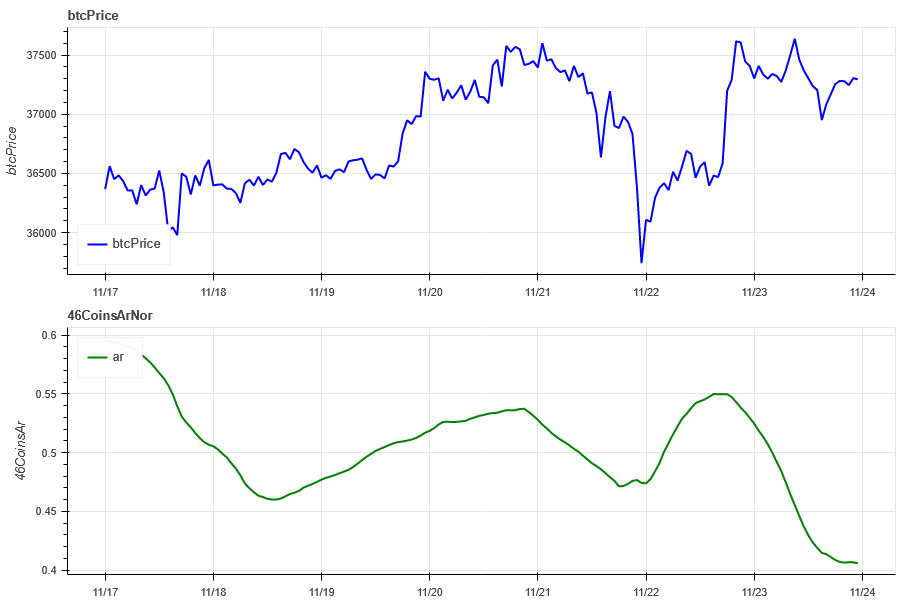
The blue line in the above picture first shows the Bitcoin price, and the green line is [btc, eth, bnb, ltc, bch, doge, matic, sol, link, uni, enj,gala, mana, axs, dydx, fet ,gmx, xlm, xrp, ada, trx, sol , dot, avax, shib, atom, xmr, etc, ldo, hbar, apt, vet, qnt, vet, crv, aave, algo, ftm, ape, neo, sand, eos, xtz, rndr, theta, mkr] overall Correlation
Market Hotspots_Social Media Sentiment
The most popular one in the past week is UNI/ADA. The negative news about centralized exchanges has benefited the decentralized UNI.
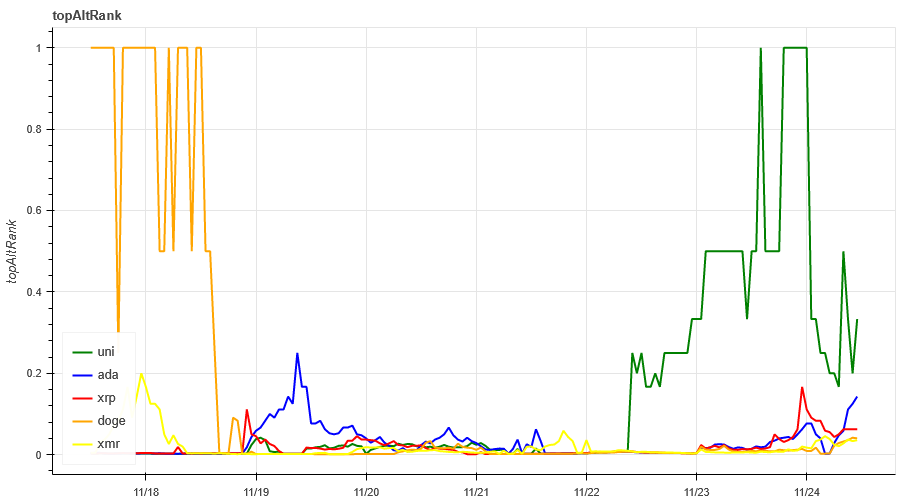
Data Sources:https://lunarcrush.com/categories/cryptocurrencies
Summarize
The market did not continue to rise this week, but fluctuated widely at a high level. The implied volatility of both BTC and ETH declined this week; in terms of price trends, BTC continued to fluctuate at a high level, while the ETH price also faced the decline from the previous high. Pressure; In terms of hot spots, UNI and ADA have recently been relatively high, so you can focus on them; in terms of events, the sudden CZ news event caused short-term violent fluctuations in the market. BTC and ETH rebounded quickly after experiencing a sharp decline and remained in an upward trend.
Twitter: @DerivativesCN
Website: https://dcbot.ai/


