
LD Capital Weekly Report (9.18): Will the market remain bearish until the end of the year? What is the core of market game?

Last weeks inflation report, which had both hawks and doves in mind, is not expected to significantly change the Feds policy bias, as evidenced by a modest rise in bond yields. The SP 500 and Nasdaq Composite fell for a second consecutive week, down 0.2% and 0.4% respectively. The main losses occurred on Friday (the biggest one-day decline in three weeks), after which the stock market sentiment was relatively positive.
The direct trigger was the UAW auto unions strike on Friday, which was the first time in the unions 88-year history that it had attacked the three major automakers simultaneously.
And the Philadelphia Semiconductor Index fell 3% on Friday, with reports that TSMC will delay the delivery of equipment to its factory in Arizona due to caution about the demand outlook; software company Adobes financial report exceeded expectations but unexpectedly fell sharply on Friday, also This led to investors taking a more cautious attitude toward technology stocks overall on Friday. Shares of popular chip designer Arm fell 4.5% on Friday after a 25% jump in its IPO on Thursday.
Rising oil prices have intensified the pessimism. Oil prices have exceeded US$90 per barrel, setting a new high for the year. WTI rose 3.5% and Brent rose 3.8% throughout the week.
Meanwhile, rising U.S. Treasury yields continued to weigh on stocks, with the 10-year Treasury yield climbing to 4.32%.
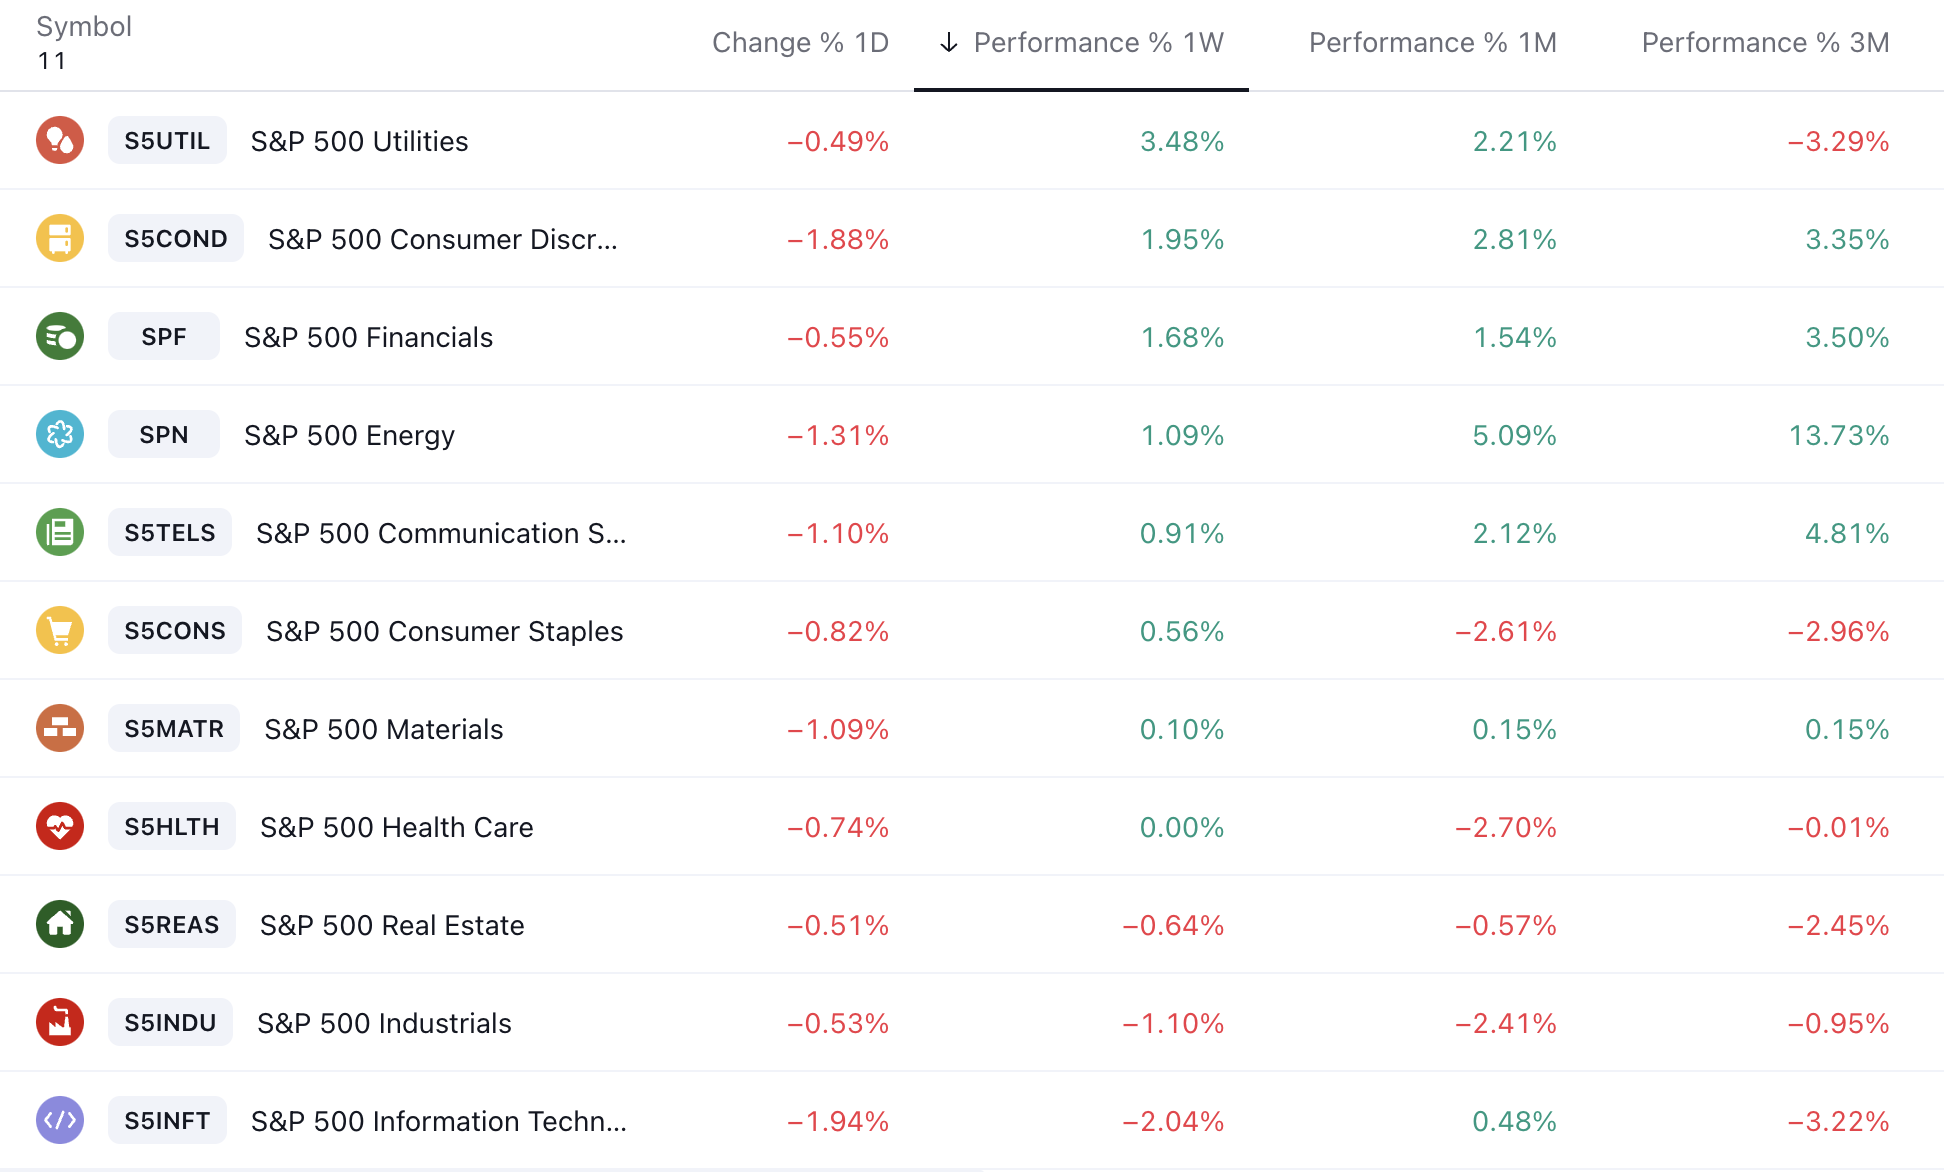
In terms of industry sectors, utilities +3.5%, consumer discretionary +2%, and finance +1.7% were the strongest performers throughout the week, while industry -1.1% and information technology -2% were the weakest performers:
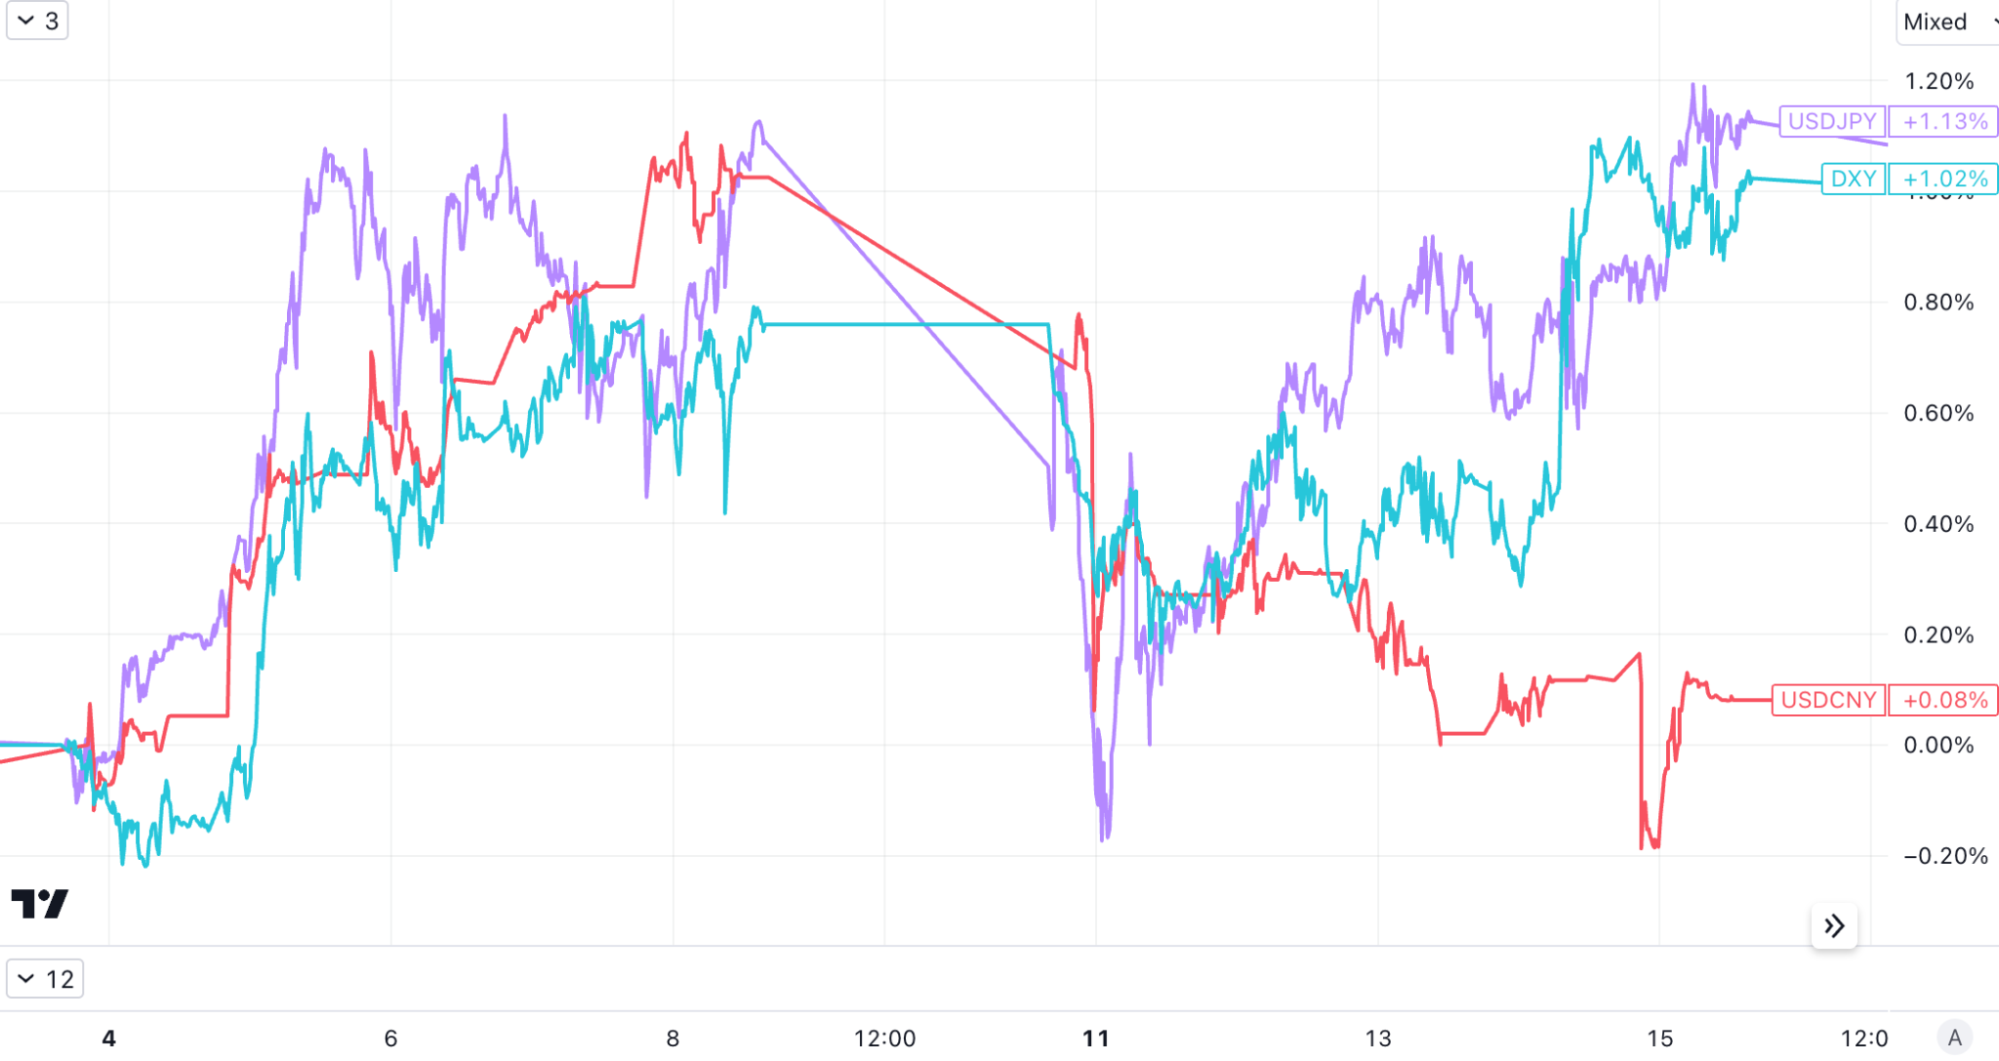
In the exchange rate market, the U.S. dollar index first fell and then rose, rising for the ninth consecutive week, refreshing the highest level since March; against the Japanese yen, it once hit 148, refreshing the highest level since November last year; however, the RMB performed strongly in the past week, and USDCNY once fell to 7.25, a refresh New lows in early August:
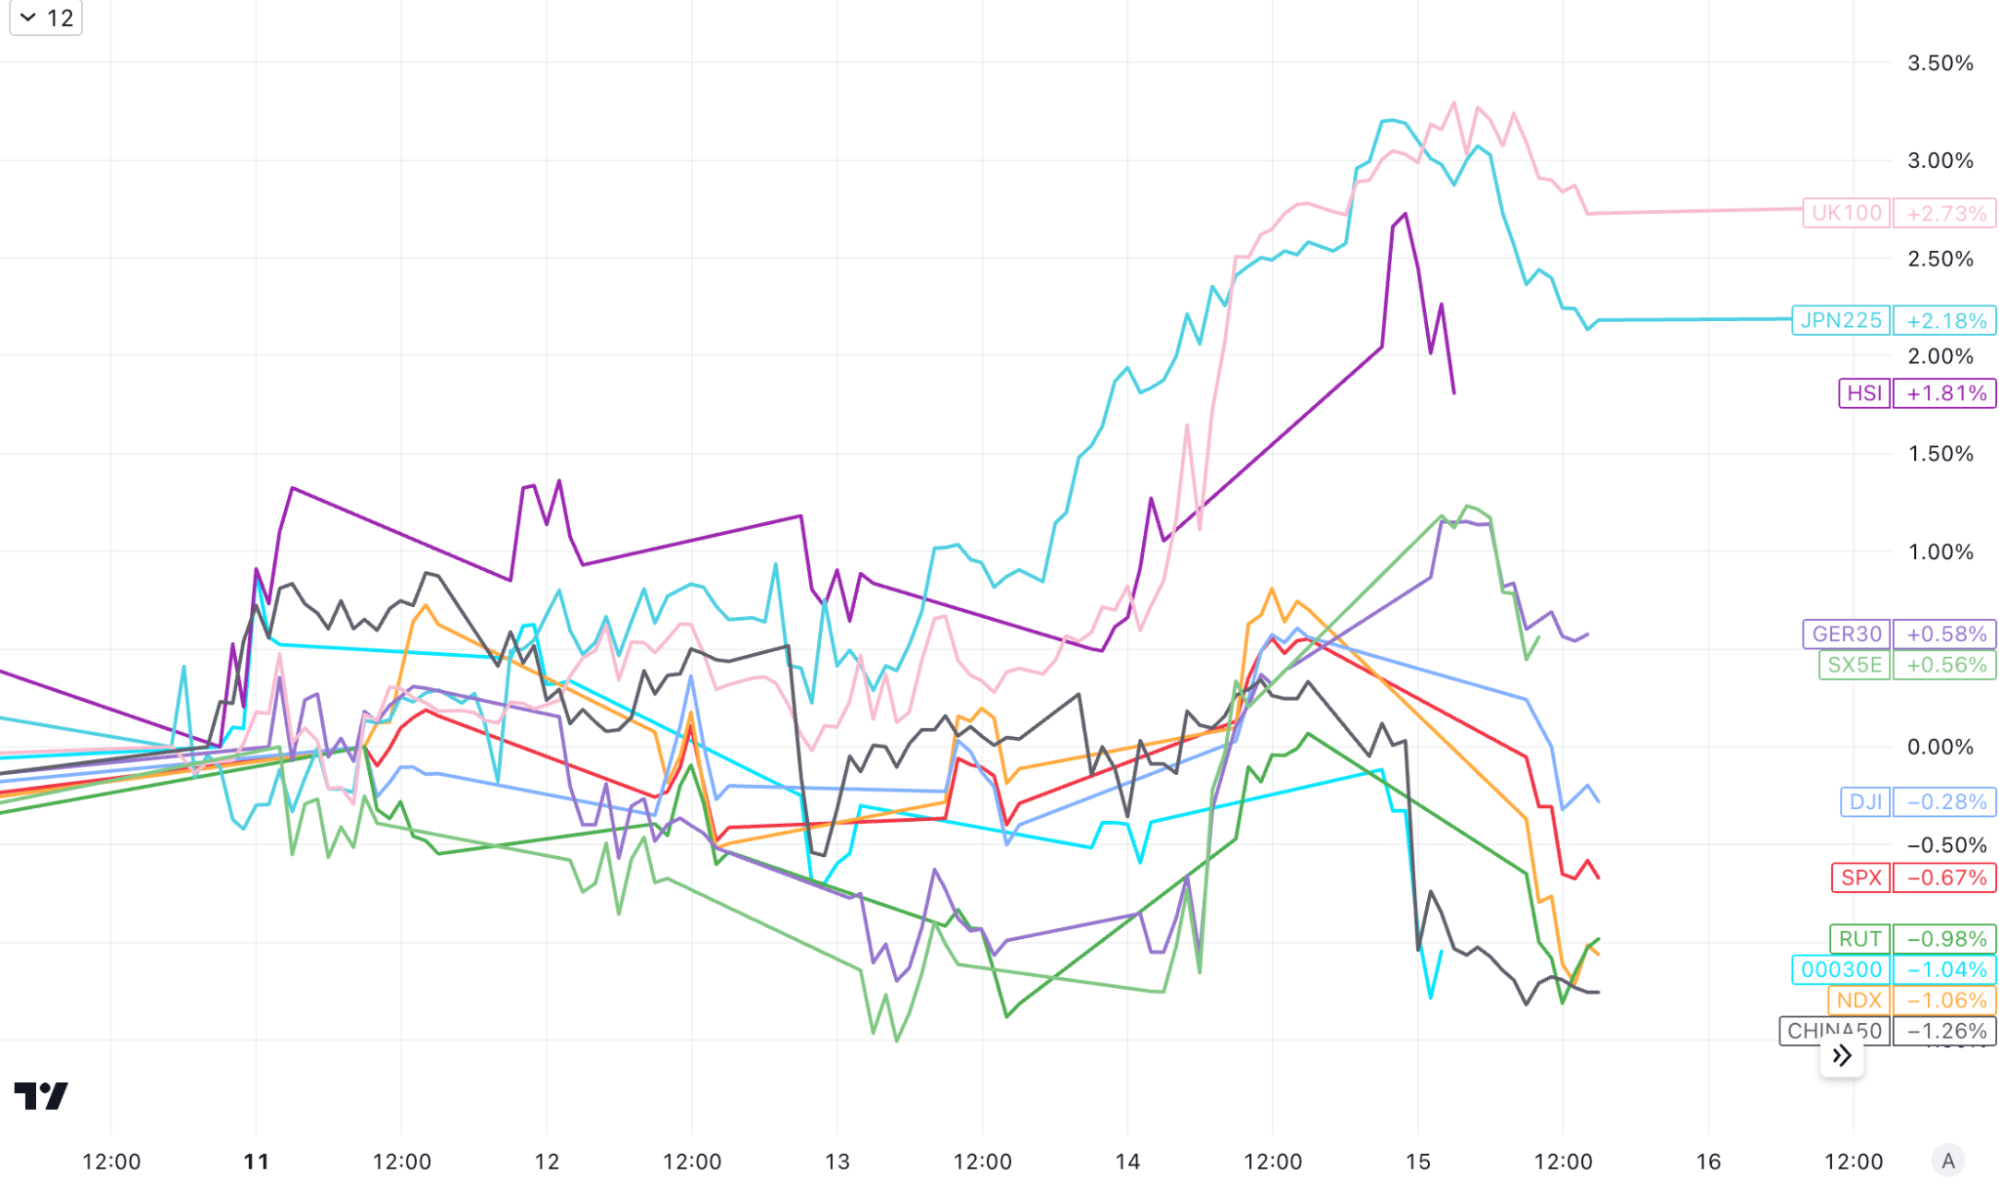
In terms of other stock markets, last week Hong Kong, Japan (JPN 225 hit a new high since July, Japanese investors flocked to technology stocks after the strong listing of SoftBank Group’s Arm), and the United Kingdom (UK 100 hit a new high since June), European stocks The Stoxx 50 also recorded a gain of 0.6%, and the mainland China stock index CSI 300 fell for the third consecutive week:
So far in 2023 we have not seen a correction at the 10% level, which typically happens once a year. Therefore, we wouldnt be surprised if September and October, historically weak months, see a deeper retracement (and stocks could trade sideways for a while rather than fall outright), but in the short term we dont We dont see any major economic or financial risks, so a big drop could be seen as a buying opportunity for long-term investing.
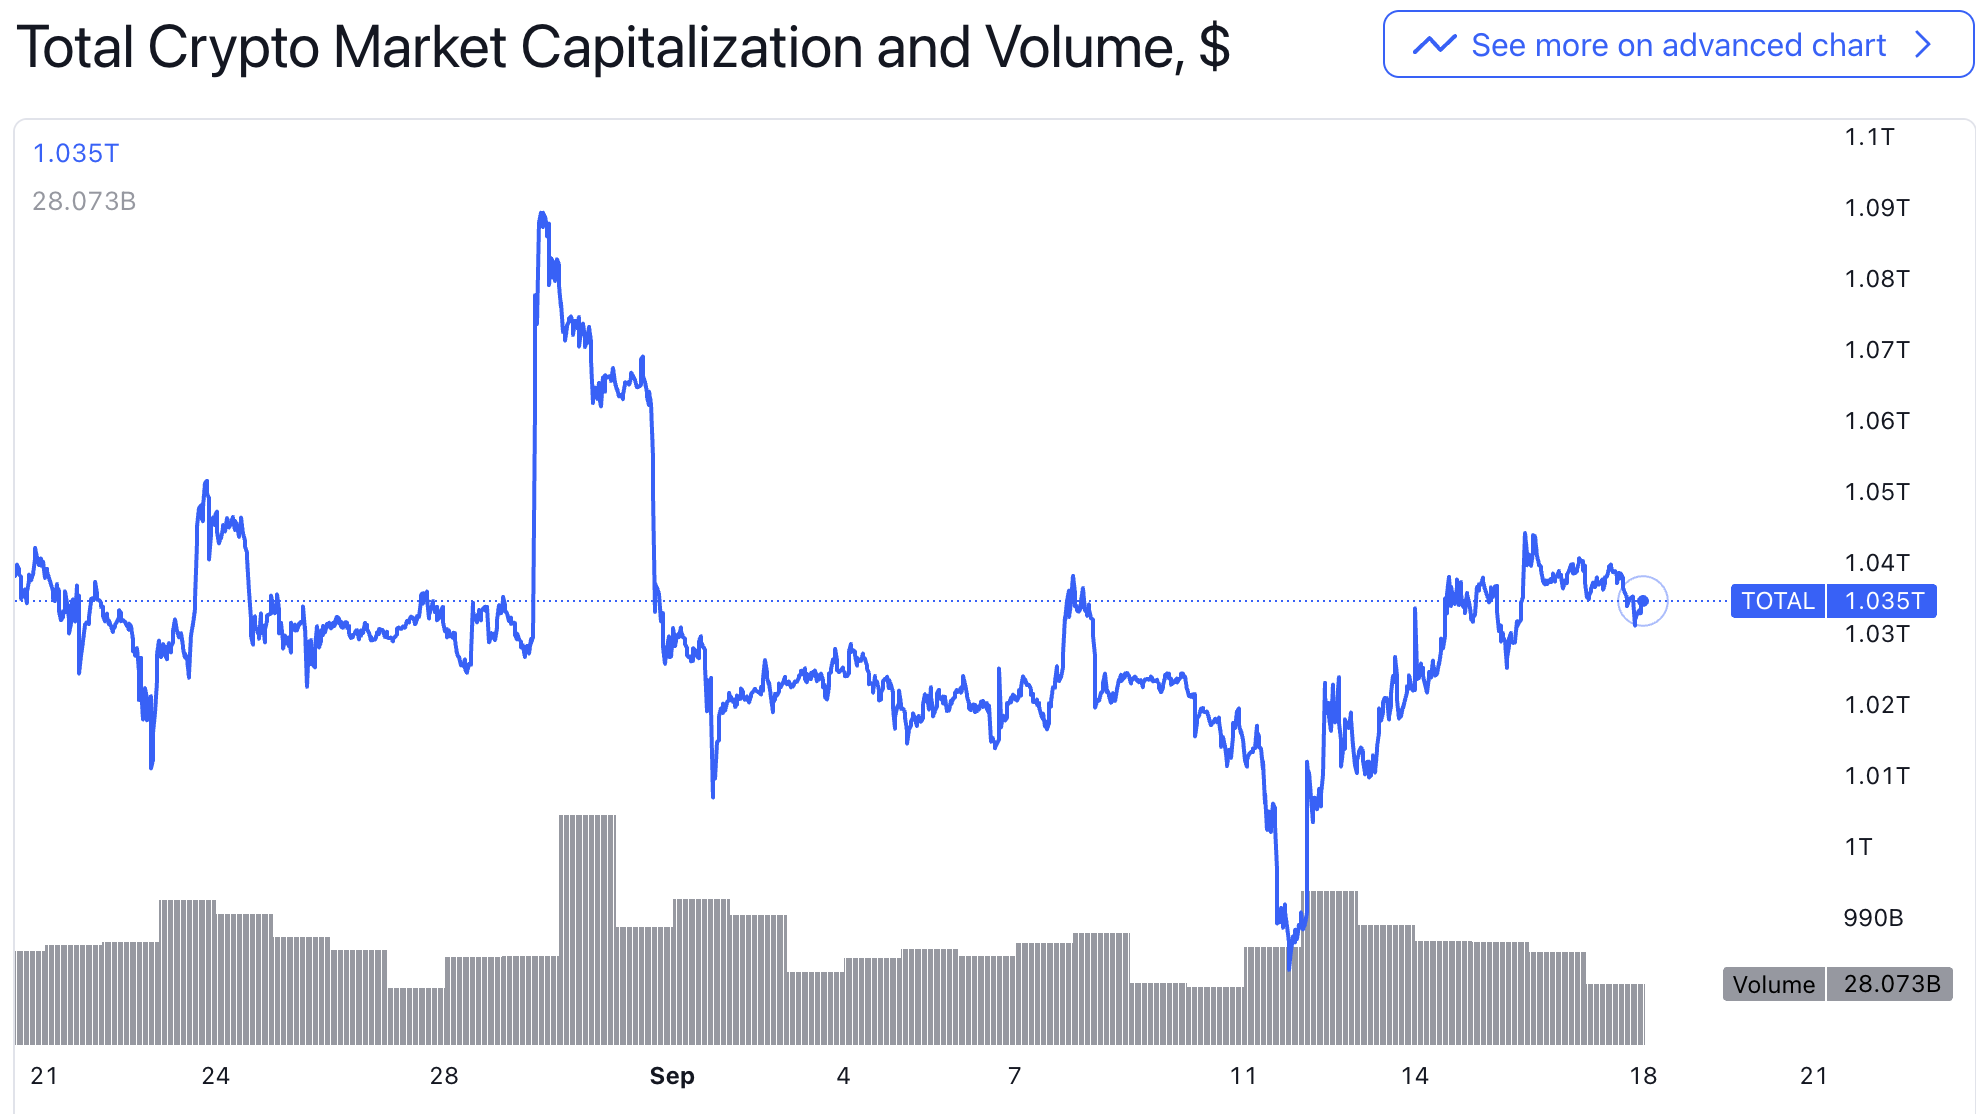
Cryptocurrencies rebounded after a sharp fall on Monday. The decline was mainly due to the continued fermentation of news about FTX’s $3.4 billion crypto asset liquidation. However, when the landing was confirmed on Thursday, the market did not fall significantly. We have analyzed the details at the Muse morning meeting on Thursday. Pass:
Important financial events
[The European Central Bank raised interest rates by 25 basis points, but suggested that interest rates may have peaked]
The European Central Bank raised its benchmark interest rate by 0.25 percentage point to 4% on Thursday, its 10th consecutive increase since it began hiking rates rapidly from below zero last year. European Central Bank President Christine Lagarde hinted that Thursdays interest rate hike may be the last in this cycle, which caused the euro to tumble and the dollar index to break through 105.3 to refresh the highest level since the March crisis. However, in terms of intuitive remarks, Lagarde also mentioned that it is currently unable to decide whether the interest rate has been raised to the end, nor did he say whether to increase it in November. He also emphasized that the European Central Bank has not discussed cutting interest rates, but only said that it is data-driven, and the market will rely on weak data. It is believed that the ECB is unlikely to raise interest rates again.
[Demand slows, TSMC allegedly asks suppliers to delay equipment delivery]
Chinas Taiwan Semiconductor Manufacturing Co. (TSMC) asked major suppliers to postpone the delivery of high-end chip manufacturing equipment due to weak economic conditions and end-market demand, media said on Friday. Affected companies include companies such as ASML, which makes lithography equipment. On Friday, European and American chip stocks fell. TSMCs Dutch suppliers ASML, BE Semiconductor Industries and ASMI closed down 3.5%, 4.8% and 6.6% respectively. The US Philadelphia Semiconductor Index closed down about 3%, underperforming the market. NVIDIA fell. About 3.7%, TSMC’s U.S. stocks fell 2.4%, the lowest in four months.
[The U.S. auto industry strike affects 9% of North American auto production capacity, and Musk reaps the benefits]
The United Auto Workers (UAW) union launched a strike against Detroits Big Three on Friday, September 15, local time. This is the first strike in the history of the UAW targeting three major U.S. automakers at the same time, and it is also one of the strongest strikes in the United States in recent years. And the most successful new players in electric vehicles, like Tesla and Rivian, are not unionized. Regardless of the outcome of the strike, Tesla CEO Musk has already won. The Big Three will certainly spend more money, and any salary increase will further enhance Teslas huge cost advantage in the field of electric vehicles. Tesla shares surged 10% last week.
[Beyond Nvidia, Tesla’s supercomputer? 】
The surge in Teslas stock price is also related to the increase in target price by major Wall Street banks. On Monday, Morgan Stanley raised the new target price of Tesla stock to US$400 from the previous US$250, emphasizing Teslas Dojo supercomputer project. potential. Dojo is a supercomputer network that integrates millions of Tesla vehicles and is designed to train artificial intelligence systems to complete complex tasks, such as assisting Teslas driver assistance system Autopilot and promoting the ability of full self-driving. As of July this year, Tesla has sold nearly 4.53 million vehicles, each of which is transmitting data back to Tesla to develop self-driving features.
Combining a vast network of mobile sensors and cameras with powerful edge computing capabilities using this backend supercomputer designed to learn from real data is a never-before-seen model that takes Tesla beyond a pure car Manufacturers category.
Morgan Stanley believes that Dojo could theoretically bring up to $500 billion in long-term value to the company. Morgan Stanley predicts that by 2030, Tesla will be able to generate $2,160 in monthly recurring revenue from car owners, which will come from services provided by Dojo and car subscription software such as self-driving systems, vehicle charging services, maintenance, Software upgrades, future development content, etc.
[China’s new RMB loans and social financing increased significantly in August]
In August, RMB loans increased by 1.36 trillion yuan, and the social financing scale increased by 3.12 trillion yuan. The stock of social financing scale at the end of the month increased by 9% year-on-year, while broad money supply (M2) increased by 10.6% year-on-year. Whether compared with the previous value or the same period last year, new loans and social financing increased significantly in August. This was mainly due to the intensive introduction of regulatory measures to stabilize the economy, stock market, and property market that month, which boosted market confidence and the impact of finance on the real economy. Support continues to increase, and physical demand is also picking up simultaneously.
[Weight loss pills are the new AI]
The weight-loss drug market is booming. As the market values of Novo Nordisk and Eli Lilly, the two major weight-loss drug manufacturers, have soared, the financial blog ZeroHedge directly shouted out that weight-loss drugs are the new AI. Annual sales of GLP-1 drugs under the duopoly of Novo Nordisk and Eli Lilly will exceed $100 billion by 2030, according to new forecasts from JPMorgan Chase.
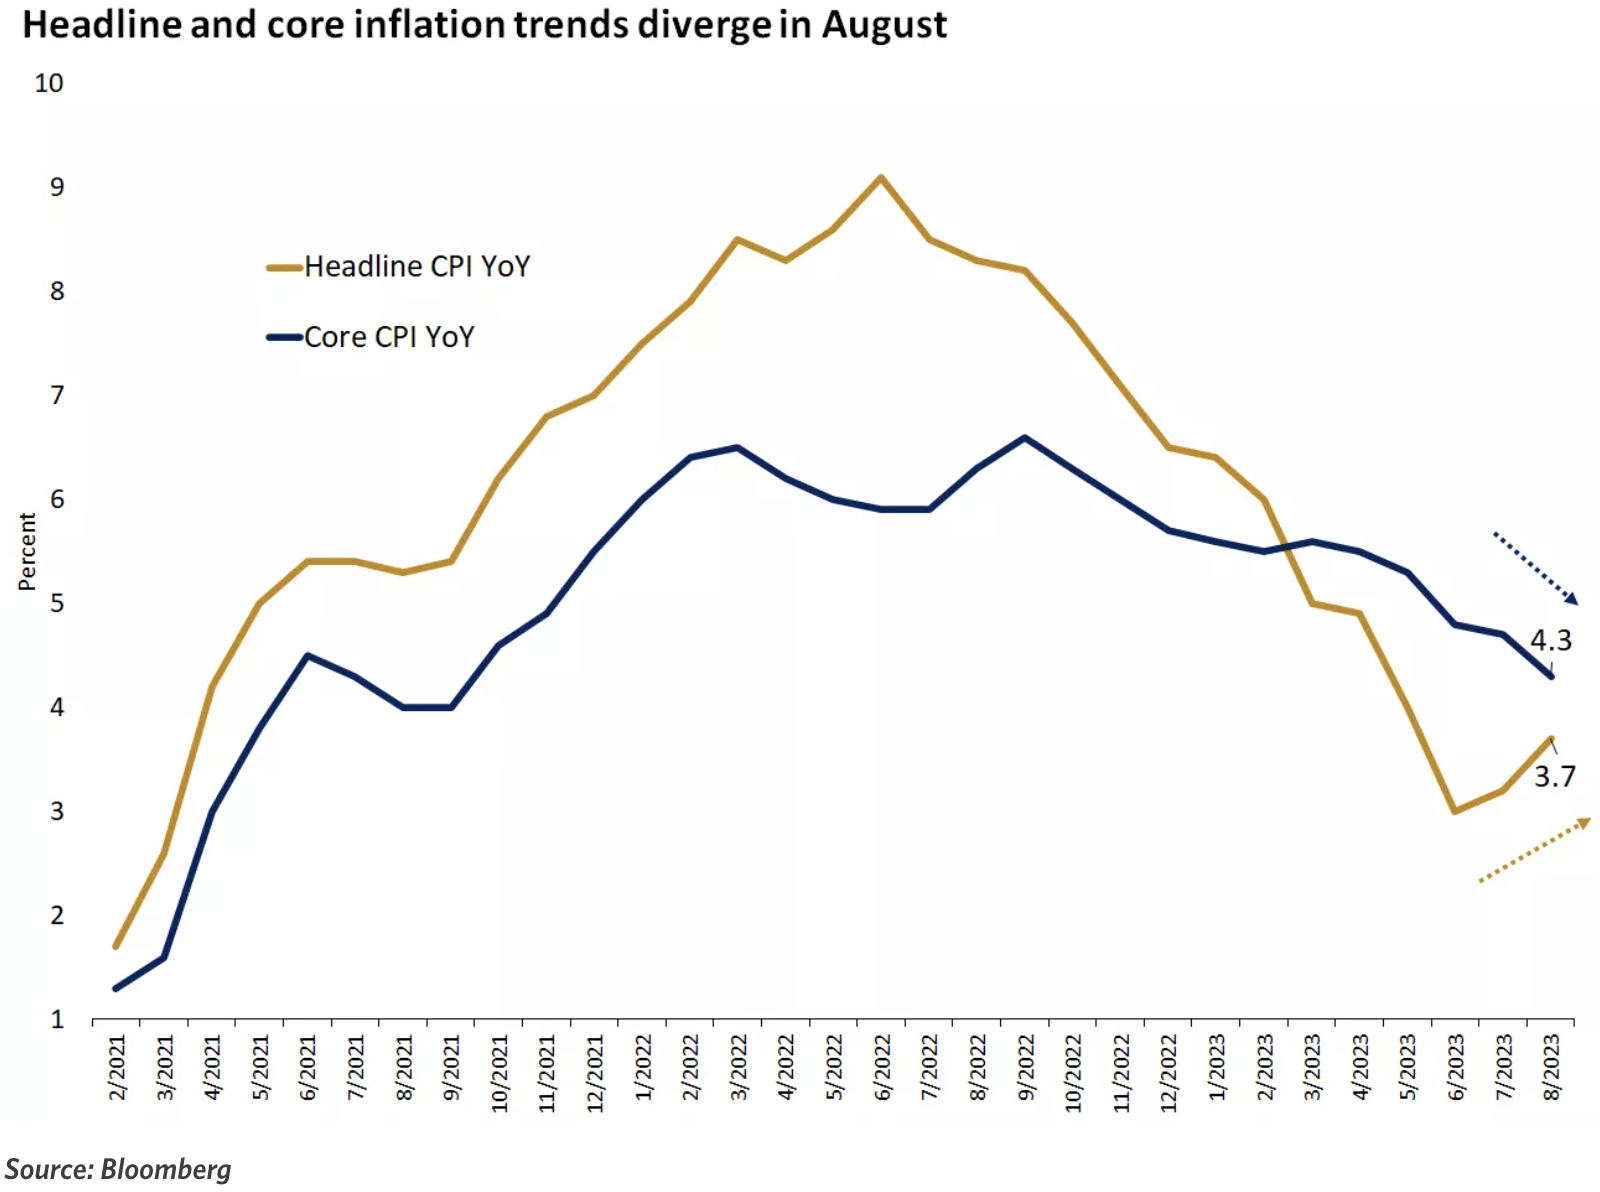
[U.S. inflation remains stubborn, CPI rebounded to 3.7% year-on-year in August, and core CPI accelerated for the first time in six months]
Oil prices soared and U.S. inflation accelerated again in August, which may require the Federal Reserve to keep interest rates high for longer. The overall CPI year-on-year growth rate rebounded for the second consecutive month and exceeded expectations of 3.6%. The value before July was 3.2%; the month-on-month CPI growth rate in August accelerated from 0.2% in July to 0.6%, in line with expectations, and was 14 The largest month-on-month increase in months. The core CPI excluding energy and food, which the Fed is more concerned about, fell back from 4.7% to 4.3% year-on-year, in line with expectations and the smallest increase in the past two years; however, the core CPI month-on-month increase rose slightly to 0.3 from 0.2% in July. %, exceeding expectations by 0.2%.
[U.S. PPI rebounded more than expected in August, increasing 1.6% year-on-year, the largest month-on-month increase in more than a year]
Affected by rising energy prices, the U.S. PPI continued to rise more than expected in August, with a year-on-year increase of 1.6%, higher than the expected 1.3%. It increased more than expected for the second consecutive month; PPI increased by 0.7% month-on-month, the highest growth since June last year. The growth rate in July was revised upward to 0.4%. In August, core PPI increased by 2.2% year-on-year and 0.2% month-on-month, both slower than Julys growth and in line with expectations.
[Gasoline prices are strongly supported, and U.S. retail sales increased by 0.6% month-on-month in August, far exceeding expectations]
U.S. retail sales increased by 0.6% month-on-month in August, exceeding the previous revised value of 0.5% and far exceeding market expectations of 0.1%, achieving the fifth consecutive month of growth. Retail sales overall remained resilient in August, supported primarily by rising gasoline prices, as upward price pressures began to emerge elsewhere.
Hot Topic: About the Yield Curve Inversion
Many investors see this rise in real yields as different from the past, as yields continue to rise despite the end of a central bank tightening cycle. Markets are increasingly expecting a new equilibrium level of real interest rates that will be higher than in the decade before the pandemic, driven by higher fiscal deficits and productivity growth. Because fiscal deficits are higher than in the past, there is more government debt available, and recent technological innovations have led to higher productivity, in contrast to the long stagnation of the 2008 financial crisis.
Real yields and real GDP growth in the United States today look similar to those before 2008. In mid-2006, the 10-year Treasury note was pricing in real yields of around 2.5%. The U.S. economy grew at a real rate of 3.0% the year before, and the Fed raised its policy rate target to 5.25%.
The 10-year Treasury note today offers a real yield of nearly 2.0%, while the real economy has recently grown by 2.5%. Even todays target federal funds rate range of 5.25% -5.50% is similar to 2006. The market is priced little differently than it was before the 2008 global financial crisis.
What is most obvious and concerning is that the yield curve is much flatter today than it was in 2006, both in nominal and real terms. In mid-2006, the coupon yield on the 2-year Treasury note was the same as the coupon rate on the 10-year Treasury note. And today, 2-year yields are 70 – 100 basis points higher than 10-year yields. Many believe the severity of the yield curve inversion in 2022 foreshadows a recession in 2023.
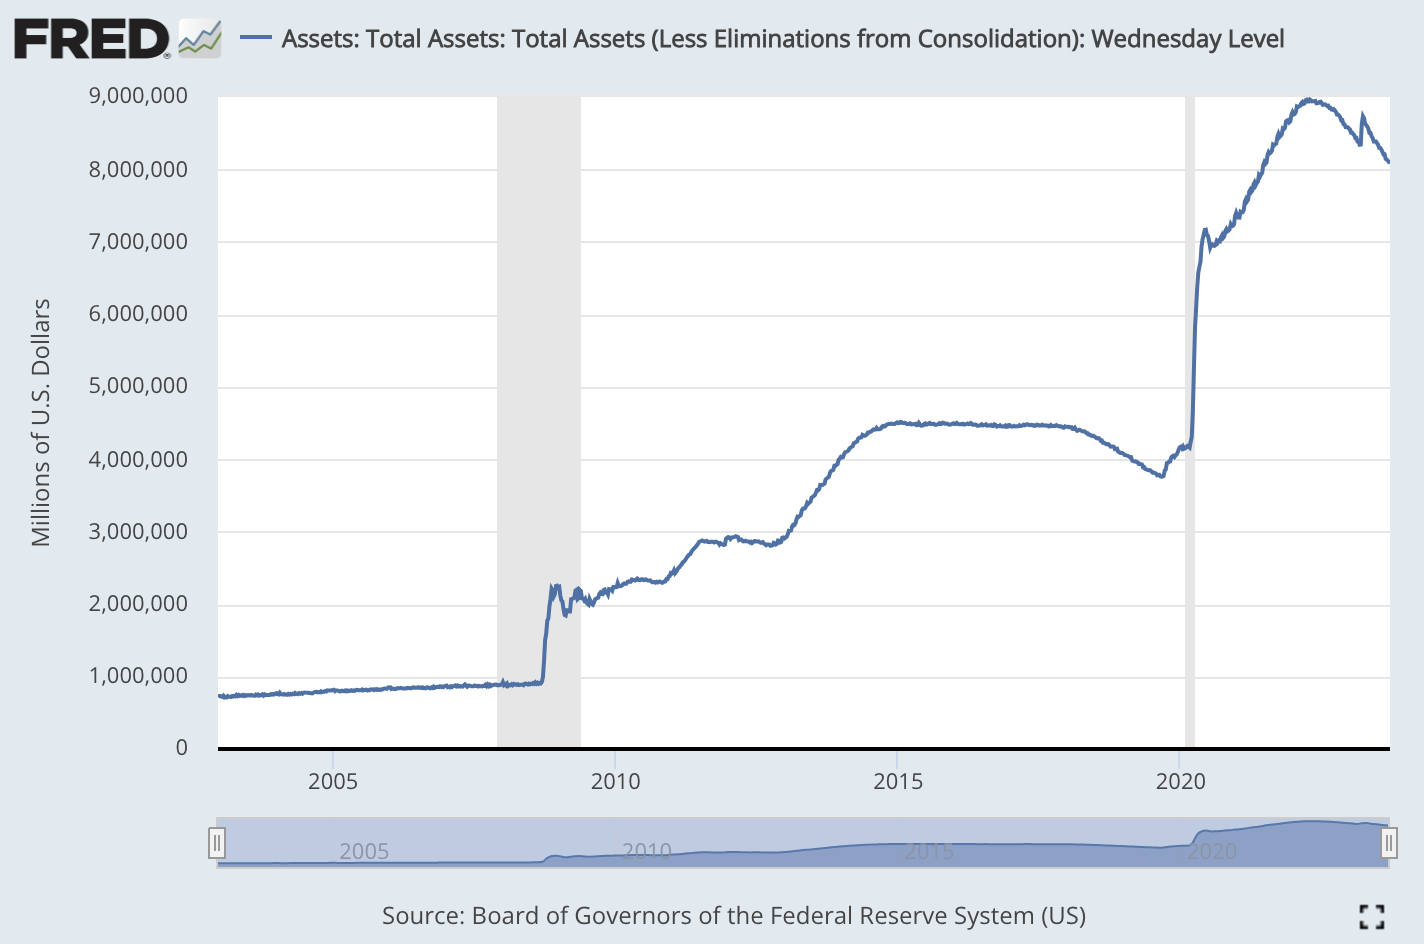
In addition to the distortion of the market structure caused by the difference in expectations mentioned many times before, the size of the central banks balance sheet may also be one of the reasons. The greater the central banks holdings of long-term government bonds as a proportion of total issuance, the flatter the yield curve should theoretically be. The Feds balance sheet is an order of magnitude larger today than it was in 2006, so for the same short-term policy rate, the yield curve should be flatter.
If you take into account the impact of balance sheet size, real yields today may actually be much higher than they were in 2006, which is an important difference. In 2006, the Feds balance sheet was approximately $800 billion. And today the Fed’s balance sheet is about $8 trillion. In other words, it is about 10 times larger today than it was in 2006.
In the context of the Fed continuing to shrink its balance sheet (albeit very slowly) and the government continuing to increase issuance, it is difficult to expect a sharp decline in the bond market yield curve in the short to medium term, unless the economy slows down significantly and coincides with the Feds interest rate cut, which is the crisis or crisis that many people expect. Scenes of recession.
The following is an analysis from the pessimist Via CICC on September 17:
The Federal Reserve began monetary tightening in March 2022, but the large-scale and sustained fiscal expansion has made the credit tightening significantly slower. The renewed fiscal expansion after the SVB incident in March is a typical example. However, slowness does not mean absence. The start of credit tightening will become the gravity that restricts growth. Since March, the risk exposure of small and medium-sized banks has simultaneously promoted the expansion of government credit and accelerated the tightening of private credit, especially in indirect financing more relevant to small and medium-sized banks: 1) Bank credit standards have been significantly tightened, especially in commercial real estate, large and medium-sized enterprises The proportion of banks tightening lending standards for enterprises and small businesses has risen rapidly and is close to the highest point in the early stages of the epidemic; credit card and home loan standards have also tightened. 2) The absolute scale of industrial and commercial loans has declined significantly, with the year-on-year growth rate close to zero, and the growth rates of consumer loans and housing loans have fallen back from their high levels.
Looking forward, the main key nodes of the U.S. cycle are: the Federal Reserve is nearing the end of raising interest rates at the end of this year, and credit tightening continues; excess savings are basically consumed early next year, which will gradually curb consumption, and inventory depletion will continue until around the second quarter of next year. Therefore, the U.S. economy may continue to decline by the end of this year and next year, but the extent will not be very deep (resident balance sheets remain healthy). Therefore, the market expects that the Federal Reserve may start an interest rate cut cycle after the second half of next year. At that time, the credit cycle will restart and stabilize, promoting the resumption of the replenishment cycle, or achieving a recovery after the economy bottoms out.
The negative analysis comes from the optimistic Deutsche Bank:
In a report on September 14, the bank believed that the U.S. economy is still in a period of resilient growth and there are no obvious signs of recession. This is mainly based on the following positive factors:
(1) Businesses and households are in good financial condition and have healthy balance sheets. Corporate leverage is low and households have sufficient savings. This is different from past recessionary cycles.
(2) The job market is still relatively tight, with the unemployment rate close to historical lows. Companies are reluctant to lay off workers. Employment is also below pre-pandemic trend levels. (Until now, total employment remains slightly below where it would have been assuming continued growth of 1.6% from 2015 – 2019)
(3) Households accumulated a large amount of additional savings during the epidemic. Even using more optimistic assumptions, these savings would be enough to support consumption until at least the second half of 2023.
(4) Real estate is the most interest-sensitive part of the economy, but its GDP ratio is not high, only 2.8%. In addition, real estate sales have shown signs of stabilizing recently.
(5) The companys internal cash flow can cover dividends and capital expenditures. Enterprises have little demand for new debt financing.
While leading indicators suggested the economy should be entering recession, actual growth slowed only slightly. The report believes that the economy is likely to continue to grow at a low rate rather than experiencing a recession. The Federal Reserves interest rate hike cycle is also coming to an end, and another significant tightening is unlikely. But the report also predicts that the Federal Reserve is unlikely to significantly cut interest rates in the future to stimulate the economy.
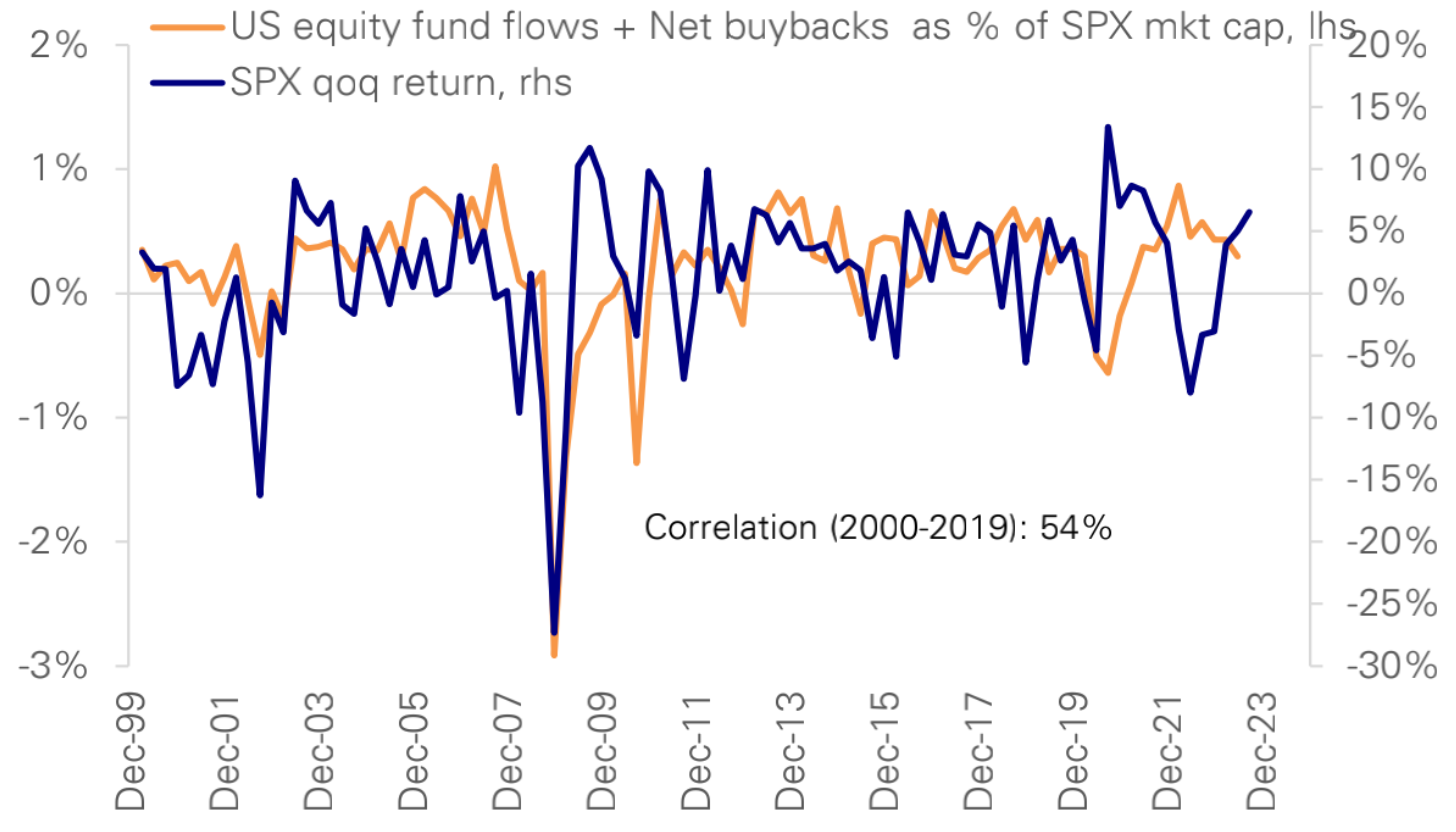
The combination of liquidity, share repurchases, issuance, and positioning changes has historically explained much of the variation in stock market returns. In a milder short-term recession, positioning would be expected to Modest Declines, with small outflows offset by share buybacks. The balance of supply and demand is enough to keep the SP 500 around 4,500 through the end of the year.
Funds and positions
Summary: Overall stock positions increased slightly last week, with subjective investors adding positions; stock funds saw the largest net inflow in 18 months, bond fund inflows increased slightly, and currency fund inflows remained strong.
Judging from the market situation, we are in a typical correction stage. The overall stock position increased slightly this week, and the overall stock position was slightly higher than the neutral level (historical quantile 61%). This was mainly driven by the increase in subjective investor positions:
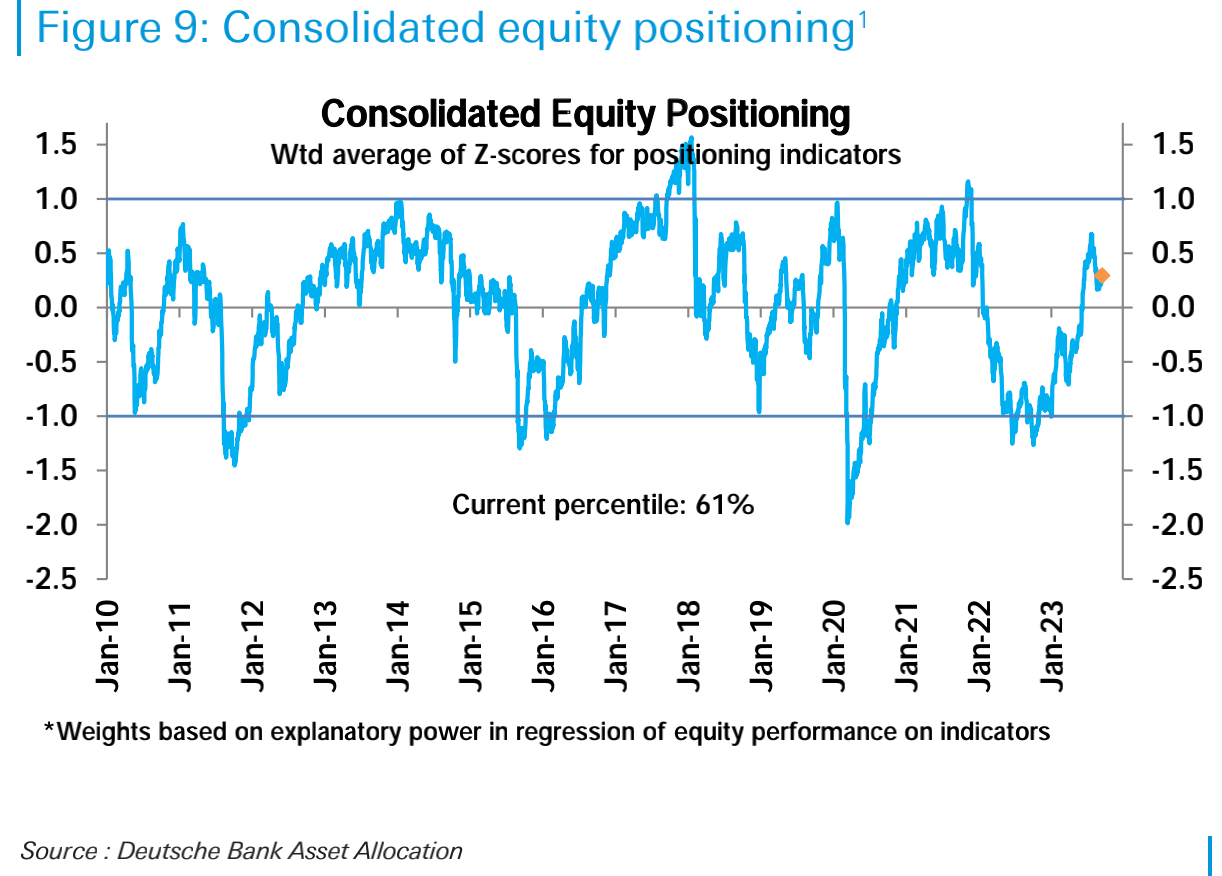
Among them, the positions of subjective investors increased from the 49th percentile historically to the 53rd percentile, and the positions of systematic strategic investors increased from the 71st percentile to 72nd:
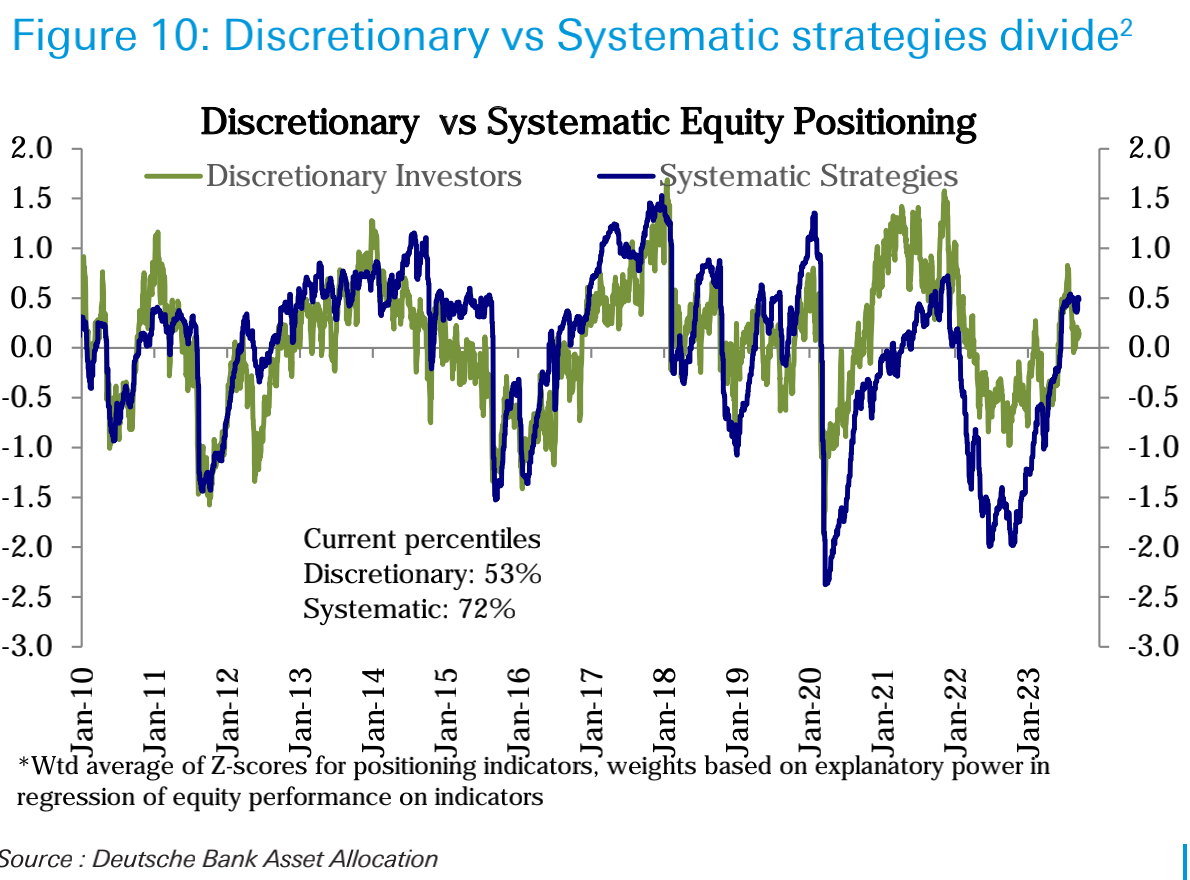
Overall, the rally driven by extreme bearish positions was largely complete by August and was no longer the main driving force supporting the stock market. The current stage needs to be driven by fundamentals, such as better-than-expected economic data and improved corporate profits, to drive the stock market to re-establish more bullish positions.
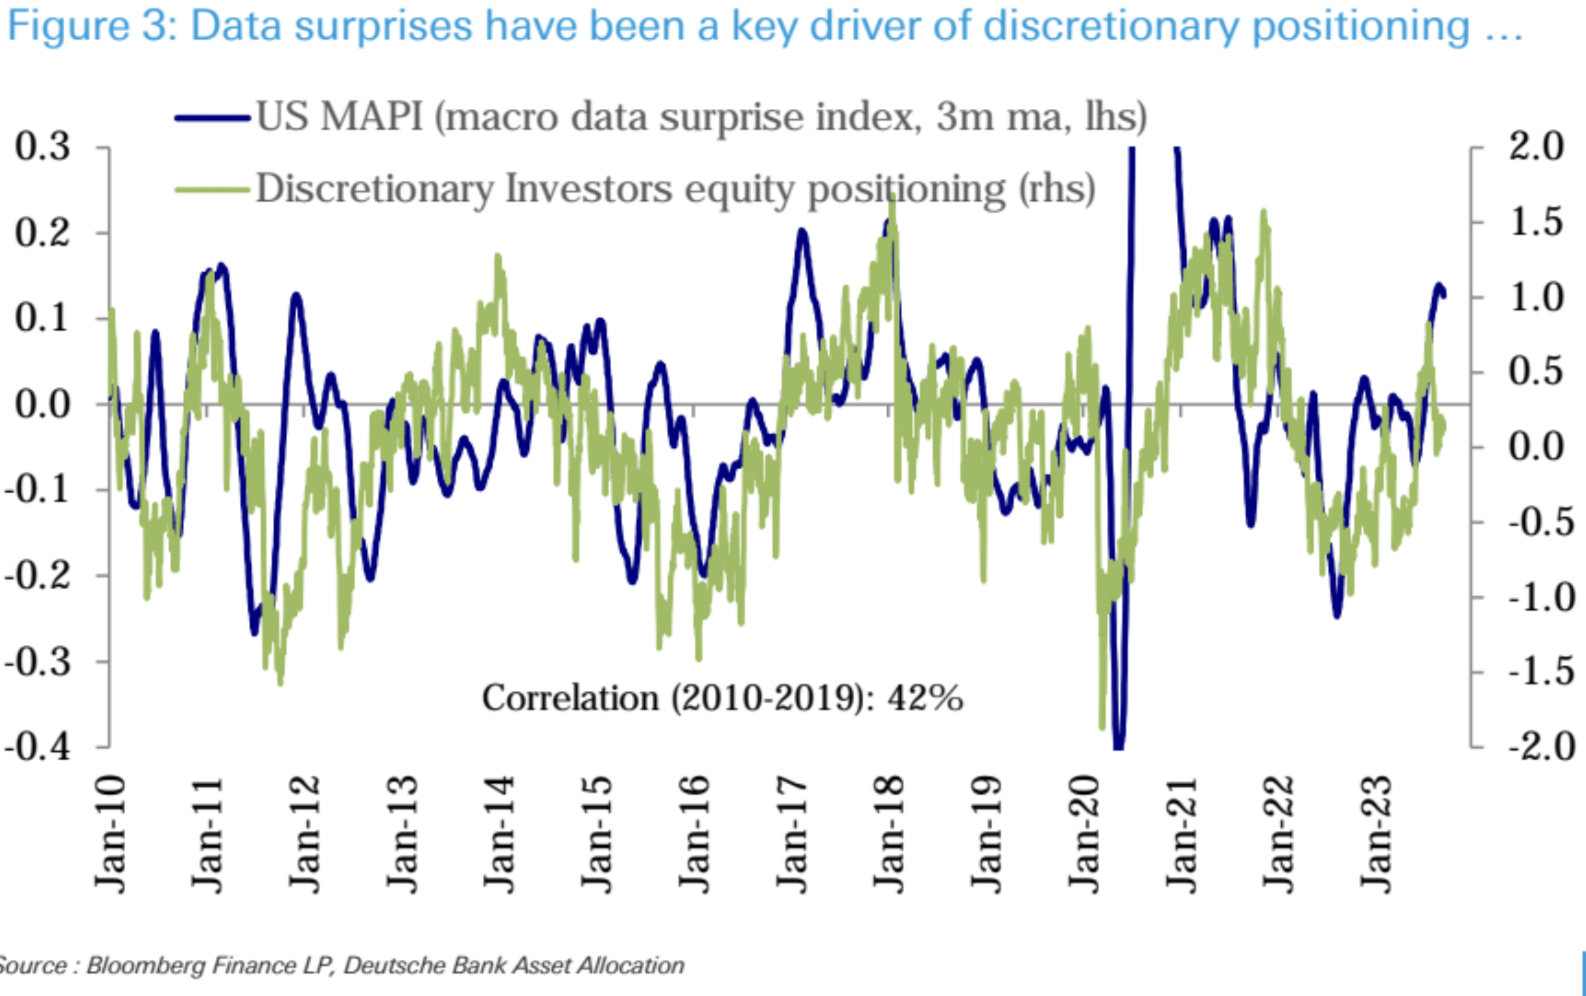
Deutsche Banks view is that expectations for surprises in economic data remain low. A series of better-than-expected growth data has made the economic surprise index continue to strengthen, but expectations for a future economic slowdown are still mainstream, so this may support the next round of better-than-expected data. Moreover, subjective investors’ stock position changes have a high positive correlation with the economic surprise index:
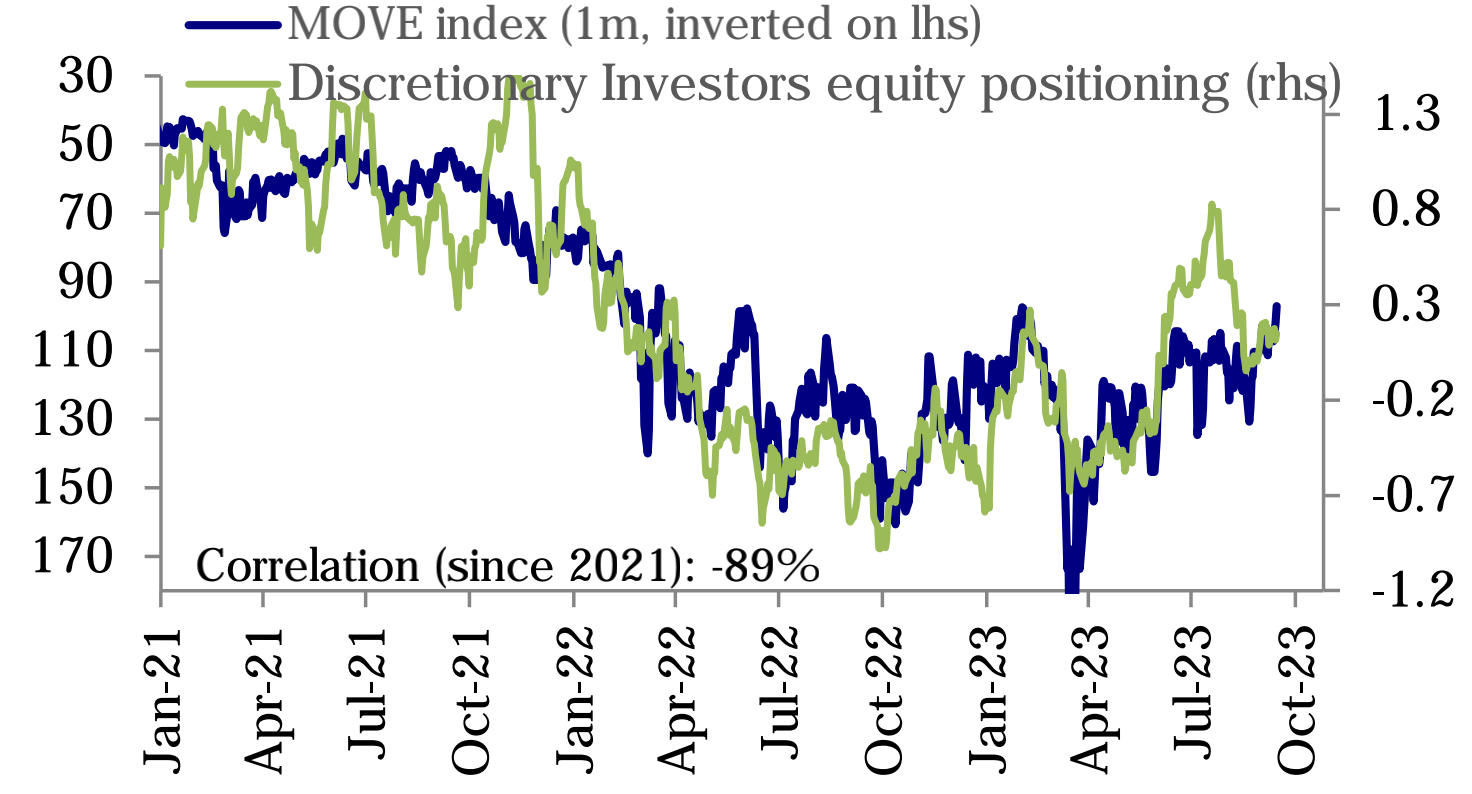
Additionally, subjective investor positions have been highly negatively correlated with interest rate volatility (-89% since 2021) as they continue to focus on the lagged impact of monetary policy tightening, which has now fallen to 18% Monthly low:
Last week, equity funds (ETFs and mutual funds) recorded their largest weekly net inflows in 18 months ($25.3 billion), mainly from the United States ($26.4 billion), while emerging market funds (-$1.2 billion) recorded two Weekly net outflows, European funds (-$1.4 billion) continued 27 weeks of net outflows:
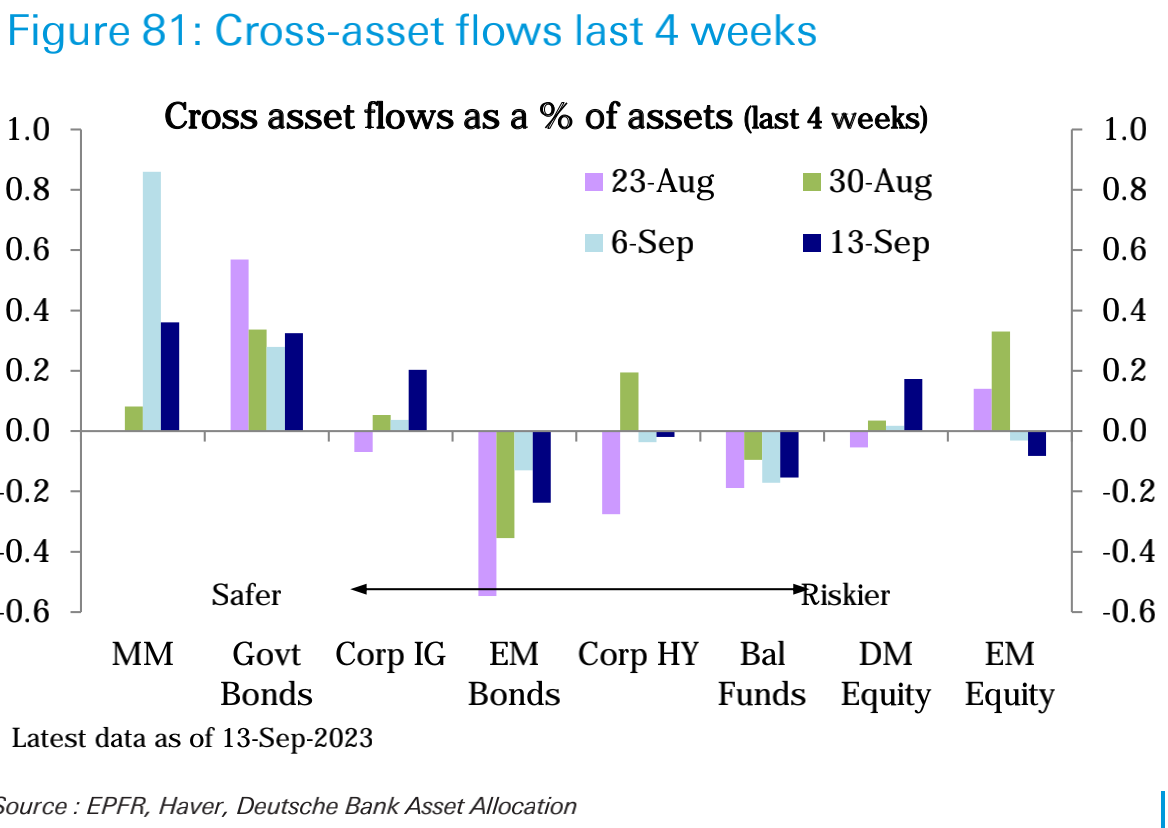
Inflows into bond funds ($4.8 billion) were slightly higher than last week. Corporate bond investment grade ($2.0 billion) accelerated inflows, but high-yield bonds (-$1.0 billion) and emerging market debt (-$1.1 billion) continued to see net outflows. Inflows into government bonds ($3 billion) continued.
Inflows to money market funds ($28.9 billion) slowed from last week but remained strong, mainly in the United States ($23.2 billion).
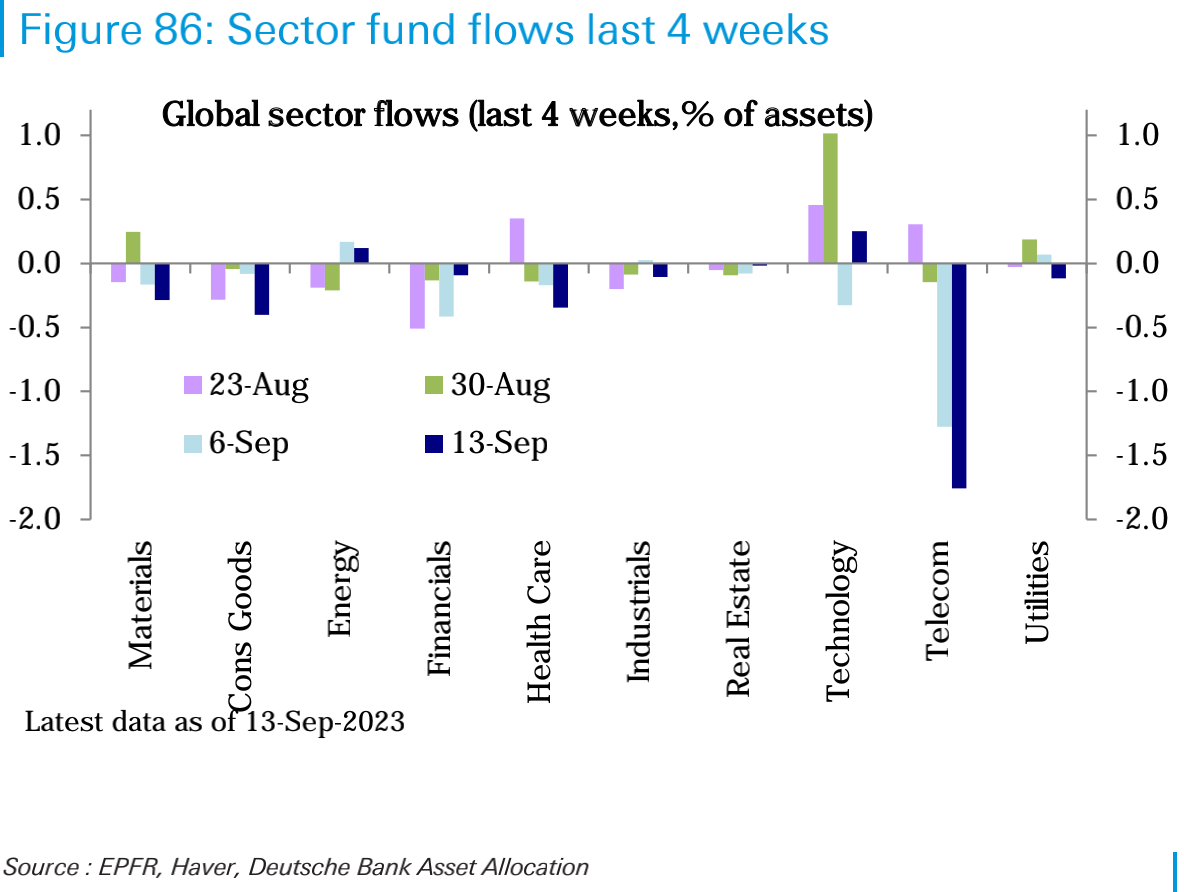
By sector, the technology sector ($1.3 billion) turned to inflows after net outflows last week. The energy sector ($200 million) also received moderate inflows. Healthcare (-$800 million), Consumer Discretionary (-$600 million), Telecommunications (-$400 million), Materials (-$300 million) and Financials (-$200 million) sectors saw net outflows, while other sectors The flow is smaller.
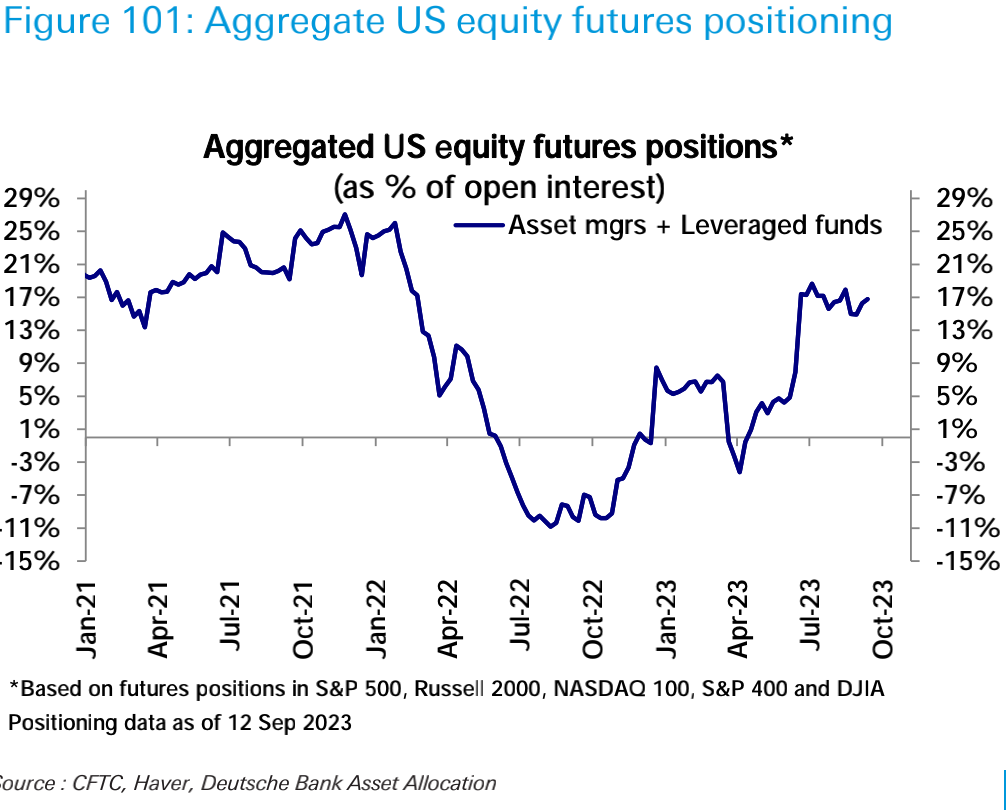
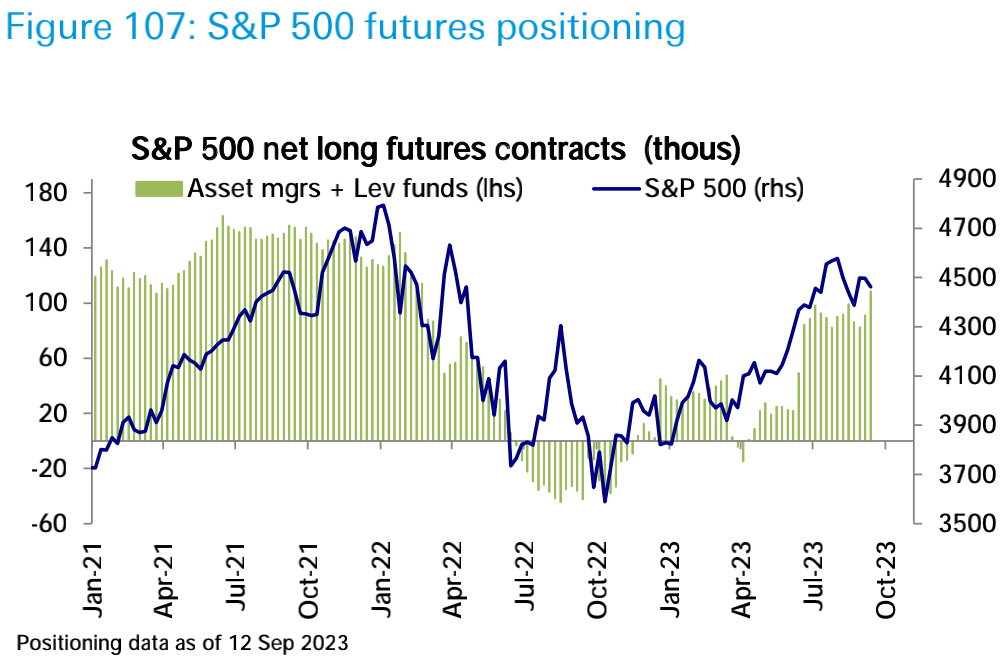
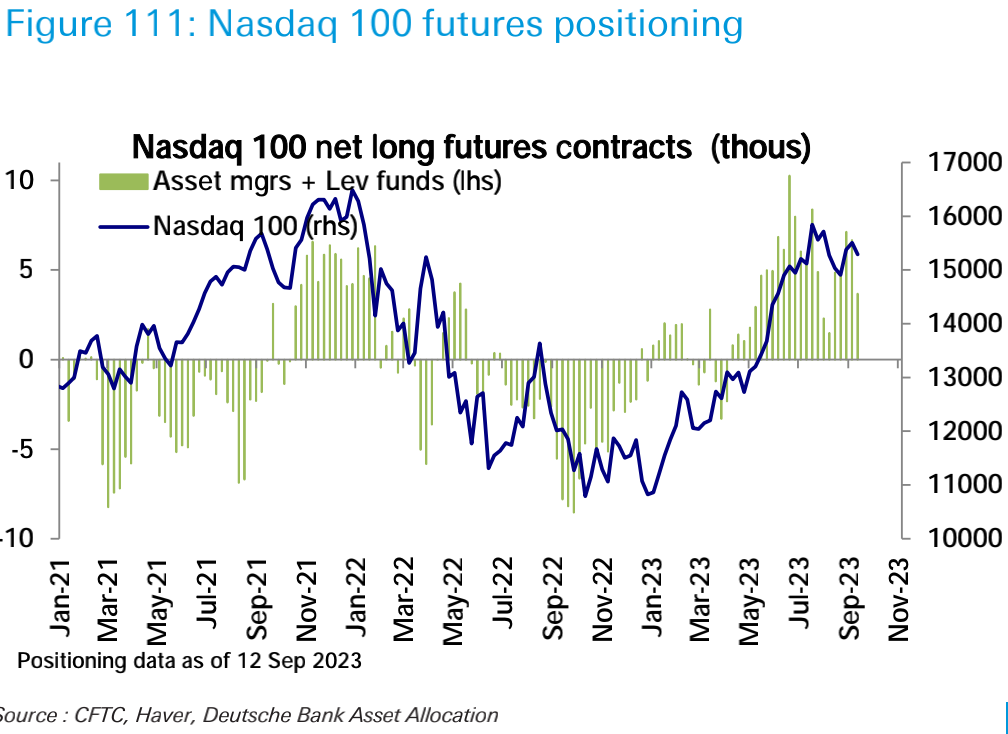
In the futures market, U.S. stock futures generally remained broadly stable. The net long position in SP 500 futures increased sharply to the highest level since February last year, but the net long position in the Nasdaq 100 decreased:
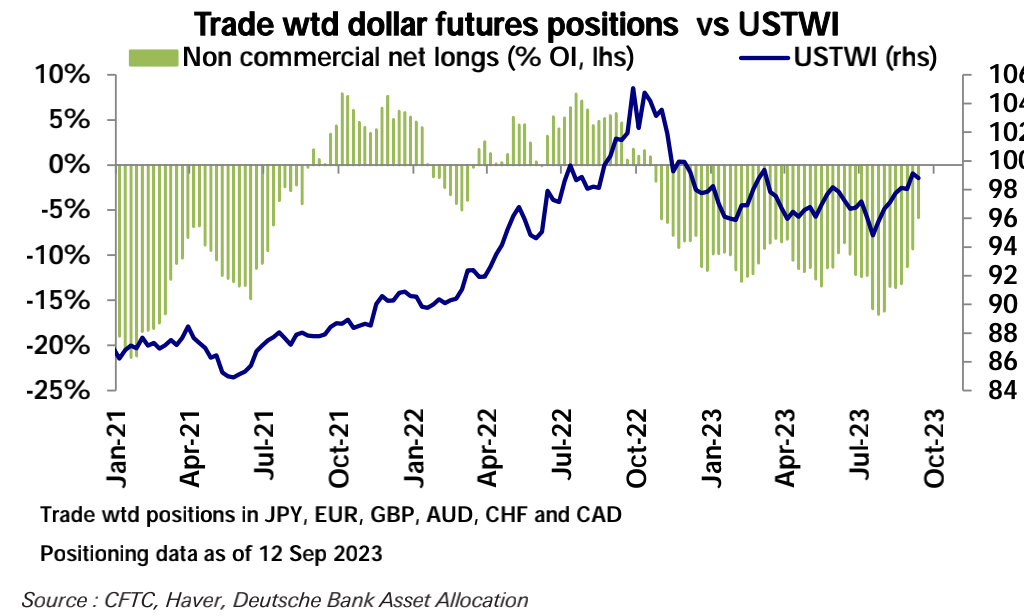
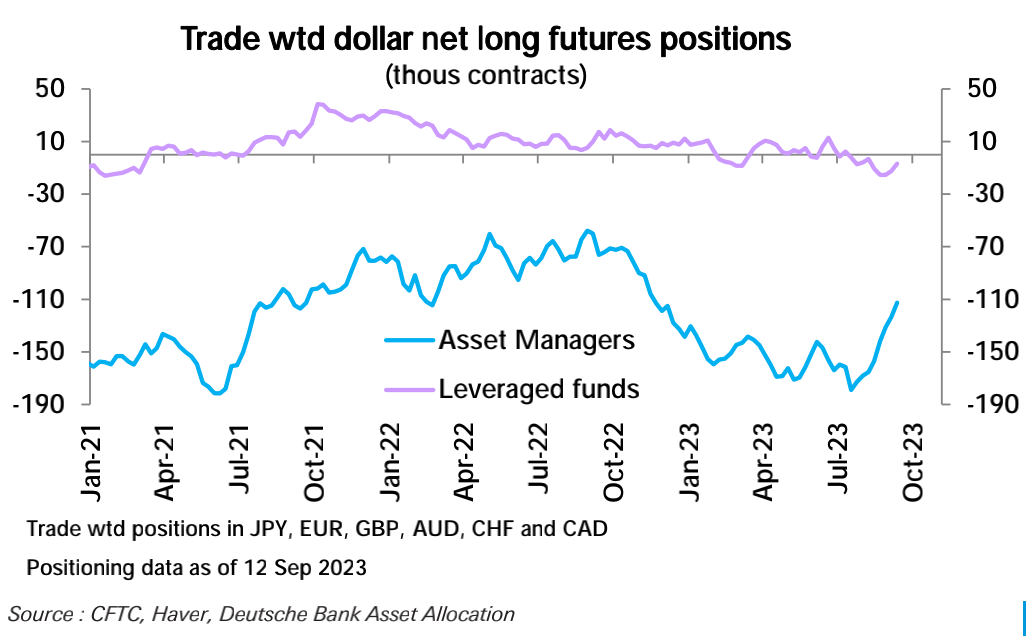
The dollars net short position has decreased for the fourth consecutive week and is now at its lowest level since October last year, mainly driven by the reduction of net short positions by large asset managers:
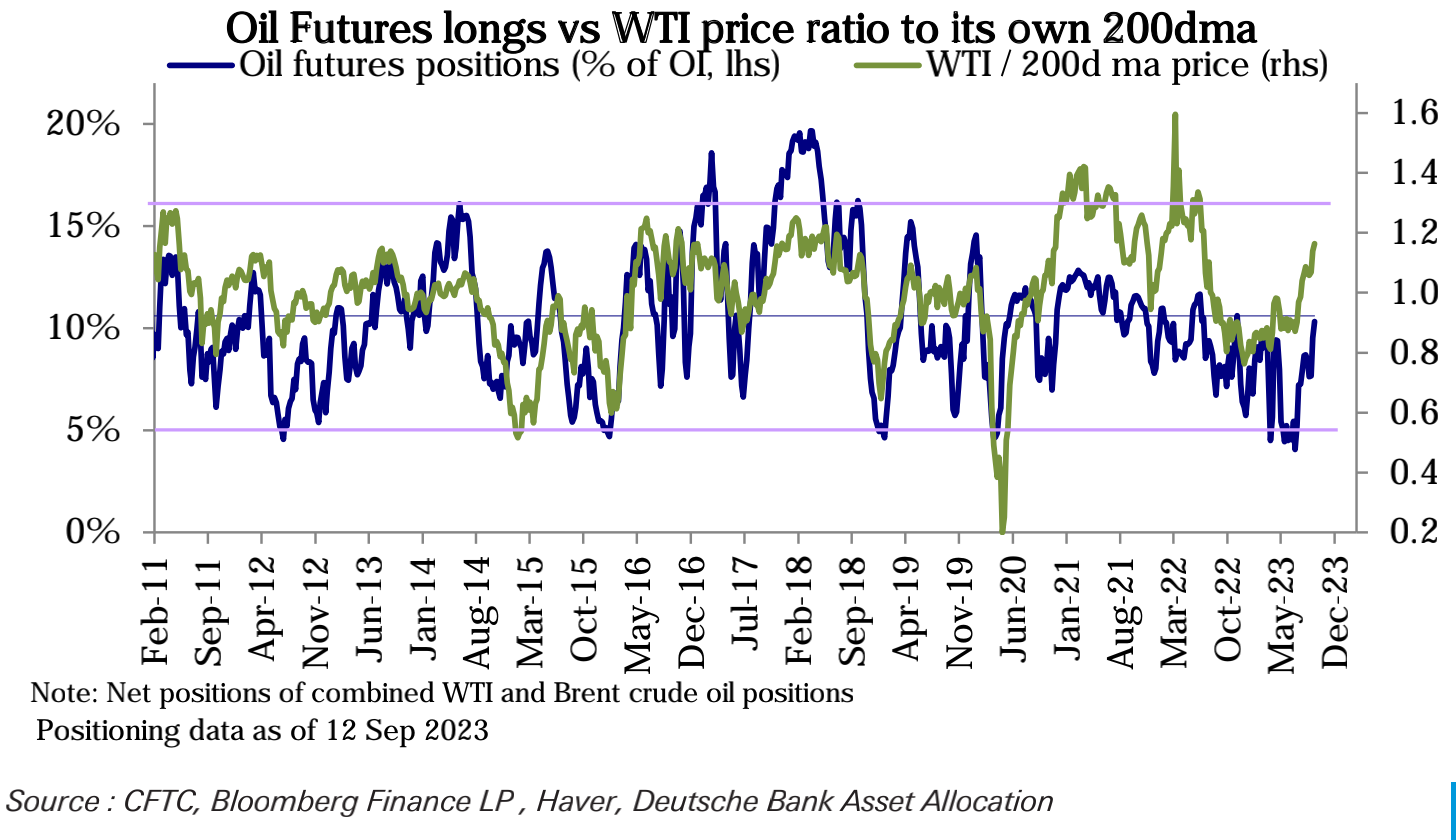
In commodities, crude oil net longs rose to their highest level since October:
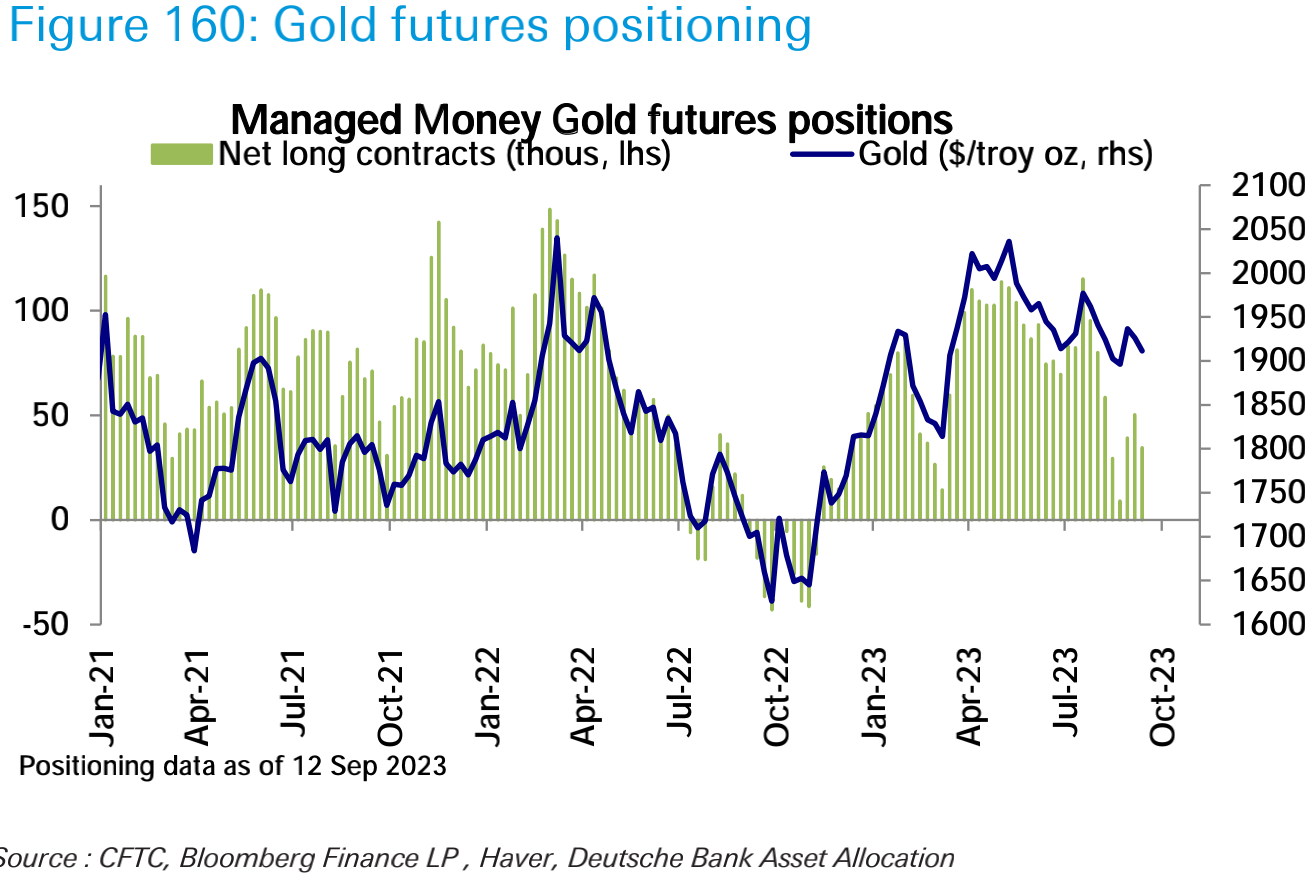
And gold net longs decreased:
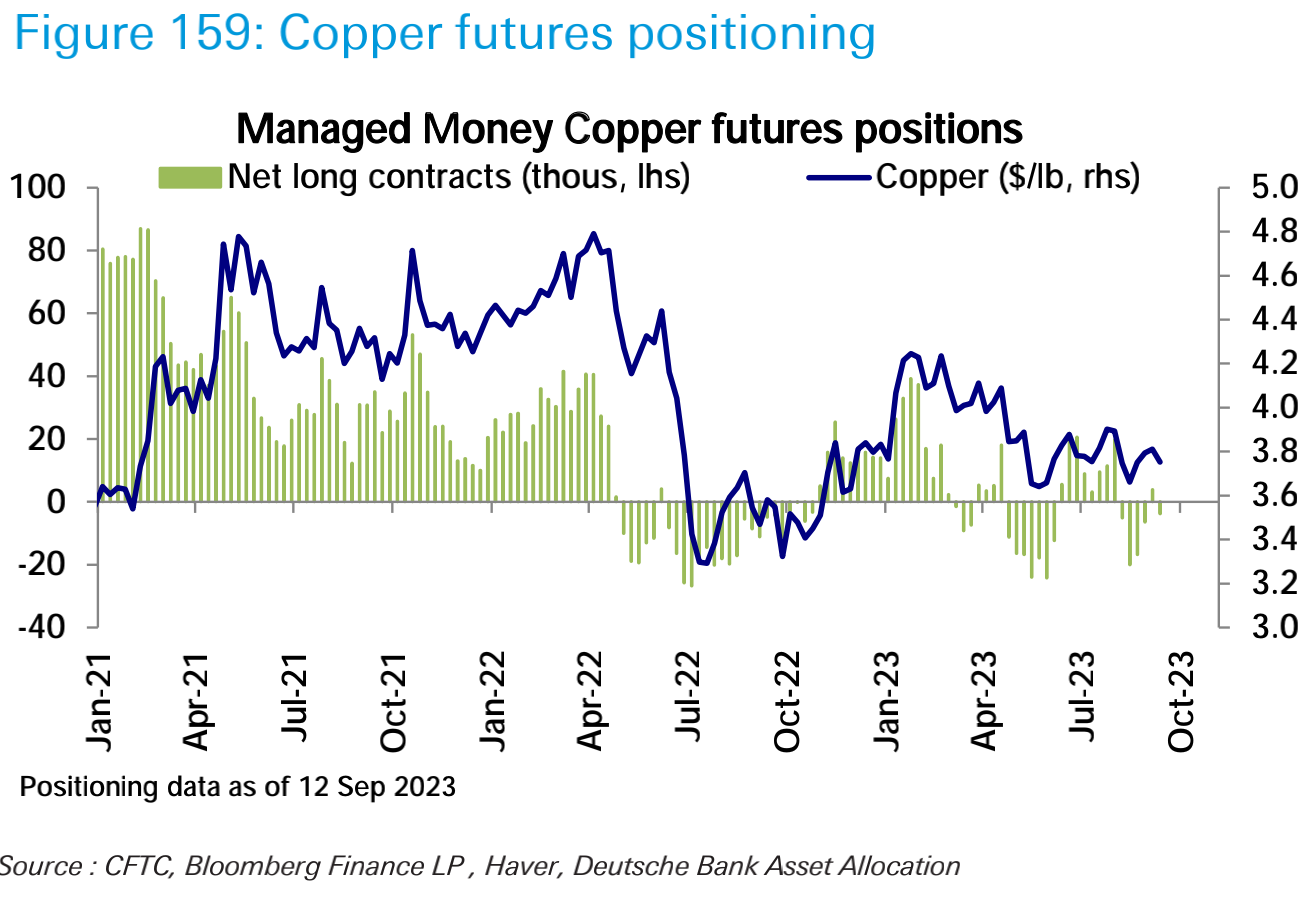
Copper position flips from net long to net short:
In terms of cryptocurrency, stablecoins on centralized exchanges have seen a small net inflow of US$57 million in the past seven days, bringing the total to US$13.86 billion:
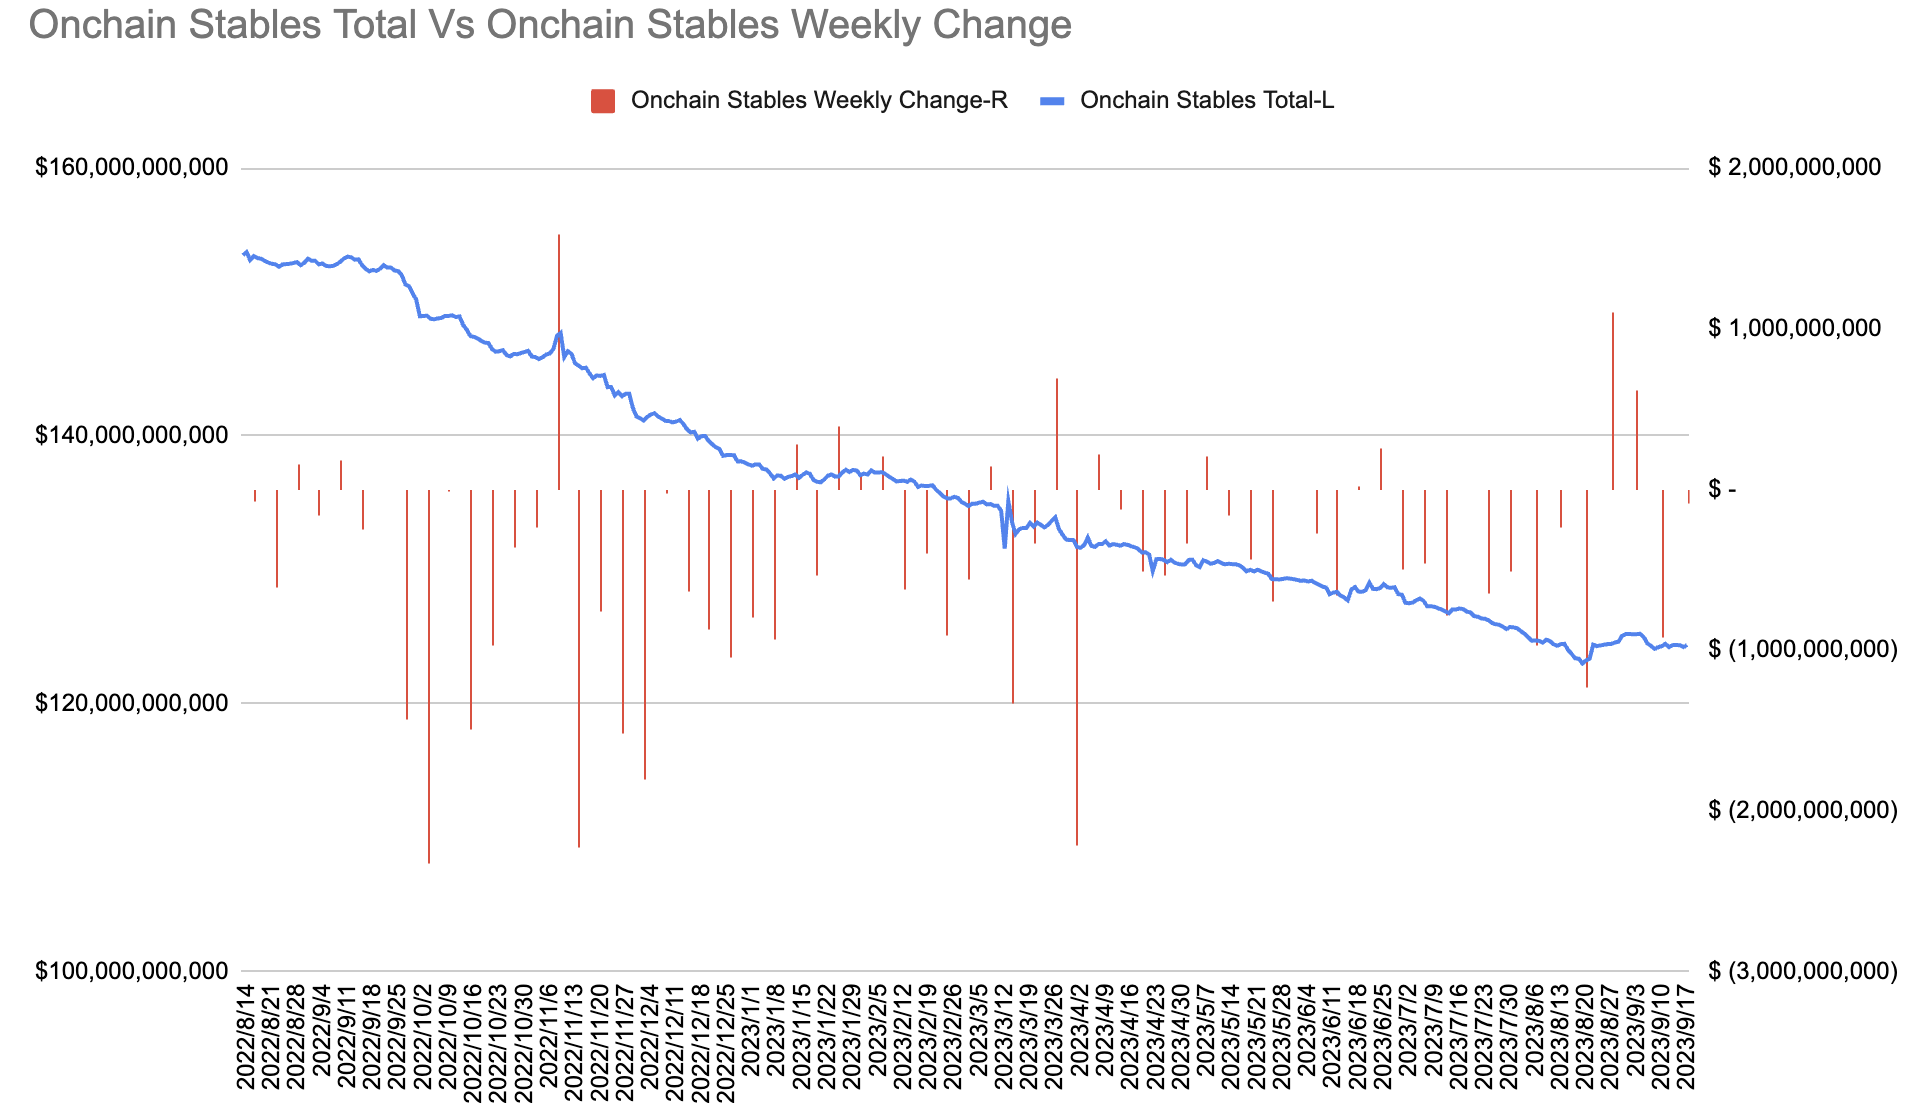
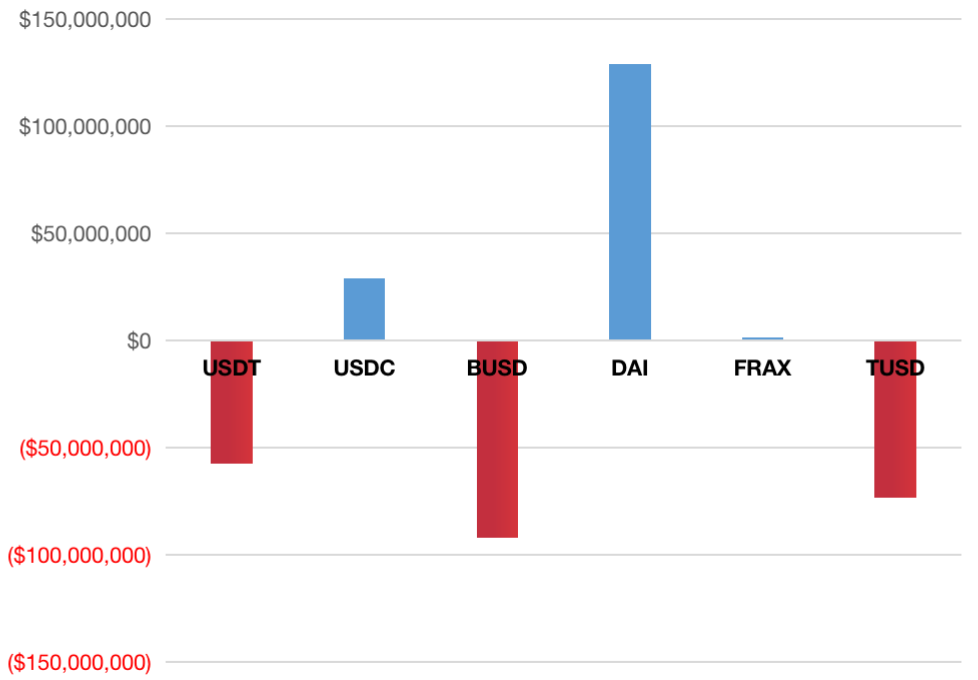
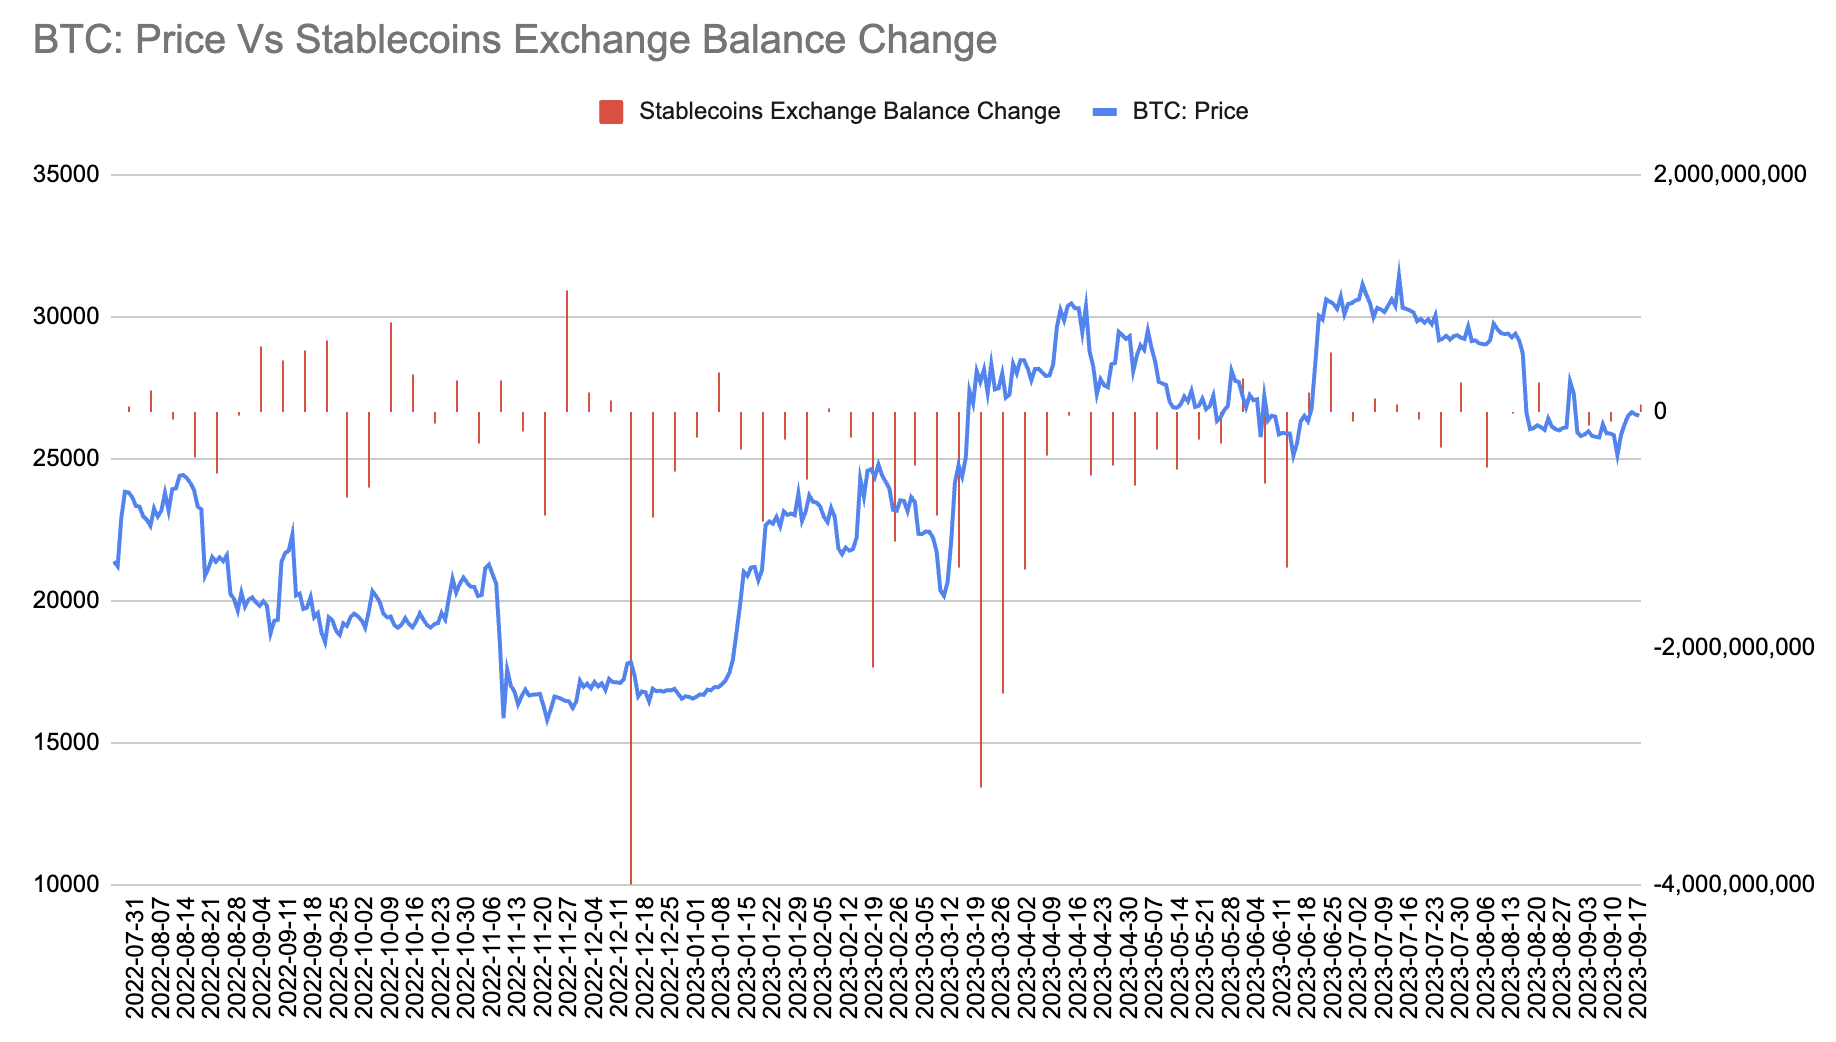 The net outflow of stablecoins on the chain was US$92 million, and the total amount fell to US$124.3 billion. The outflow was mainly contributed by BUSD, USDT, and TUSD, and the inflow was mainly contributed by DAI and USDC:
investor sentiment
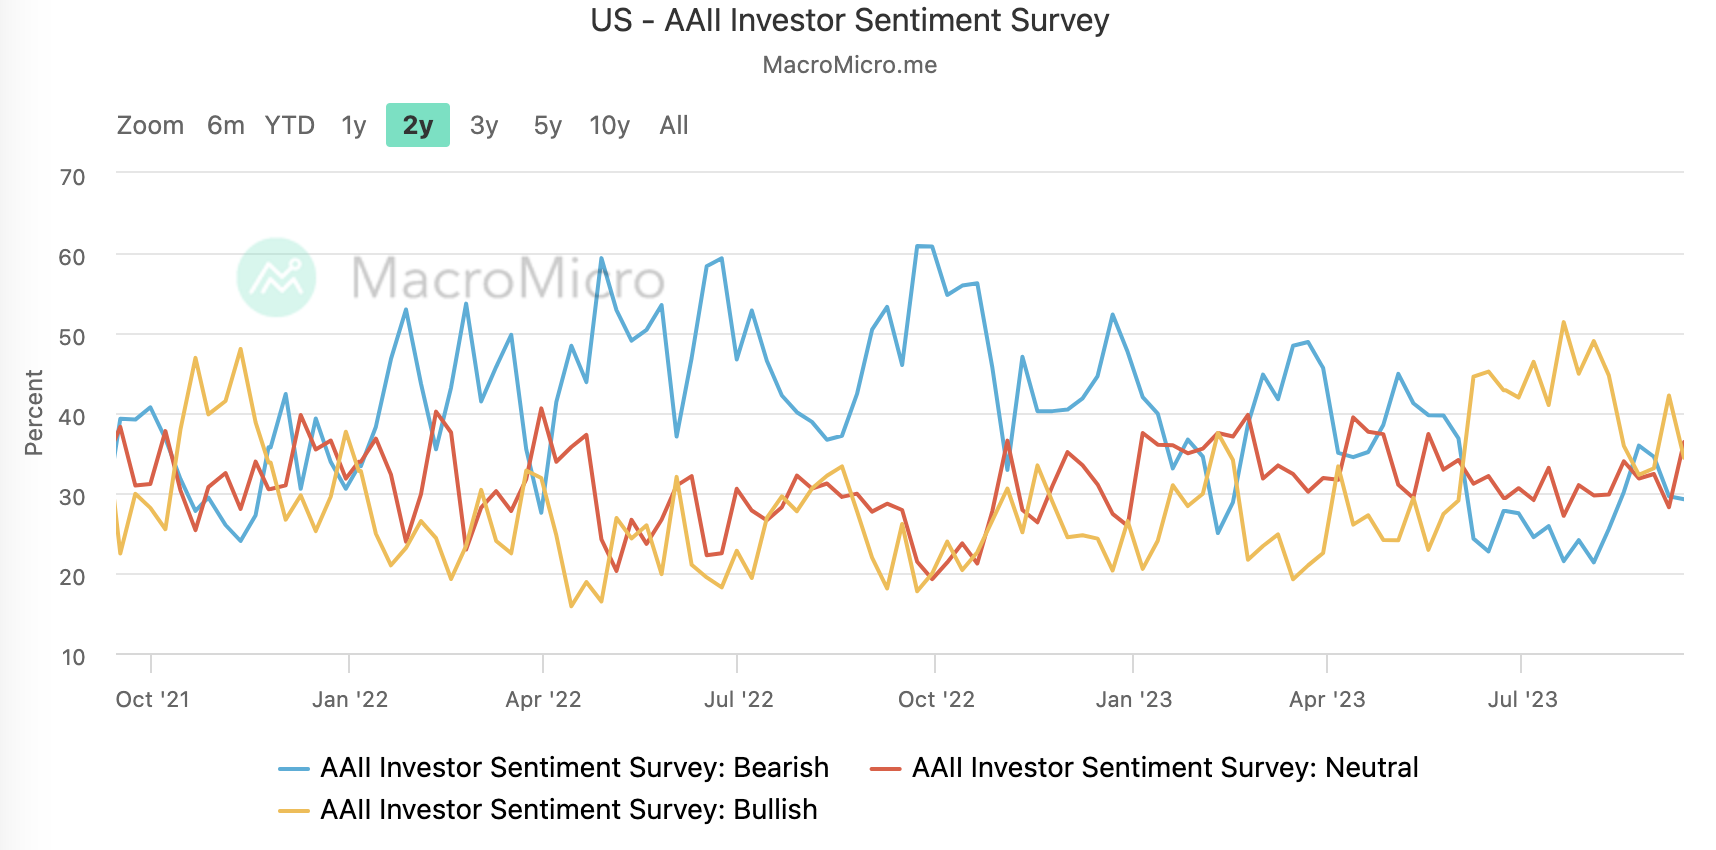
The proportion of neutral views in the AAII survey last week rose to 36%, the proportion of bullish views fell to 34%, and the proportion of bearish views remained unchanged:
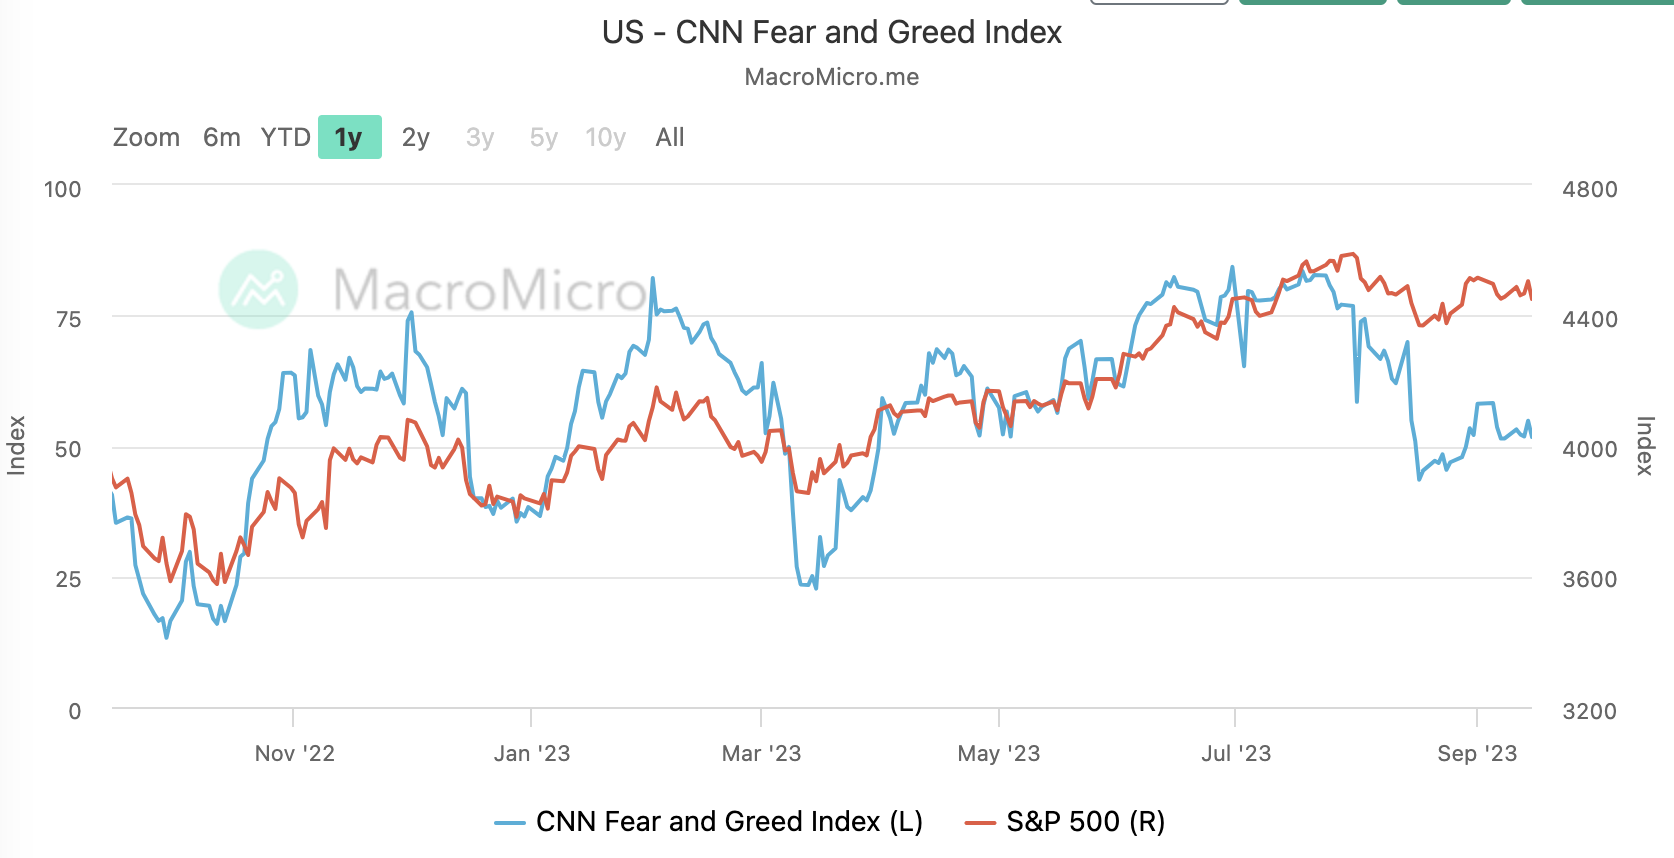
The CNN Fear and Greed Index was little changed and remains near a neutral level of 51:
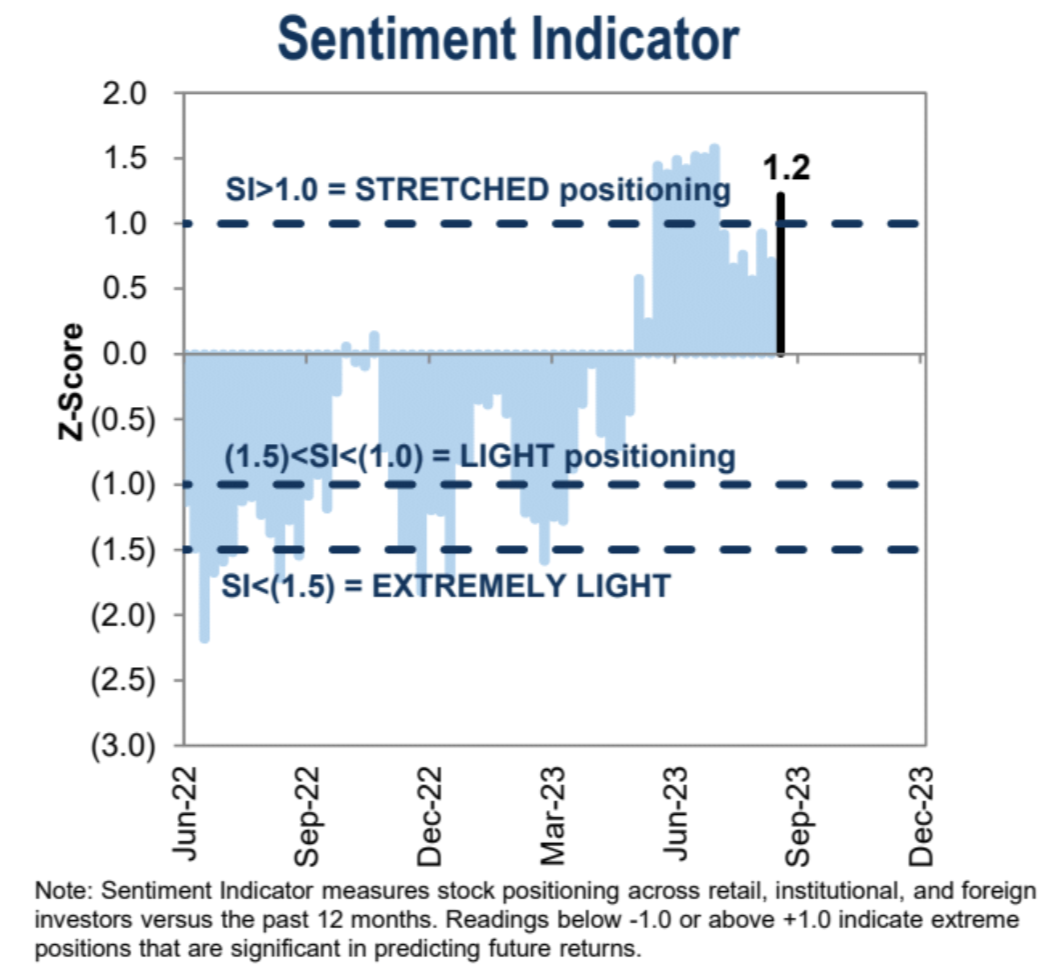
Goldman Sachs’ institutional positioning sentiment indicator jumped sharply to 1.2 in the streched range:
Follow this week
This week is a central bank super week, with the central banks of the United States (unchanged), the United Kingdom (+25 bp expected), Switzerland (+25 bp expected), and Japan (unchanged) collectively on the stage. The main focus will be Wednesdays Federal Open Market Committee (FOMC) meeting. The Fed is widely expected to keep interest rates steady after raising interest rates in July, but will emphasize in its forecasts and communications that further tightening is still possible this year. Data this week is thin and focused on housing. It is unlikely to have a significant impact on the message at the Fed meeting.
The statement from the meeting is likely to show mixed progress on the conditions needed to pause further interest rate increases, including modest growth in economic activity and signs of improving inflation, but the labor market remains tight.
The summary of economic forecasts is likely to show upward revisions to growth forecasts, especially for 2023, but a slight downward revision to inflation forecasts, considering the PCE number has hit the 3.2% forecast in June. In terms of interest rates, the Feds SEP in June showed that the final federal funds interest rate peaked at 5.6% in 2023 and is expected to drop to 4.6% in 2024 and 3.4% in 2025. The long-term interest rate is 2.5%. Given developments in the last three months of data, it seems likely that the 5.6% forecast for 2023 will remain unchanged or be revised slightly downward, while the median rate in 2024 and 2025 may remain unchanged or rise slightly.
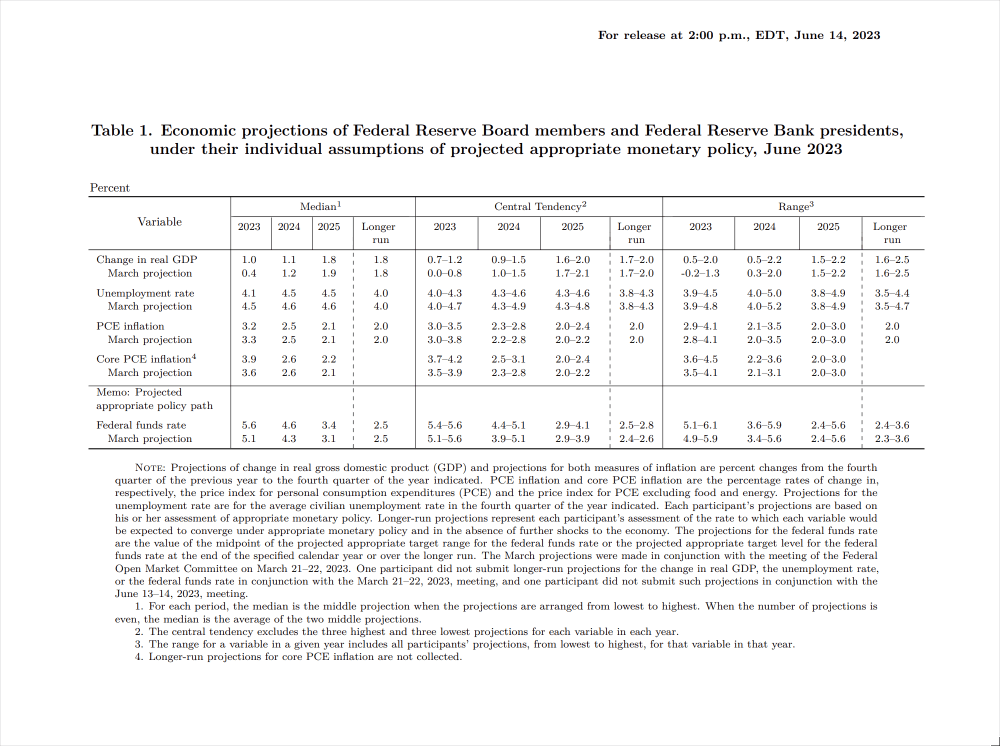
While long-term interest rates remained at 2.5% after the June meeting, their central trend shifted from 2.4% -2.6% to a 2.5% -2.8% range. This suggests that the Fed may believe that the neutral interest rate (a rate that neither stimulates nor restricts economic activity) may be higher than before, with the 2% inflation target implying a real interest rate of 0.5%.
Looking at the bond market, the 30-year Treasury bond yield is about 4.2%, subtracting the Feds inflation target of 2% to get an actual interest rate of 2.2%, which is much higher than the Feds expectations. So, the bond market is relatively aggressively priced, while lower earnings yields and higher P/E ratios on the equity side suggest that stocks still dont believe the Feds message that interest rates must remain restrictive for some time.
Looking at the interest rate derivatives market, the short-term path is almost exactly the same as that of the Federal Reserve, with the highest policy interest rate being 5.45%, and the interest rate will drop to around 4.6% by the end of 2024, which is what SEP predicted in June:
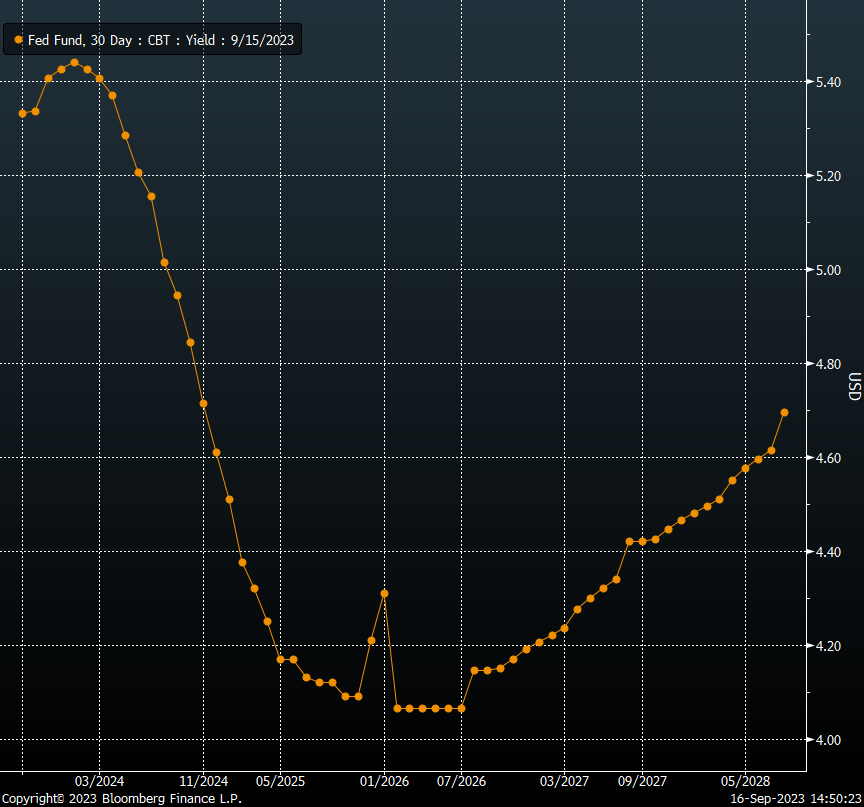
But the long-term path is quite different. Unlike people’s intuitive impression of an “L” shape, the futures market’s interest rate path is a “U” shape. The futures market expects that nominal interest rates will rebound to 4.7% soon after hitting the bottom in 2026, and will drop to around 4.1% by 2026, and continue to rise from there, indicating the difference between the Feds 3.4% expectations in 2025 and traders capital votes. Huge, over 100 bp, long term expected difference over 200 bp.
Who do you want to believe? People who think the Fed is wrong can go short risk assets, and people who think interest rate futures traders are wrong can go long.
In terms of press conferences, Powell is bound to emphasize policys reliance on data and be cautious about declaring an inflation victory, but may note some initial progress in labor market balance. He is unlikely to make clear the timing of further rate hikes.
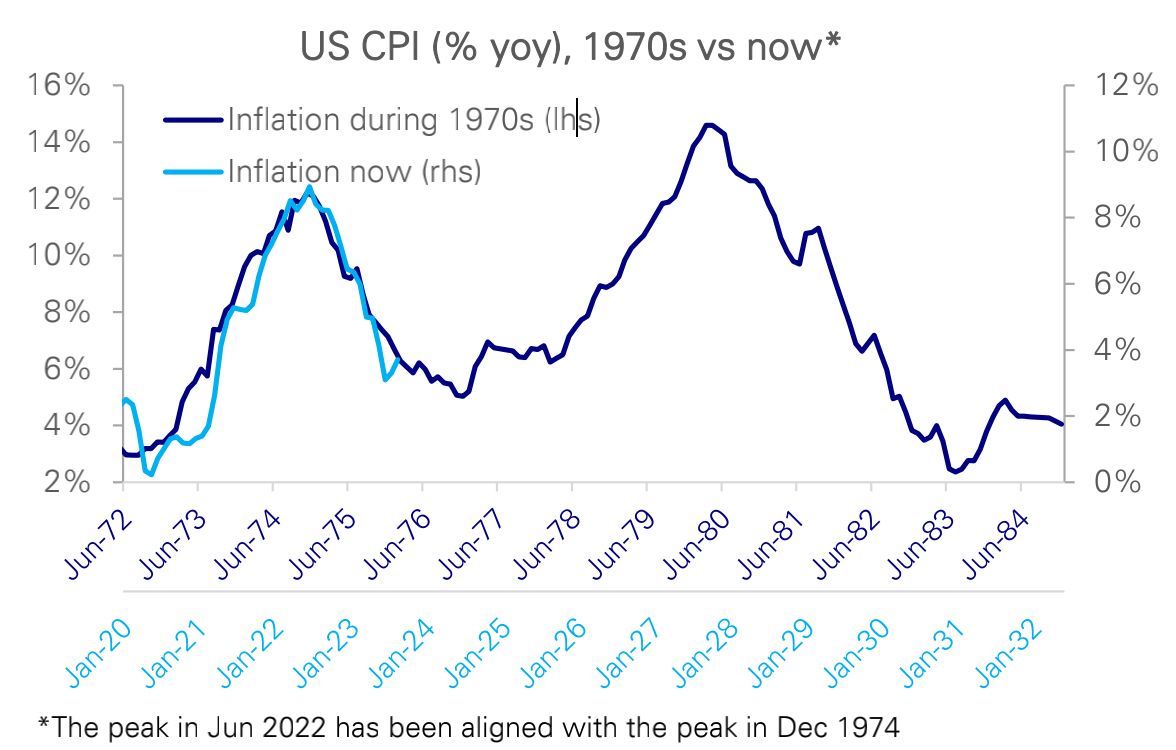
Why officials have been cautious? The second rebound in inflation has always been a concern for older officials. Young people who have not experienced the 1970s may not be able to understand it. This historical background will limit the extent of any potential interest rate cuts:
Of course, it’s already difficult enough to try to predict one month into the future, let alone two or three years from now. But the point is that stock and bond markets have diverged in their expectations of future interest rate trends. While stocks appear to be betting on multiple rate cuts from the Fed in the future, bond markets have different expectations. As the Fed updates information next week, the most noteworthy point is whether there will be any changes in the expected sharp interest rate cuts next year. Whether the bond market will be pulled back or the stock market will be pulled back is the core game of the market.


