Coingecko: 2022 Crypto Market Annual Report
The entire world is in a difficult situation right now, and in such a difficult context, rediscovering its core values is the top priority after the crypto industry suffers a major setback in 2022. Crucially, trust and credibility need to be re-established; at the same time, efforts need to be redoubled to increase Crypto's user relevance and usability. 2022 will likely be seen as the year that should be forgotten, but it should also mark an important turning point for an industry. While 2023 may be too early for a full recovery, we believe that the long winter will eventually usher in a decentralized spring. Let's stick together and build the future of Crypto.
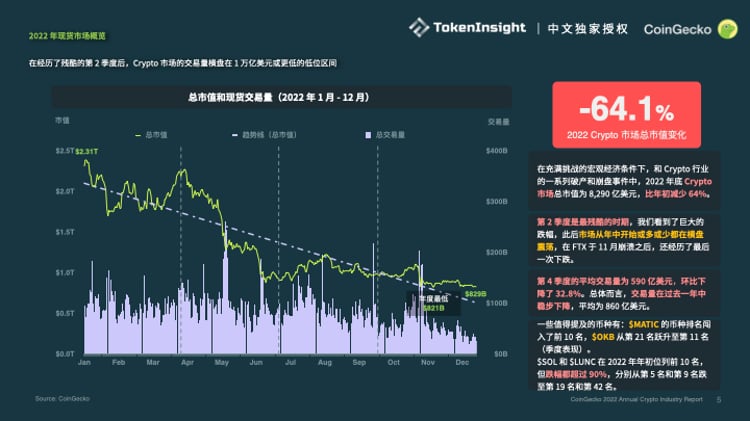
Facts have proved that 2022 will be a turbulent year for projects and users in the Crypto industry. Crypto winter has come. As of January 1, 2023, the total market capitalization of Crypto is 829 billion US dollars, down 64% from a year ago. While DeFi token prices and market demand for NFTs remain subdued, developers have continued to develop innovative protocols, sparking new trends and narratives over the past year.
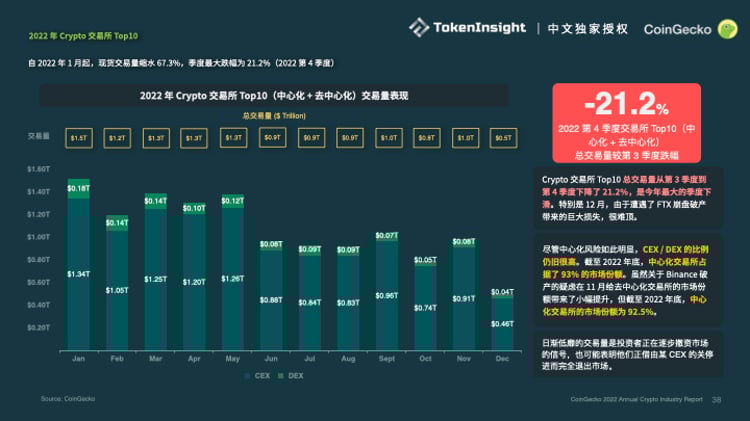
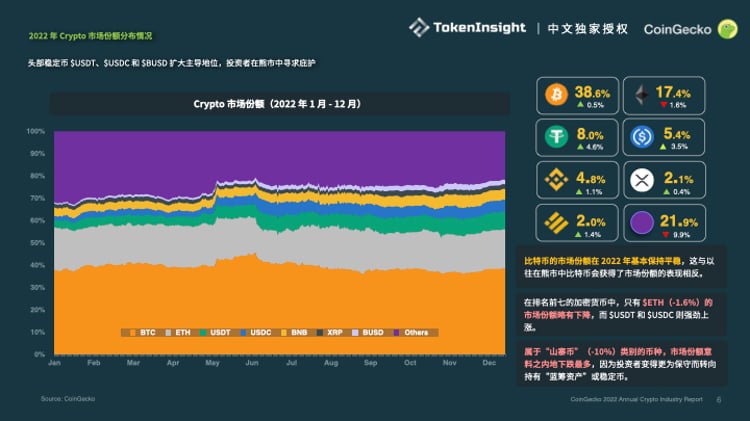
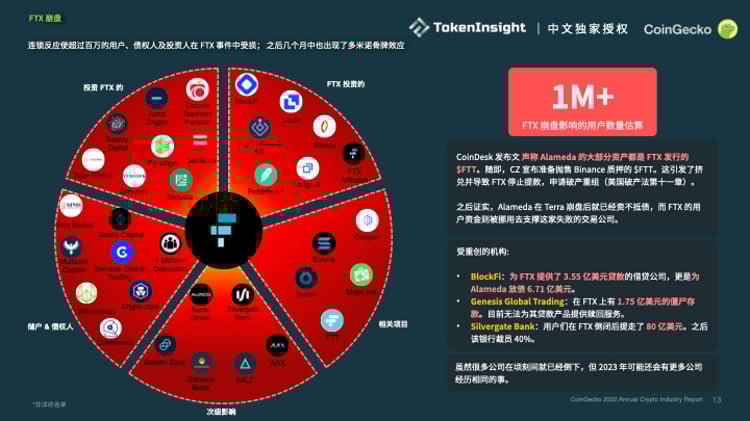
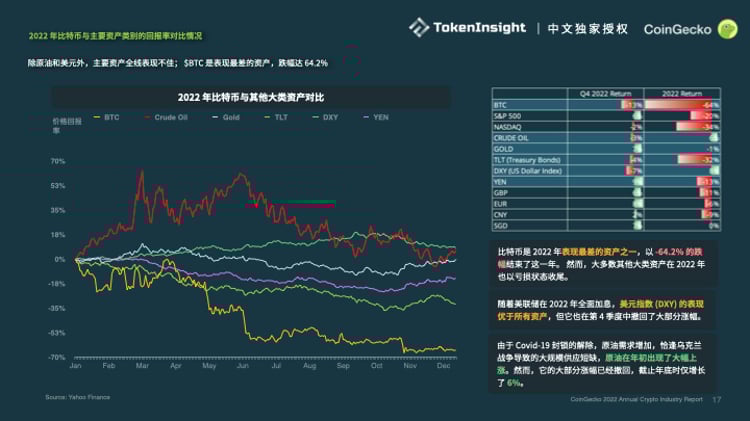
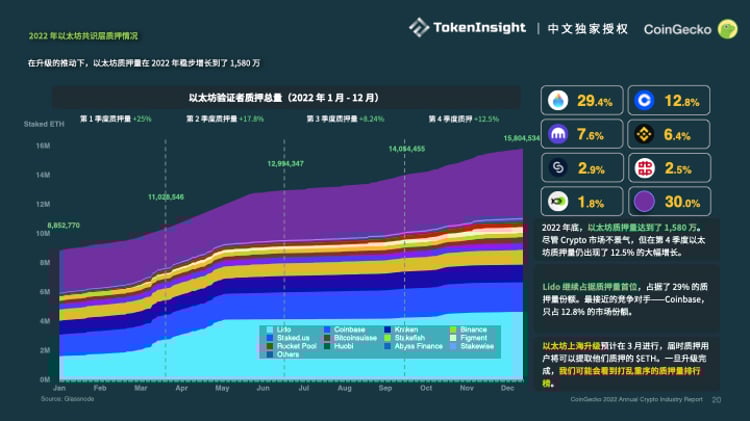
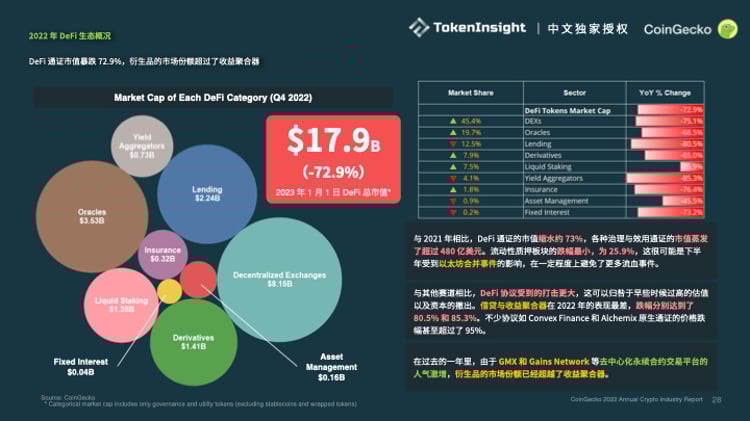
Our 2022 Annual Crypto Industry Report covers everything from an overview of the Crypto market to analyzing Bitcoin and Ethereum, an in-depth look at Decentralized Finance (DeFi) and non-fungible tokens (NFT) ecosystem and reviewed centralized exchanges (CEX) and decentralized exchanges (8 Highlights from CoinGecko's 2022 Annual Crypto Industry Report Here is a summary of key points for the Crypto industry in 2022: The crypto market has been trading sideways after the second quarter of 2022, in the low range of $1 trillion and below. Despite the increase in stablecoin dominance, the market cap has shrunk by $27.3 billion; meanwhile, USDC and BUSD have gained in market cap. The FTX contagion affected approximately over 1 million users, creditors and investors, with more to come. Except for crude oil and the US dollar, mainstream assets underperformed across the board. BTC was the worst performing asset, down 64.2%. Driven by Ethereum's upgrade to Merge, by the end of 2022, the amount of ETH pledged will grow steadily to 15.8 million quarterly. The market value of DeFi tokens (excluding stablecoins and wrapped tokens) plummeted 72.9%, and the market share of derivatives exceeded that of yield aggregators. In the first cold winter of the NFT market, OpenSea's market share fell to 65.4%, but it still dominates Spot trading volume shrank by 67.3% from January 2022, with the largest decline of 21.2% in the fourth quarter. Amid challenging macroeconomic conditions and a series of bankruptcies and crashes in the Crypto industry, the end of 2022Crypto Market Total Market CapIt was 829 billion US dollars, a decrease of 64% from the beginning of the year. Q2 was the most brutal period, with huge declines. The market then went sideways until November 2022 when FTX crashed. The average transaction volume in Q4 was $59.0 billion, down 32.8% QoQ. Overall, deal volume has declined steadily over the past year, averaging $86 billion. The trend of the Crypto market is closely related to the trend of the US stock market, especially the S&P 500 index in the first three quarters of 2022. In Q4, however, this correlation turned negative, as FTX led to a decline in Crypto, while the stock staged a recovery towards the end of the year. andTether(USDT)、USD Coin(USDC)andBinance USD(BUSD)Increasing dominance in the Crypto market. However, the stablecoin market was not immune to outflows either, with a total loss of $27.3 billion (16.6%) by the end of the year. Most of these losses are in May 2022TerraUSD(UST)generated during the crash. The industry has performed relatively well since then, despite the periodic "black rumors" caused by another breakaway event. The market capitalization of the largest stablecoin, $USDT, fell by 16% to about $12 billion. On the contrary, $USDC and $BUSD have each increased by a certain amount, about 2 billion US dollars each. The leading decentralized stablecoin$DAI(-43%) and$FRAX(-44%) has a similar percentage loss, though $DAI's $4 billion loss in absolute terms is almost 5 times that of $FRAX. Outside the top 5,$USDNDropped out of the top 15 after breaking anchor in November, driven by$MIMATICtook its place.$USDDLaunched in May, it now sits at No. 8, with a market cap that has hovered around $700 billion since June. CoinDesk release claims that most of Alameda's assets are issued by FTX $FTT. Immediately, CZ announced that it was ready to sellBinanceStaked $FTT. This triggered a run and caused FTX to stop withdrawals and file for Chapter 11 bankruptcy. It was later confirmed that Alameda was insolvent after Terra's crash, while FTX user funds were embezzled to prop up the failed trading firm. Some examples of hard-hit institutions include: BlockFi: The lending company that provided $355 million in loans to FTX and $671 million in loans to Alameda. Genesis Global Trading: $175M Zombie Deposits on FTX. Redemption services are not currently available for its loan products. Silvergate Bank: Users Withdraw $8 Billion After FTX Collapses. The bank has since laid off 40% of its workforce. While many companies have collapsed in an instant, 2023 is likely to experience the same for many more. bitcoinbitcoinwas the worst performer of these assets, ending the year with a -64.2% loss. With the Federal Reserve raising interest rates across the board in 2022, the U.S. dollar index (DXY) has outperformed all assets. However, most of its gains were lost in the fourth quarter as rate hikes slowed; DXY fell -7.4% quarter-over-quarter and returned just 8.0% year-to-date. Crude saw a sharp rise at the start of the year as higher demand from the lifting of the Covid-19 lockdown coincided with a massive supply shortage caused by the war in Ukraine. However, it has given back most of its gains, ending the year up just 6.4%. Despite the downturn in the Crypto market,Ethereum (ETH)The total pledged volume of cryptocurrencies showed steady quarterly growth, increasing by 25% in the first quarter of 2022, by 17.8% in the second quarter, by 8.2% in the third quarter, and by 12.5% in the fourth quarter. Total stakes on Ethereum rose from 8.8 million to 15.8 million by the end of the year. The rise in the number of validators staking ETH in the first half of 2022 may be due to the bullish sentiment for the Ethereum merger. After a successful merger in mid-September, the Crypto community began to look forward to the upcoming Shanghai upgrade, as the previous merger upgrade drove significant growth last quarter. Lido(LDO)Continue to occupy the first place in the pledge volume, accounting for 29% of the pledge volume. closest competitor -Coinbase, accounting for only 12.8% of the market share. The Ethereum Shanghai upgrade is expected to take place in March, at which time staking users will be able to withdraw their pledged $ETH. Once the upgrade is complete, we may see the staking leaderboard shuffled out of order. Compared with 2021, the market value of DeFi tokens has shrunk by about 73%, and the market value of various governance and utility tokens has evaporated by more than $48 billion.borrow moneyandyield aggregatorandConvex FinanceandAlchemixThe price of native tokens even fell by more than 95%. and GMX(GMX)andGains Network(GNS)The popularity of decentralized perpetual contract trading platforms has surged. NFT marketIt is in the first bear market cycle-the NFT transaction volume on the Top 8 chain plummeted from $13.3 billion in the first quarter to $1.5 billion in the fourth quarter of 2022, a drop of 93.1%. At the same time, royalties for NFT creators have similarly been reduced by 95% since the beginning of the year. In the NFT winter, OpenSea* still dominates, accounting for 65.4% of the NFT market transaction volume, excluding brush volume. While their market share has decreased by 24.3 percentage points since January 2022, the rise of Solana NFTs has boosted Magic Eden's transaction share, rising to 12.5% by the end of 2022. andLooksRare(LOOKS)andX2Y2(X2Y2), OpenSea has defended its dominance. These competitors incentivize users to transact on their platforms by handing out rewards. But users often get these rewards by swiping. In January 2022, 98.5% of the NFT trading volume on LooksRare was brush volume. Thereafter, due to the reduction in incentive emissions, the transaction volume is also reduced to 75.5% in December 2022. *OpenSea volume includes Ethereum, Polygon and Solana In January, the spot trading volume of the Top 10 Crypto exchanges totaled $1.5 trillion. But after FTX collapsed, spot trading volumes fell 67.3% in December to hit a year-low of $0.46 trillion. The biggest drop (q-on-q) occurred in the last quarter, with total spot trading volume falling from $2.9 trillion in Q3 to $2.3 trillion in Q4 2022, a drop of 21.2%. Despite publicly demonstrating the risks of centralization, the CEX:DEX ratio continues to rise. Although the market share of DEX increased slightly in November, benefiting from market concerns that Binance may go bankrupt, by the end of 2022, CEX still accounted for 92.5% of the market share. Original linkCrypto Market Volumes Sideways in Low $1 Trillion Range or Lower After Brutal Q2
Stablecoins gain market share but lose $27.3B in market cap; $USDC and $BUSD grow in value at the same time
The chain reaction caused more than a million users, creditors and investors to be damaged in the FTX incident; there was also a domino effect in the following months
Major assets underperformed across the board except Crude Oil and USD; $BTC was the worst performing asset, down 64.2%
Driven by Upgrades, Ethereum Stakes Grow Steadily to 15.8M in 2022
The market value of DeFi tokens plummeted 72.9%, and the market share of derivatives exceeded that of income aggregators
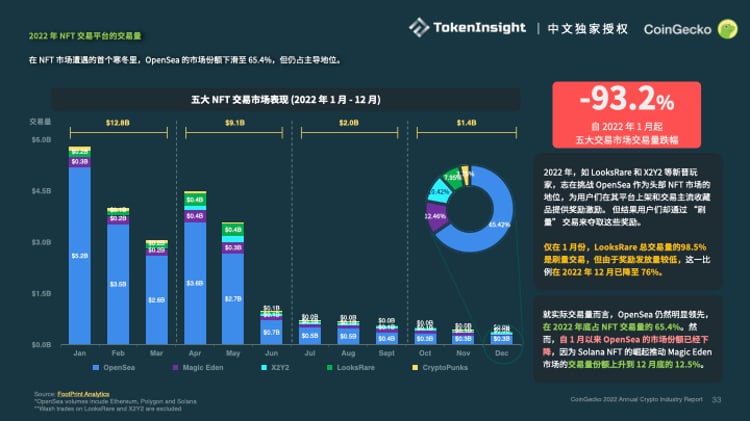
NFT market
Spot trading volume has shrunk by 67.3% from January 2022, with the largest quarter-on-quarter decline of 21.2% in Q4 2022