Ten Key Points of DappRadar's "2022 Dapp Industry Report"
This article comes from DappRadarThis article comes from
, the original report is rather long, and Odaily only extracts and translates its ten main points here.
New and innovative business models built around the idea of decentralization, as well as the accelerated adoption of blockchain technology by traditional industries and enterprises are driving the development of Dapps. Large companies from different industries are exploring how to enter the Web3 world. Despite the harsh crypto winter, we believe the dapp industry is bound to enter 2023 with the resilience honed in 2022.
secondary title
1. Here are the top 10 takeaways from the 2022 Dapp Industry ReportIn 2022, the number of unique wallets (dUAW) in the Dapp space will increase by 50%, from 1.58 million in 2021 to 2.37 million in 2022.
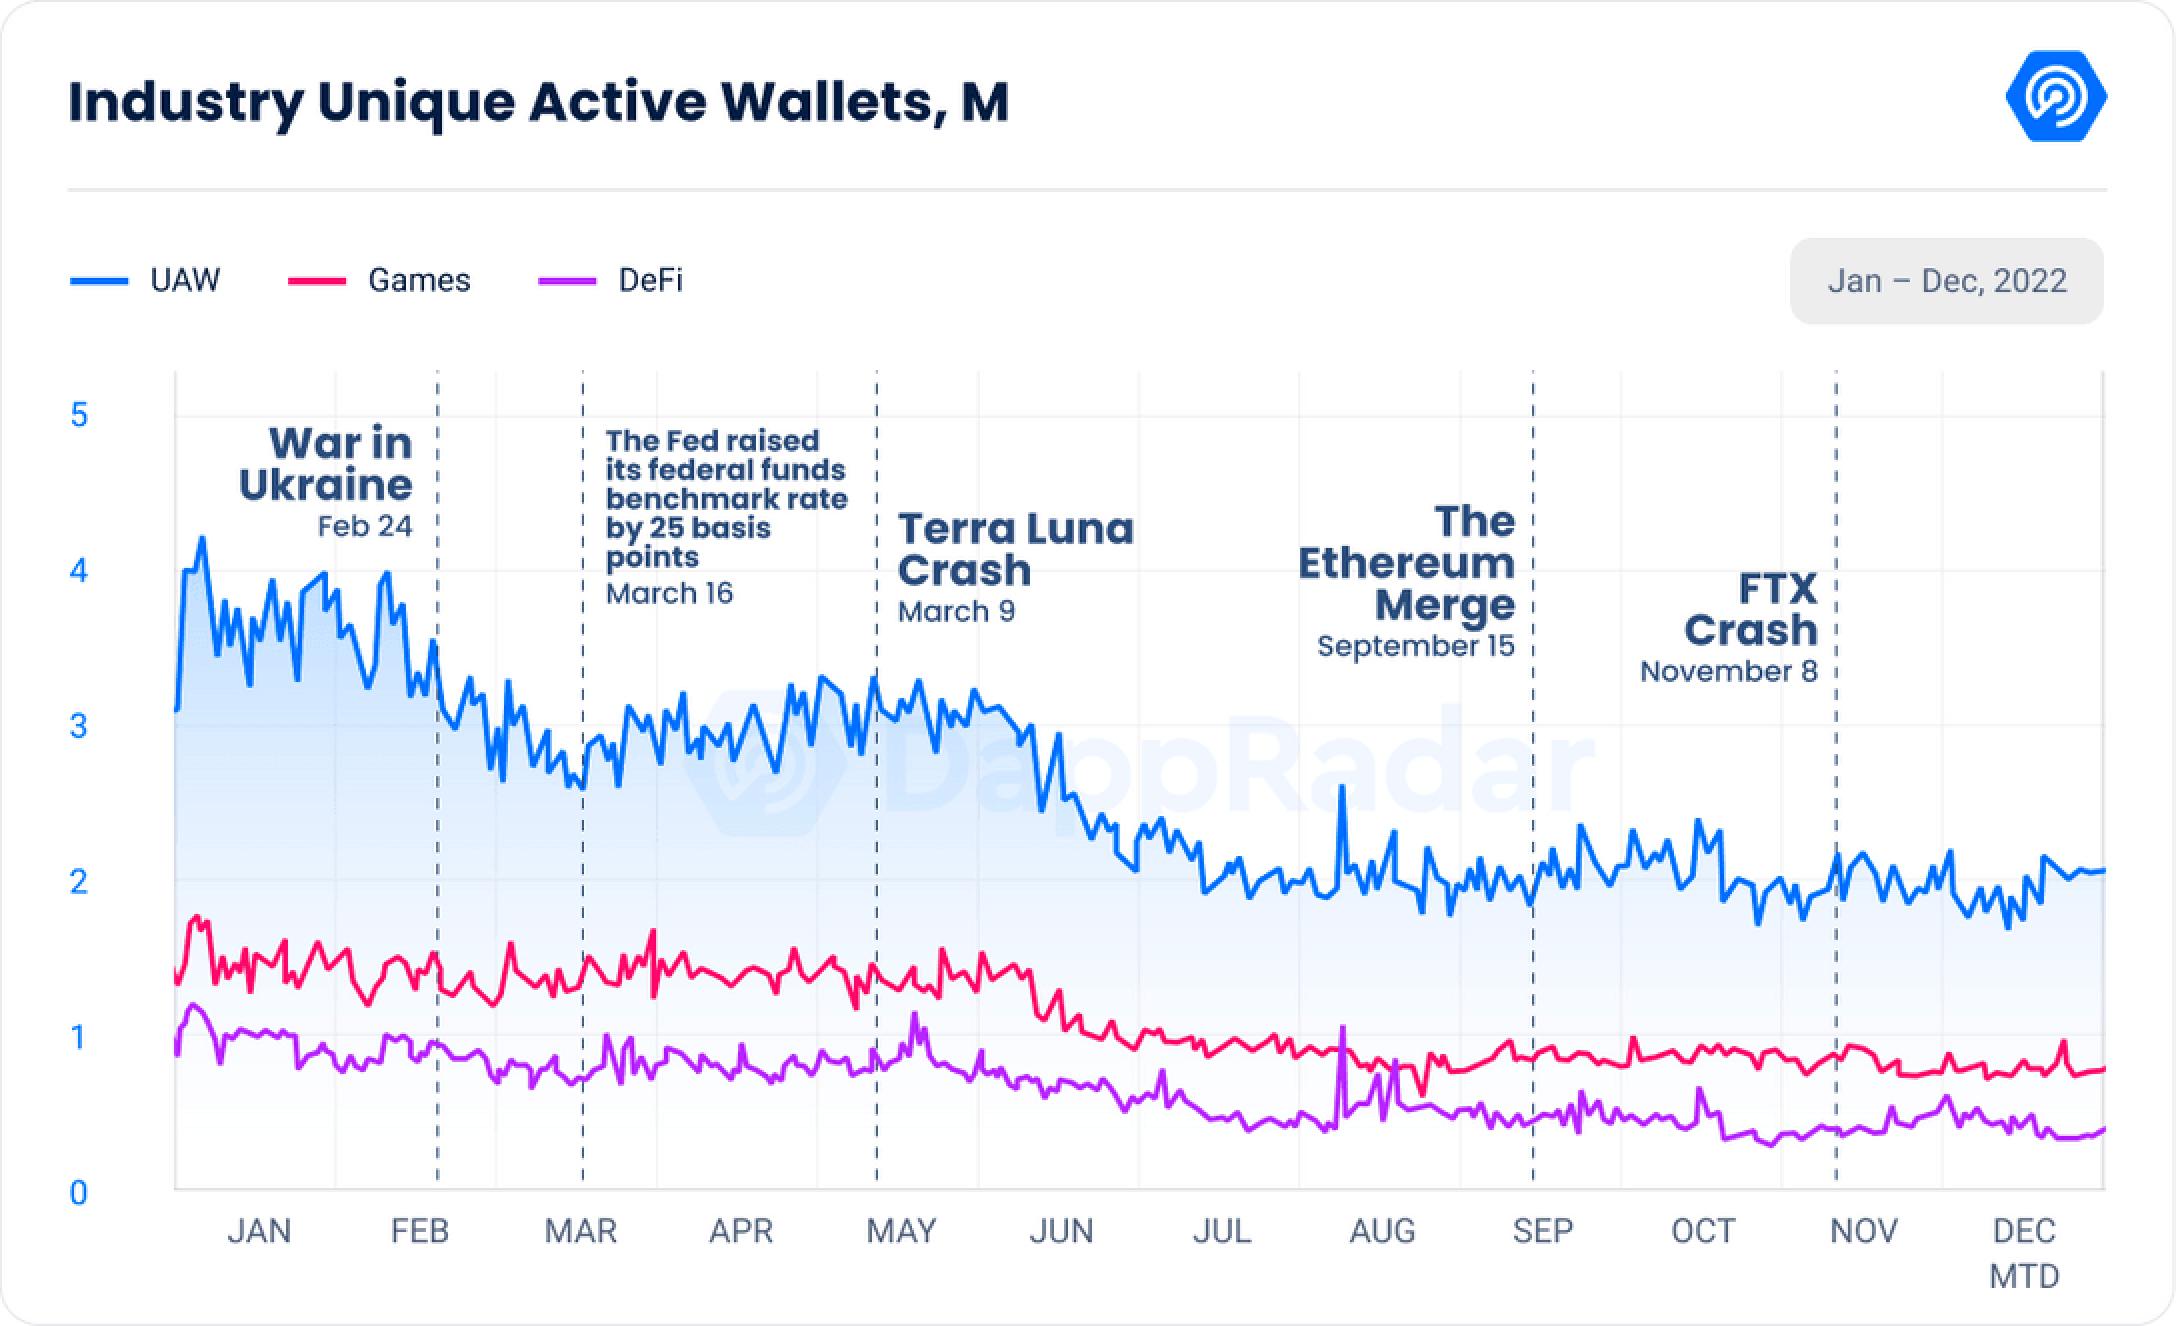
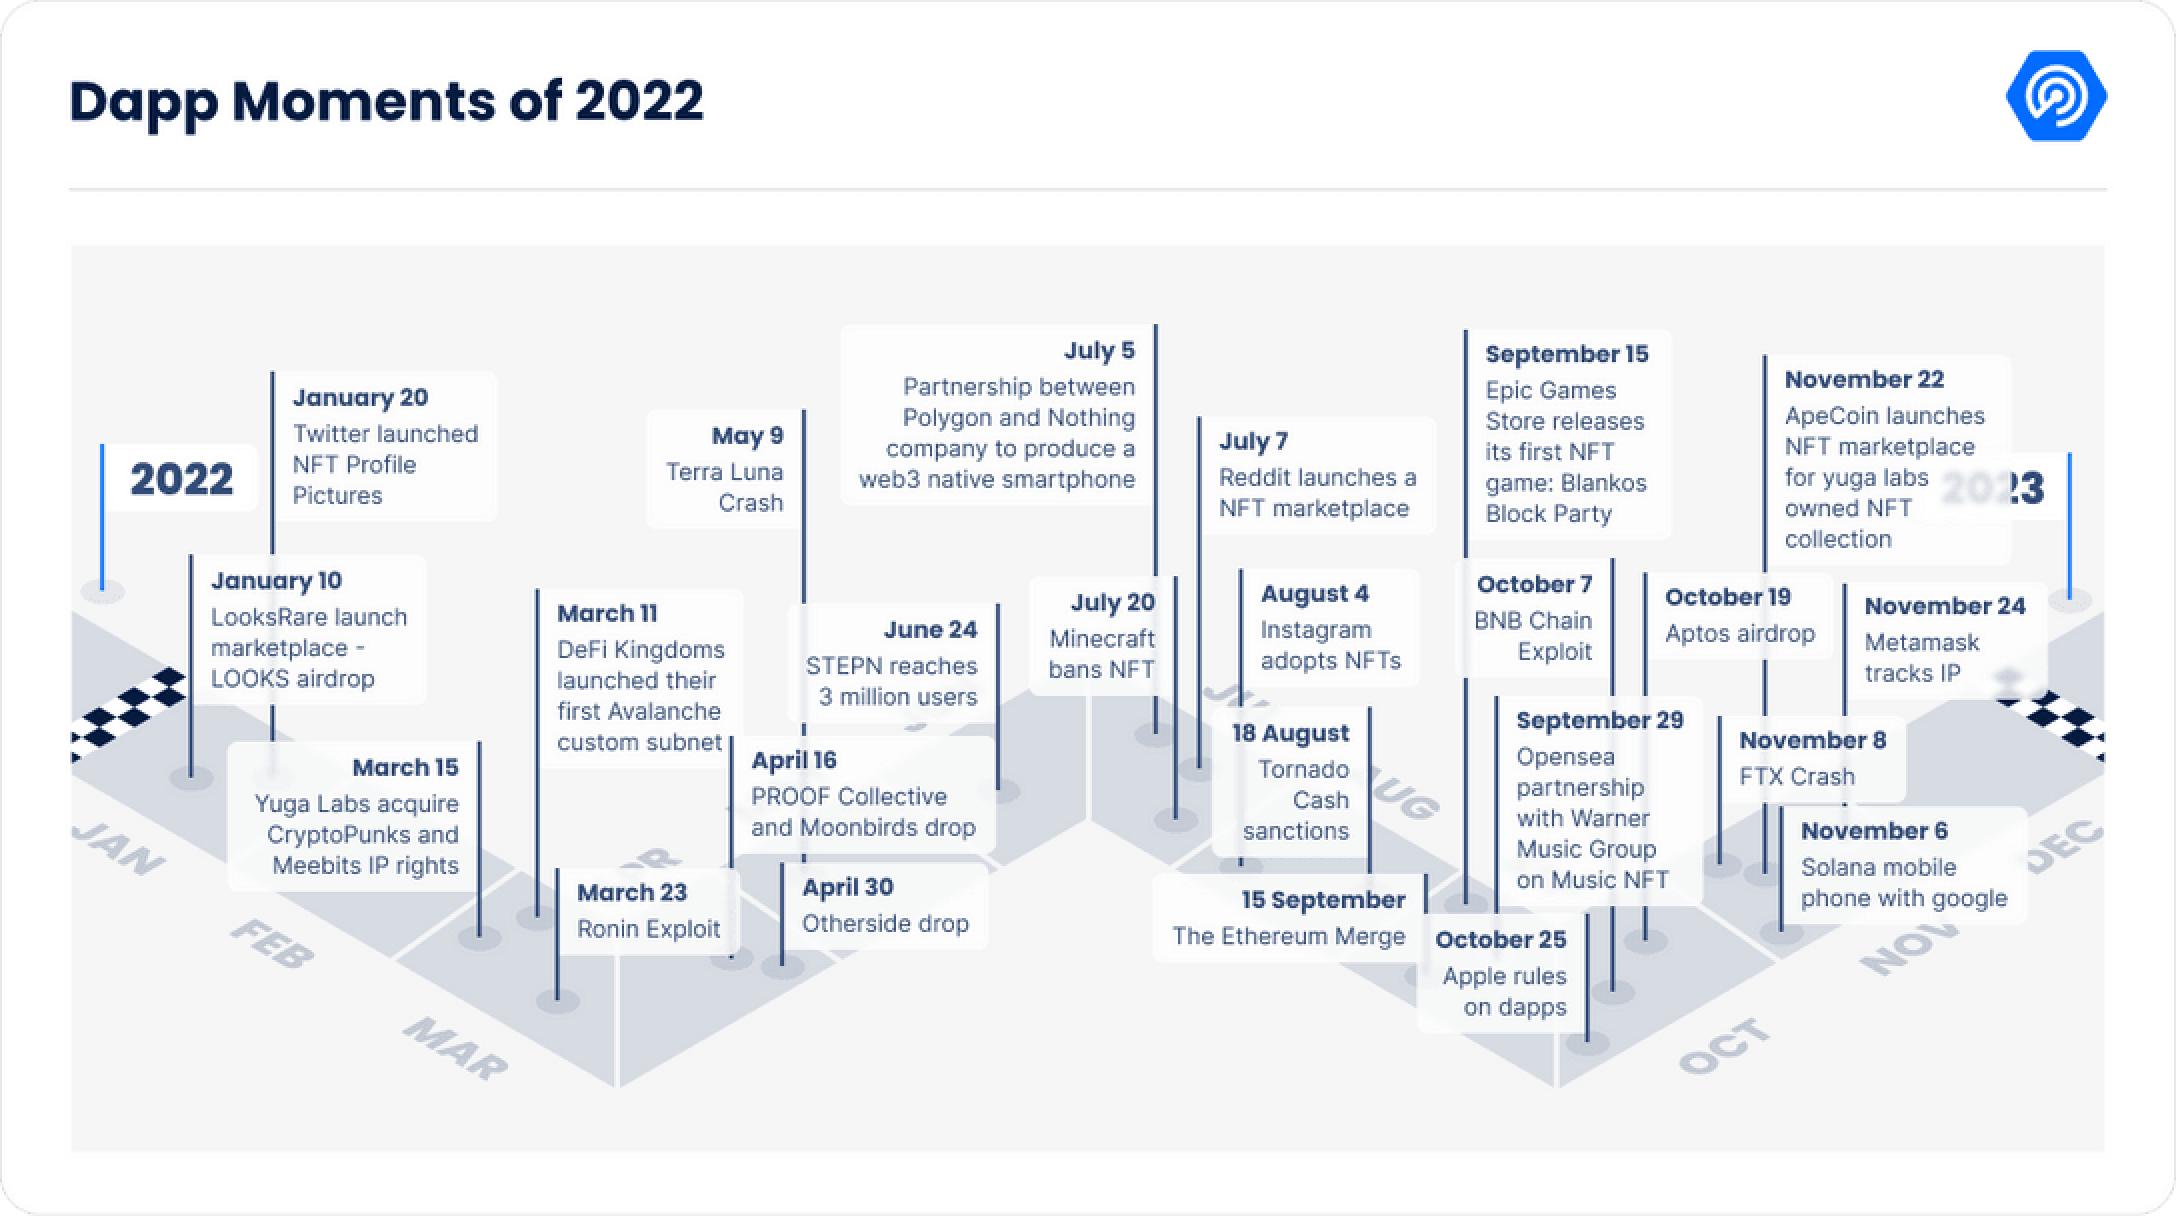
However, the industry has been on a downtrend due to various events, including the war in Ukraine, the Terra Luna thunderstorm, and the FTX crash. Despite these challenges, the Dapp industry has shown its resilience and maturity, and the adoption of blockchain technology by consumers and businesses suggests a promising future for the industry.2. In 2022,The DeFi industry faced challenges including the collapse of the Terra Luna platform and the drop in cryptocurrency prices, which caused TVL (Total Value Locked) to drop by a massive 73.97% in December to $55 billion.
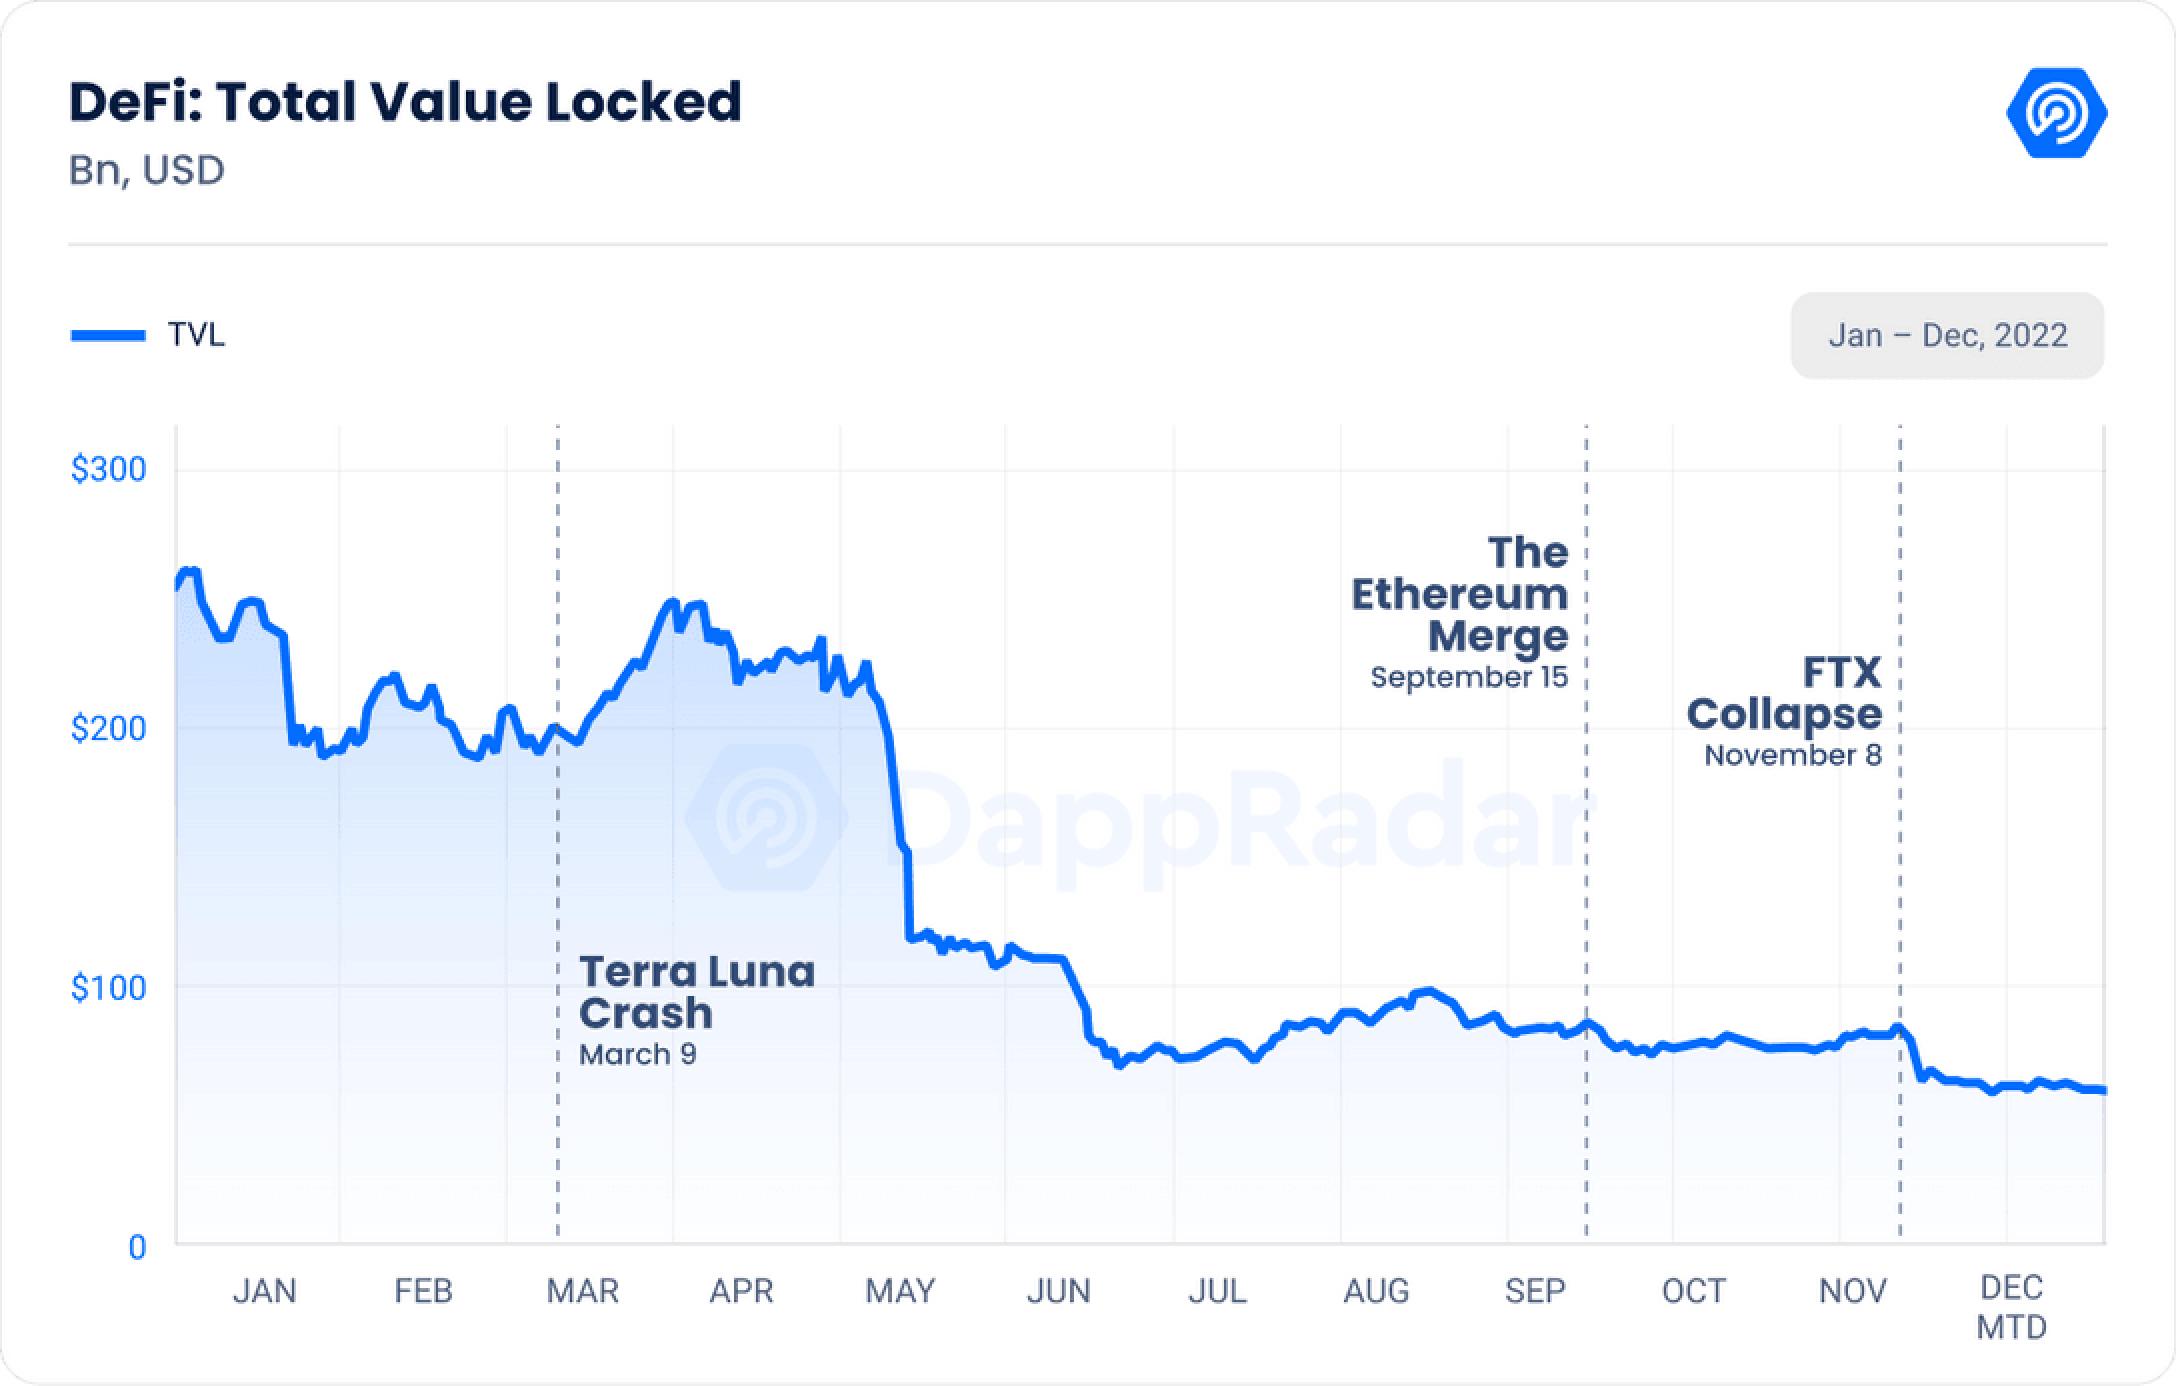
The DeFi field is facing difficulties, continuing to expand and innovate, building smart contract financial applications and adopting traditional financial institutions to pilot or use DeFi protocols for transactions.3. Ethereum is still the dominant DeFi protocol, with a TVL value of $32.12 billion, down 74.56%.BNB Chain Reclaims Its Position as the Second Largest DeFi Ecosystem, down 62.50 percent to $6.5 billion.L2 solutions appear least affected by crypto turmoil
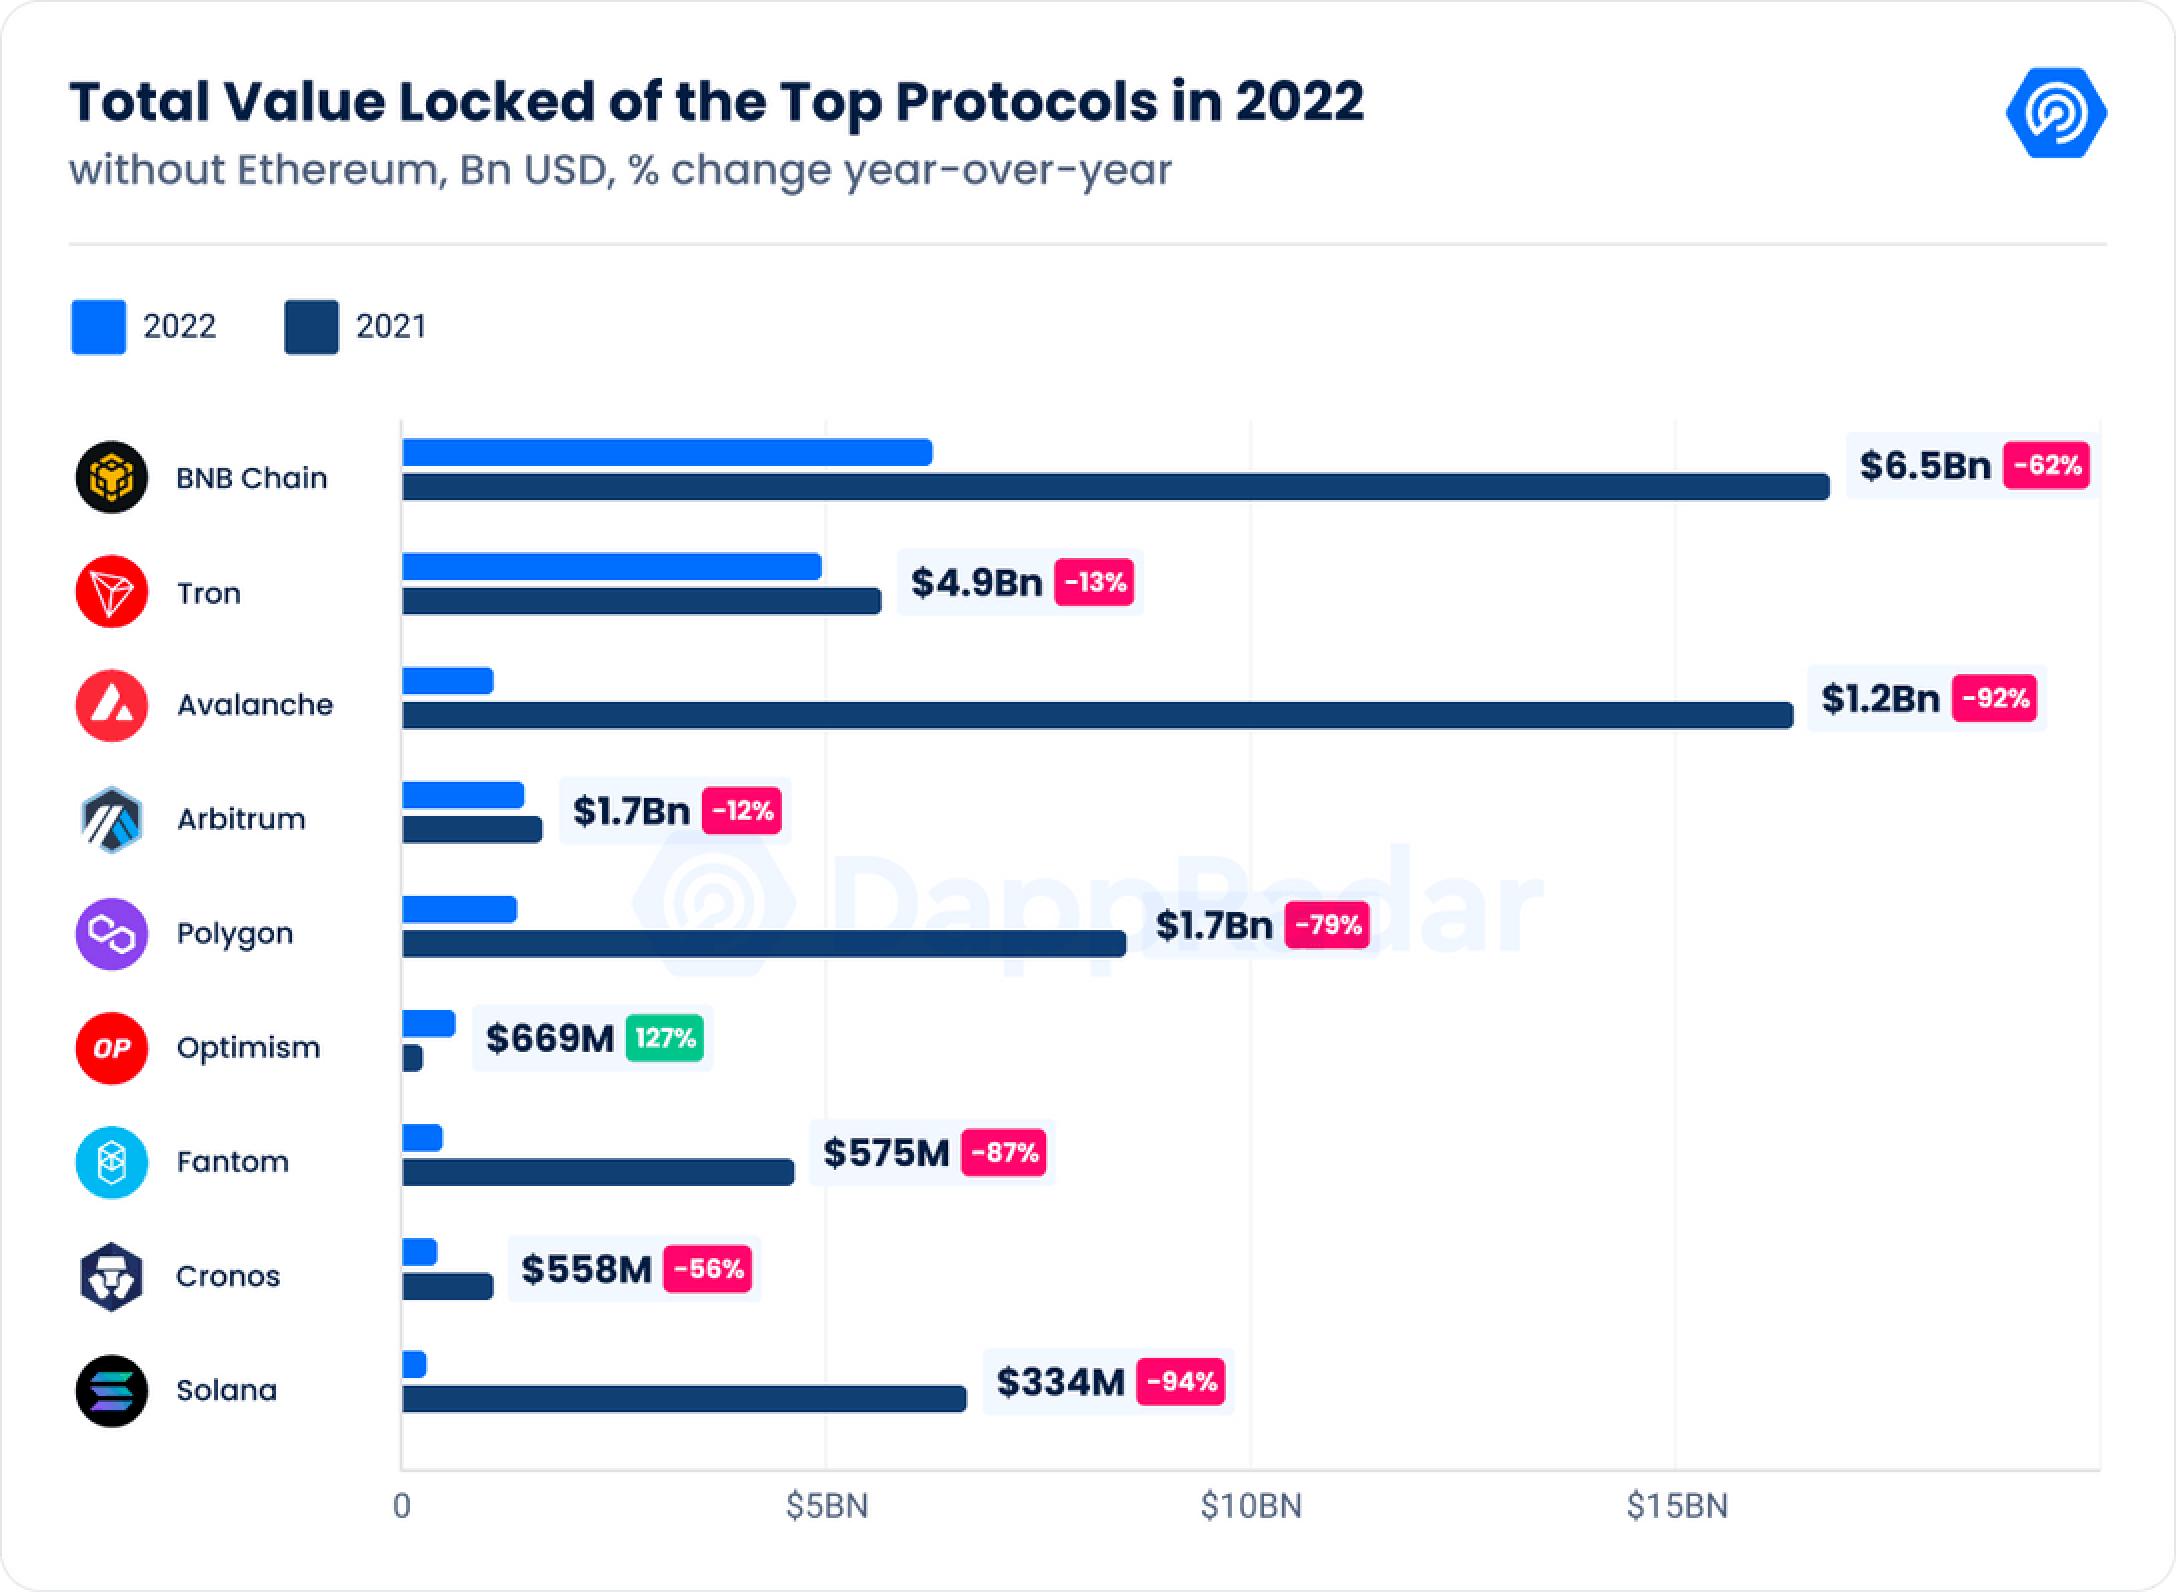
, Arbitrum fell 12.07 percent to $1.74 billion. Optimism's TVL rose 127.60% to $669 million.4. The on-chain indicators of the NFT market this year show positive signals, compared with 2021,The volume of NFT transactions in 2022 will only increase by 0.41%, and the number of independent traders will increase by 876.89% year-on-year to 10.6 million. Sales are also on the rise
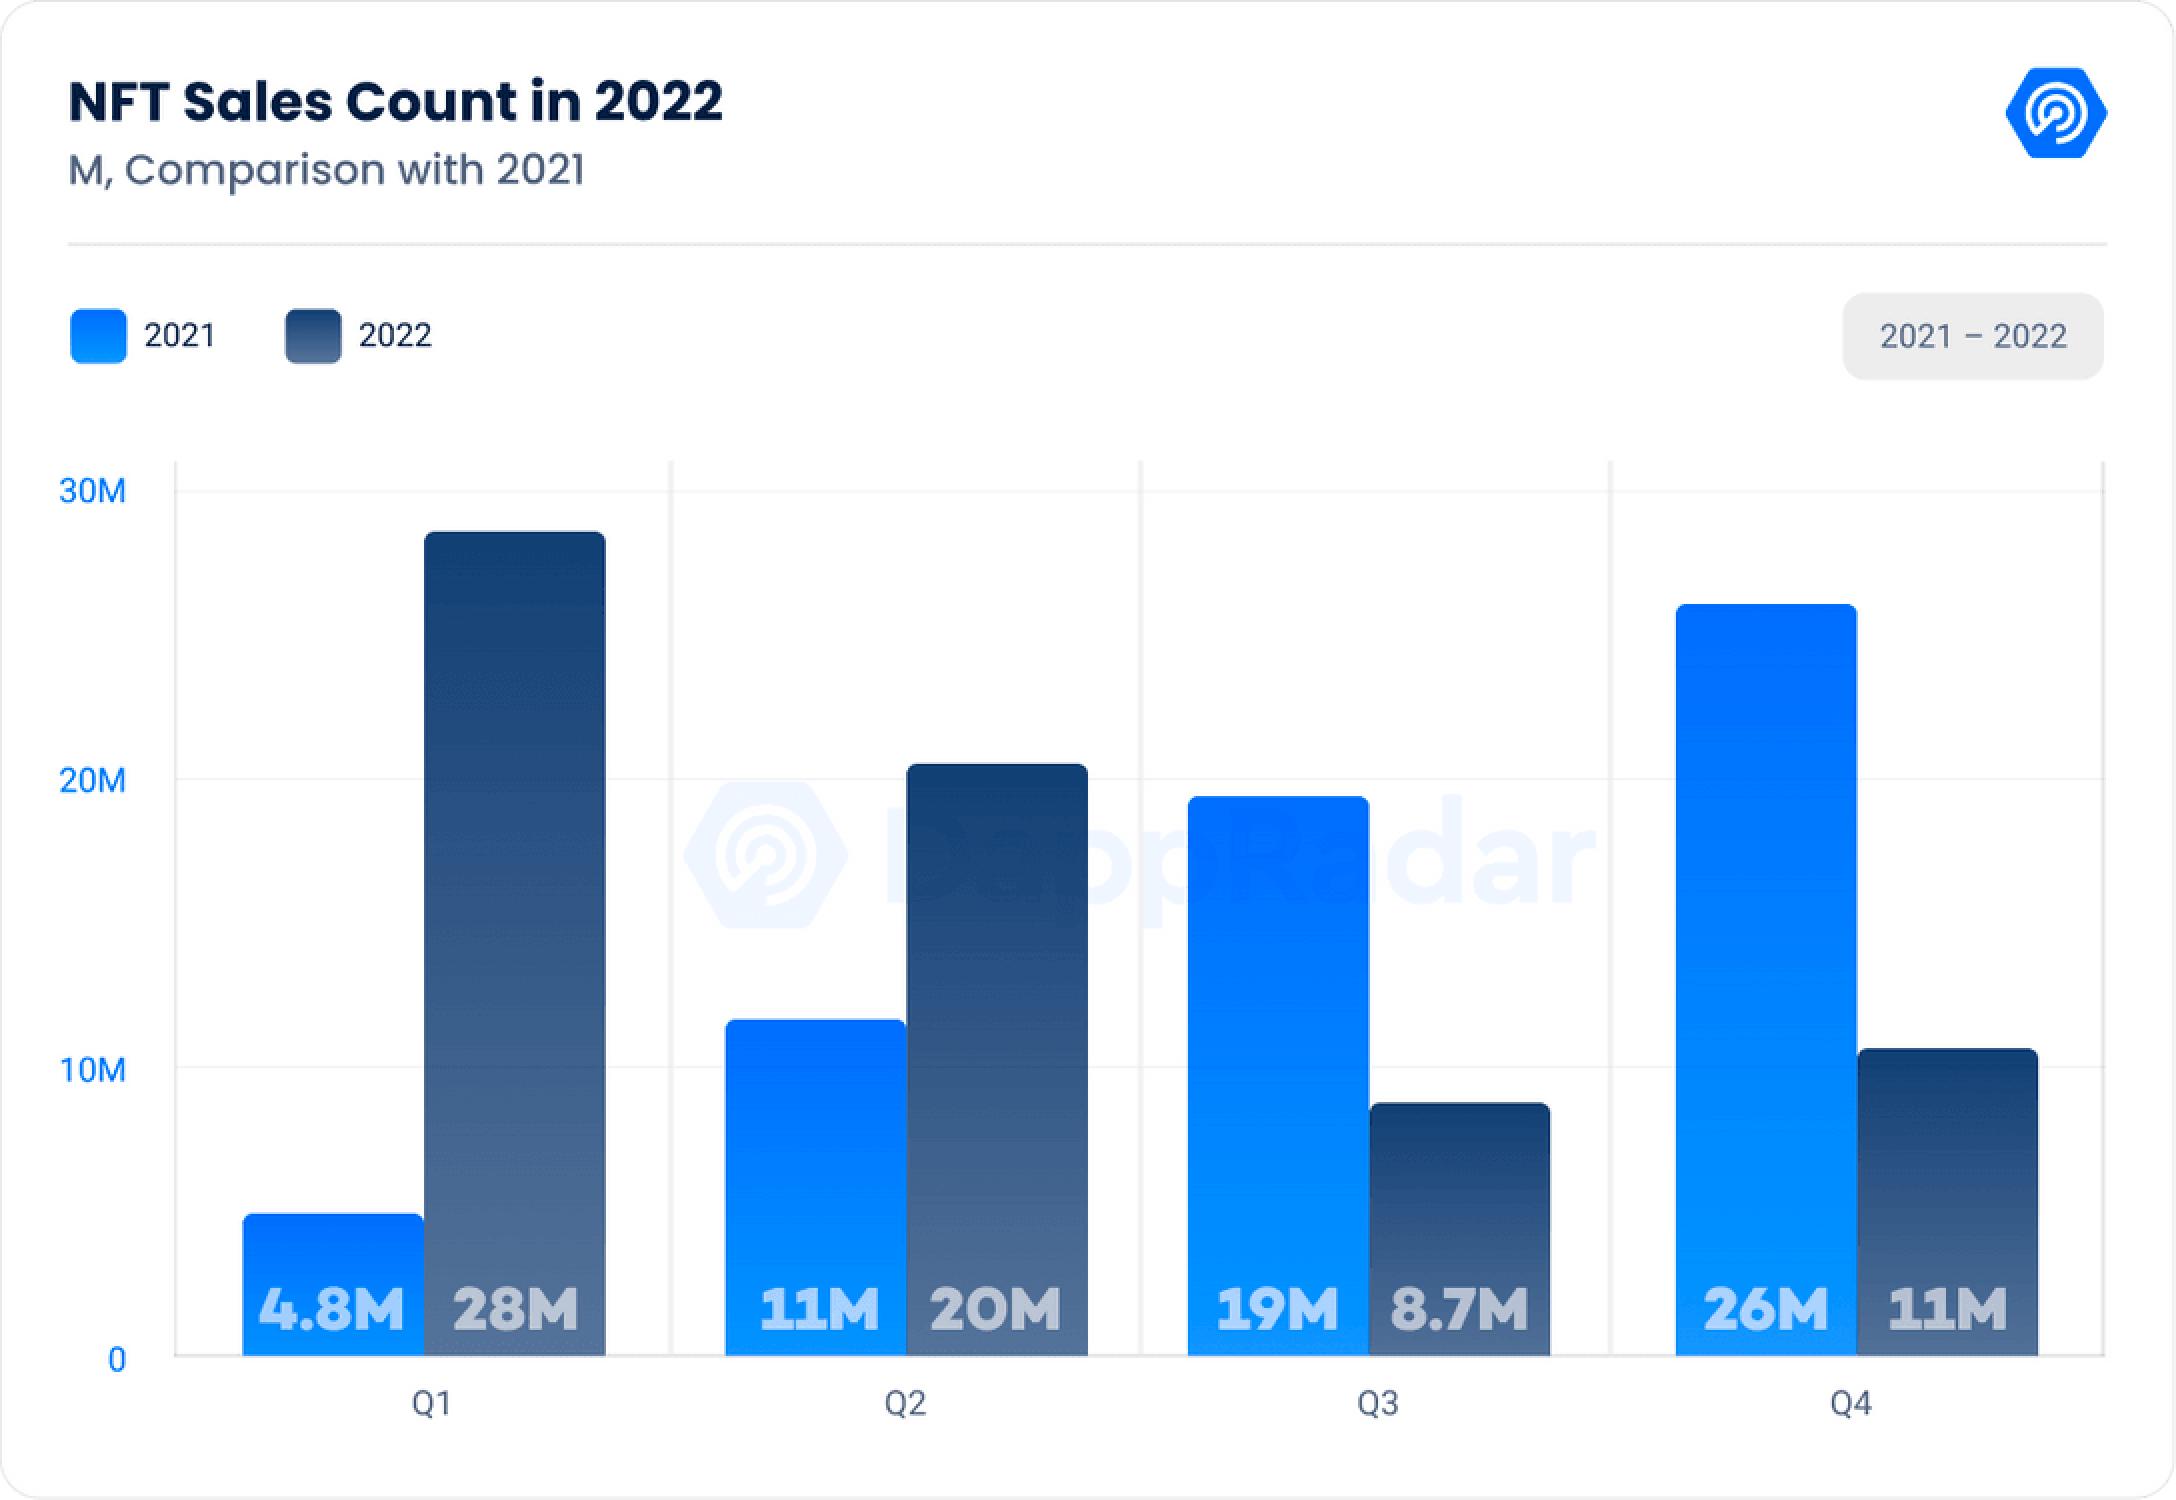
, an overall increase of 10.16% this year to 68.35 million transactions.
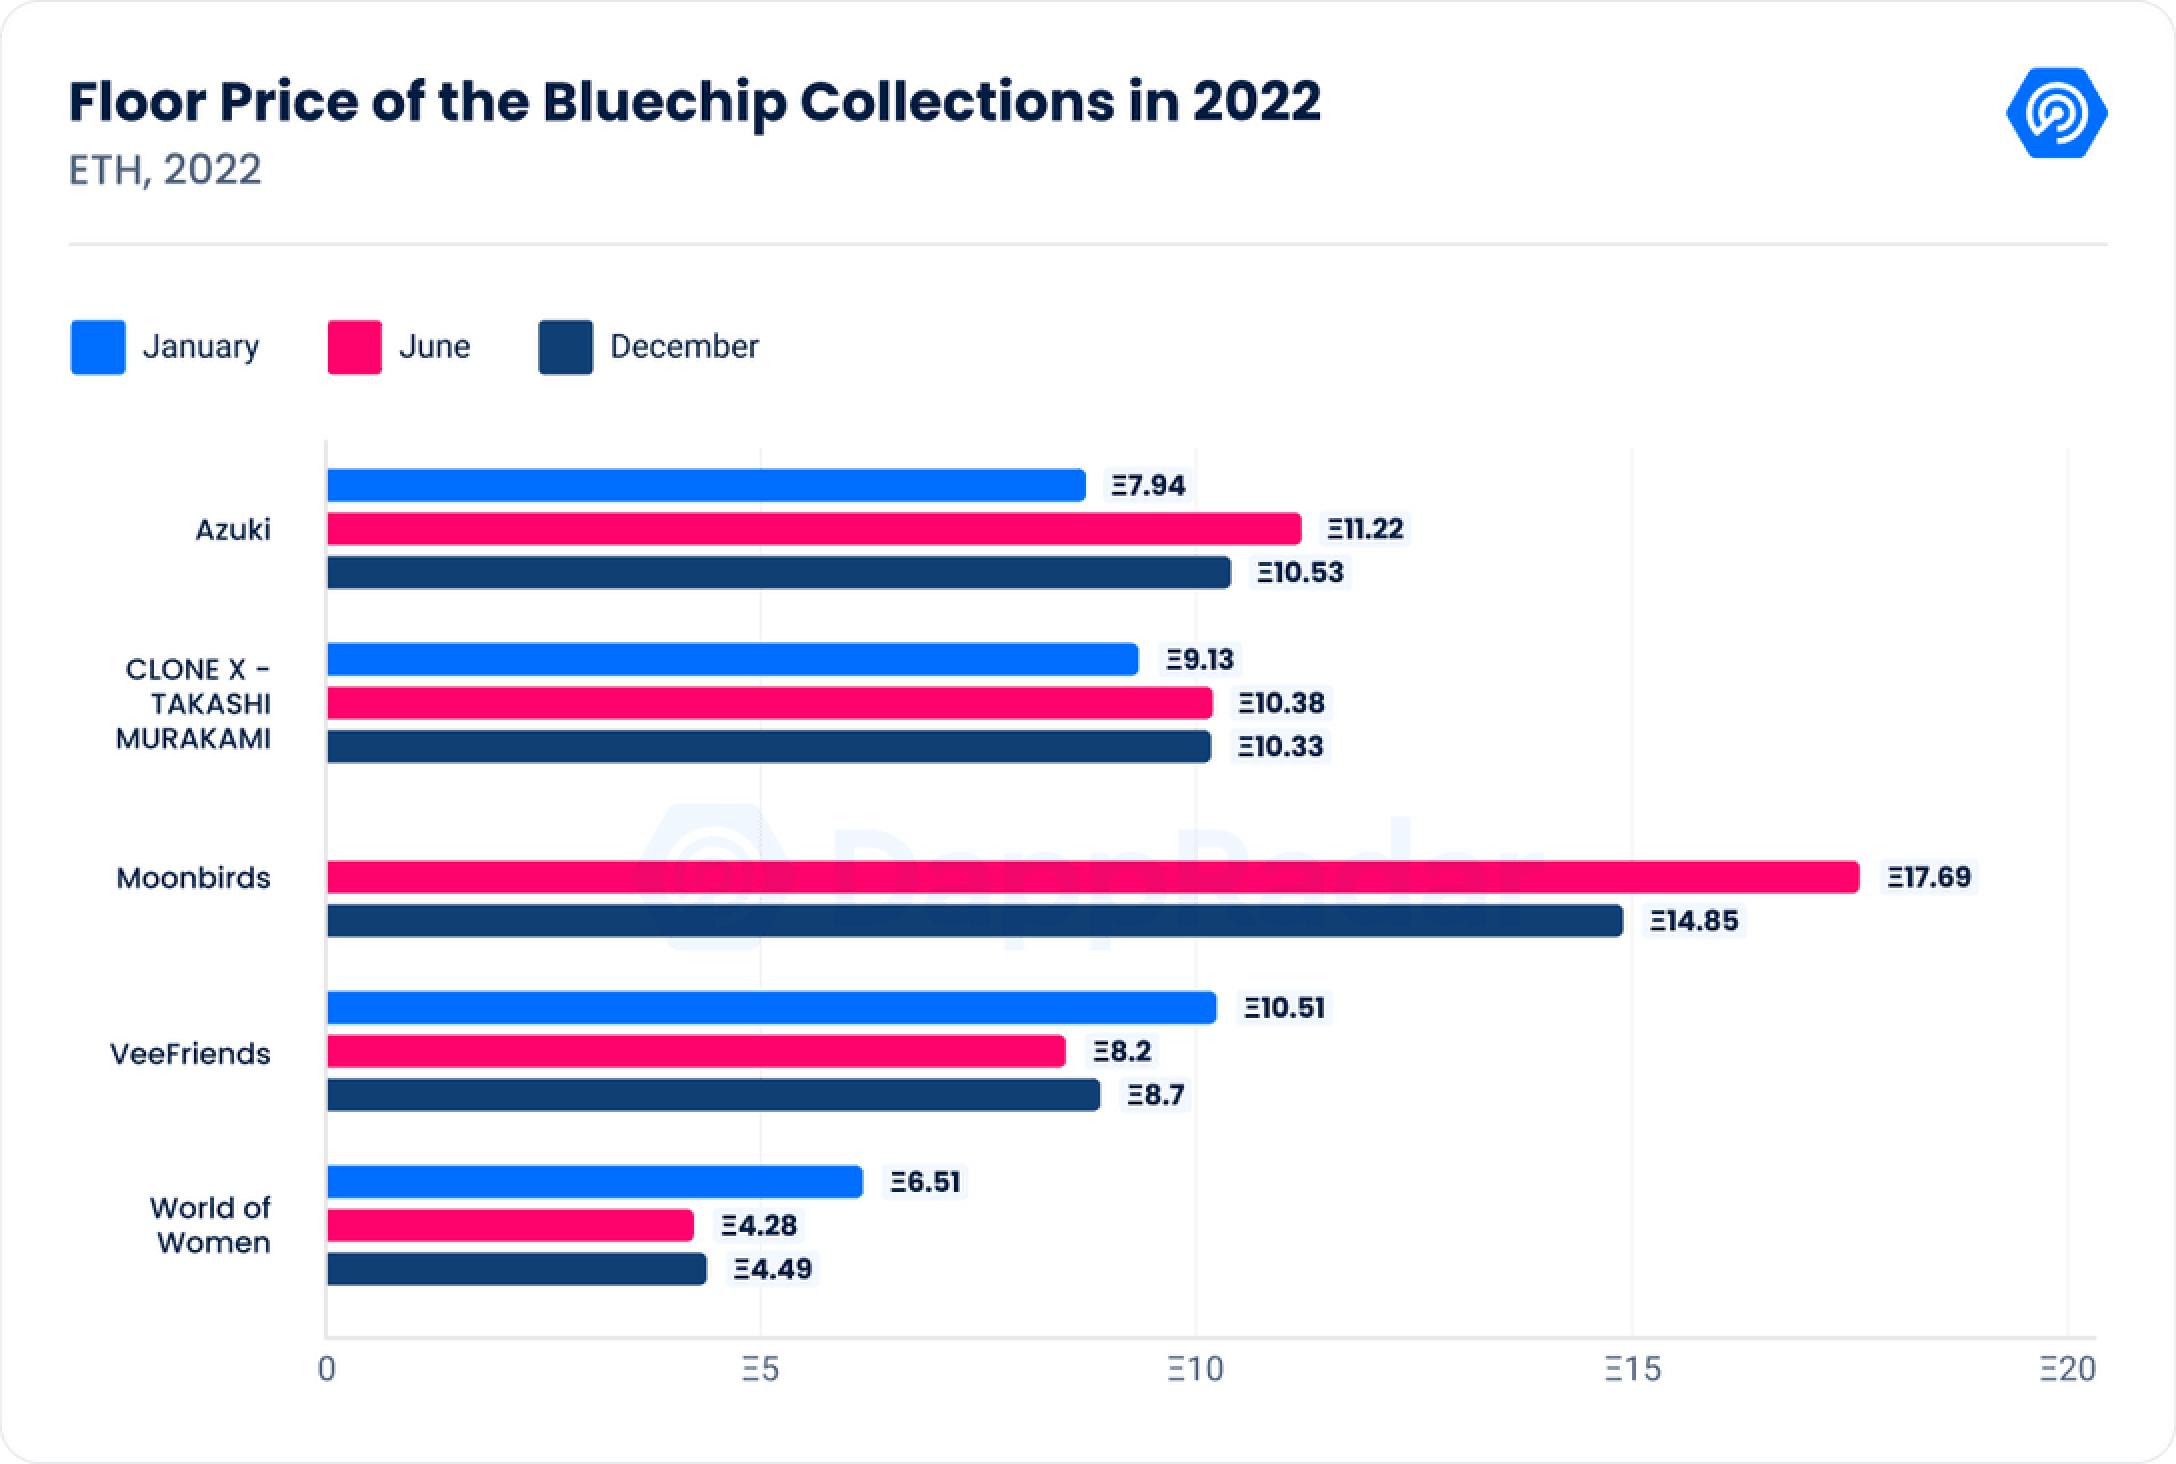
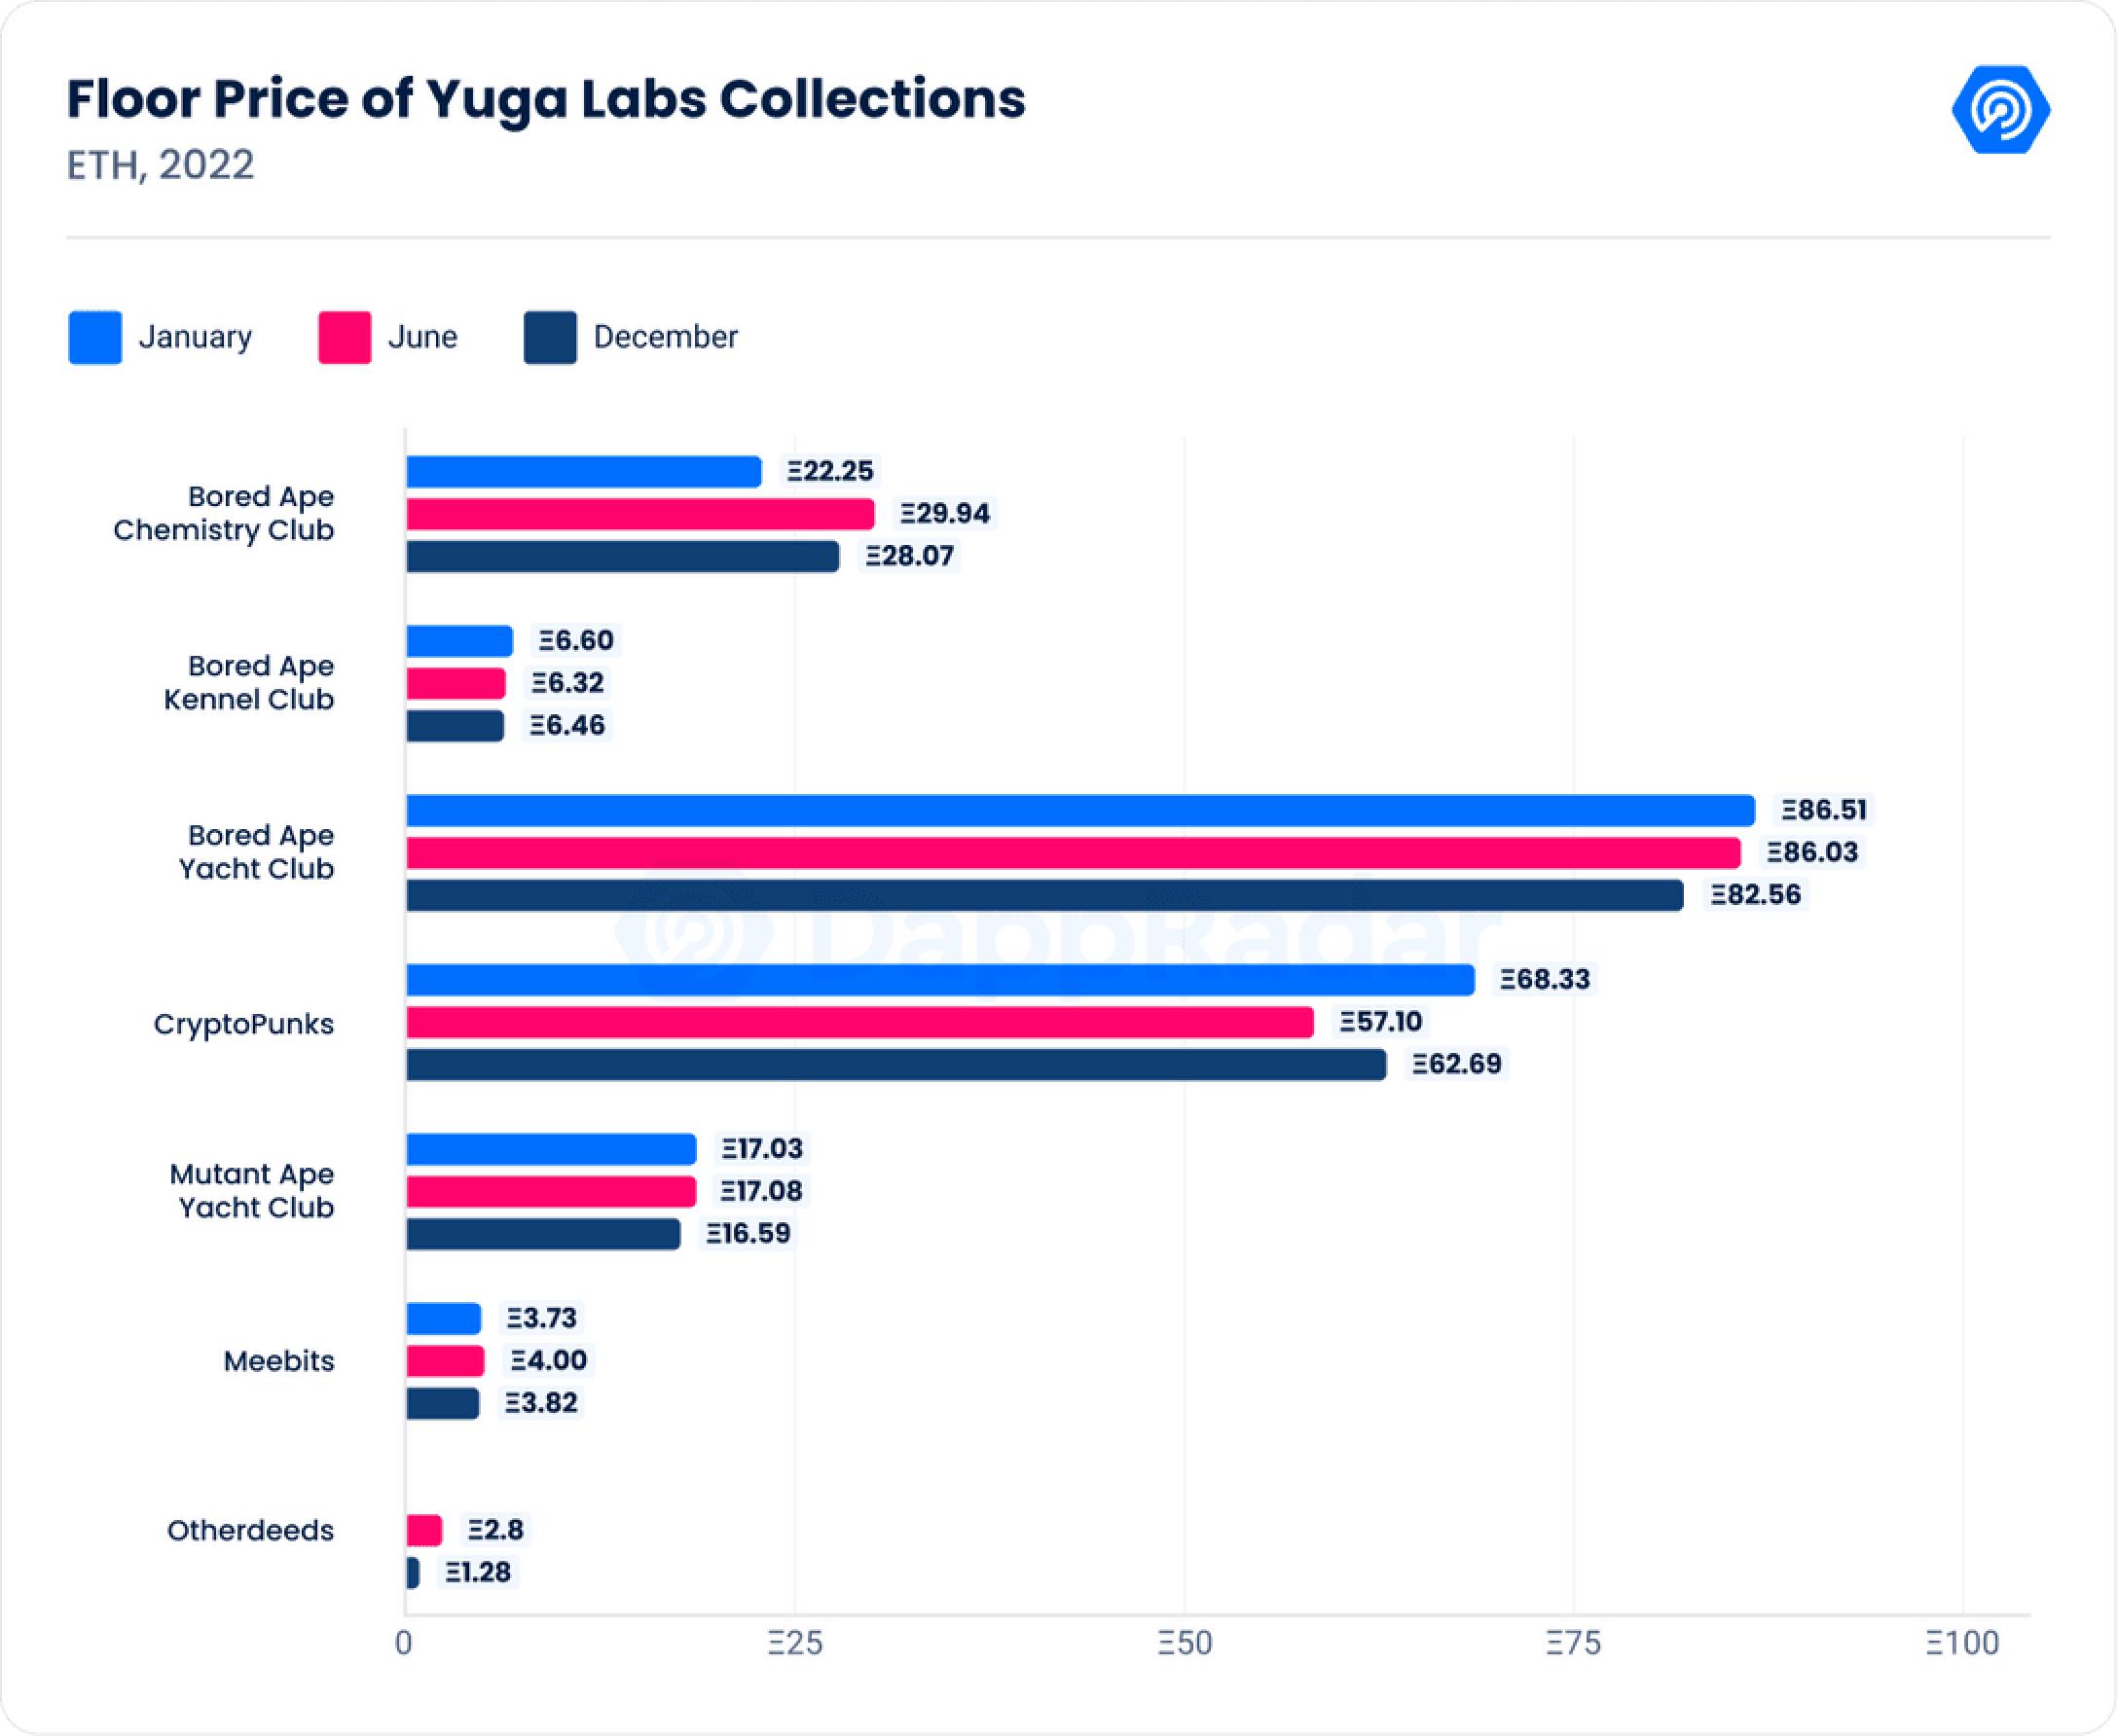
6. 5. The NFT blue-chip stock series still ranks first in this year's trading. Azuki becomes the first NFT brand to appear on an F1 car. VeeFriends closed a $50 million seed round in July, while PROOF's Moonbirds raised another $50 million in August to further scale the brand.Yuga Labs continues to expand, acquiring CryptoPunks, Meebits and NFT startup WENEW Labs.
7. Its collection of NFTs dominated the NFT market in Q4, accounting for 55% of the top 100 most valuable NFT holdings, worth $15 billion.This year, the NFT marketplace industry has welcomed new players.
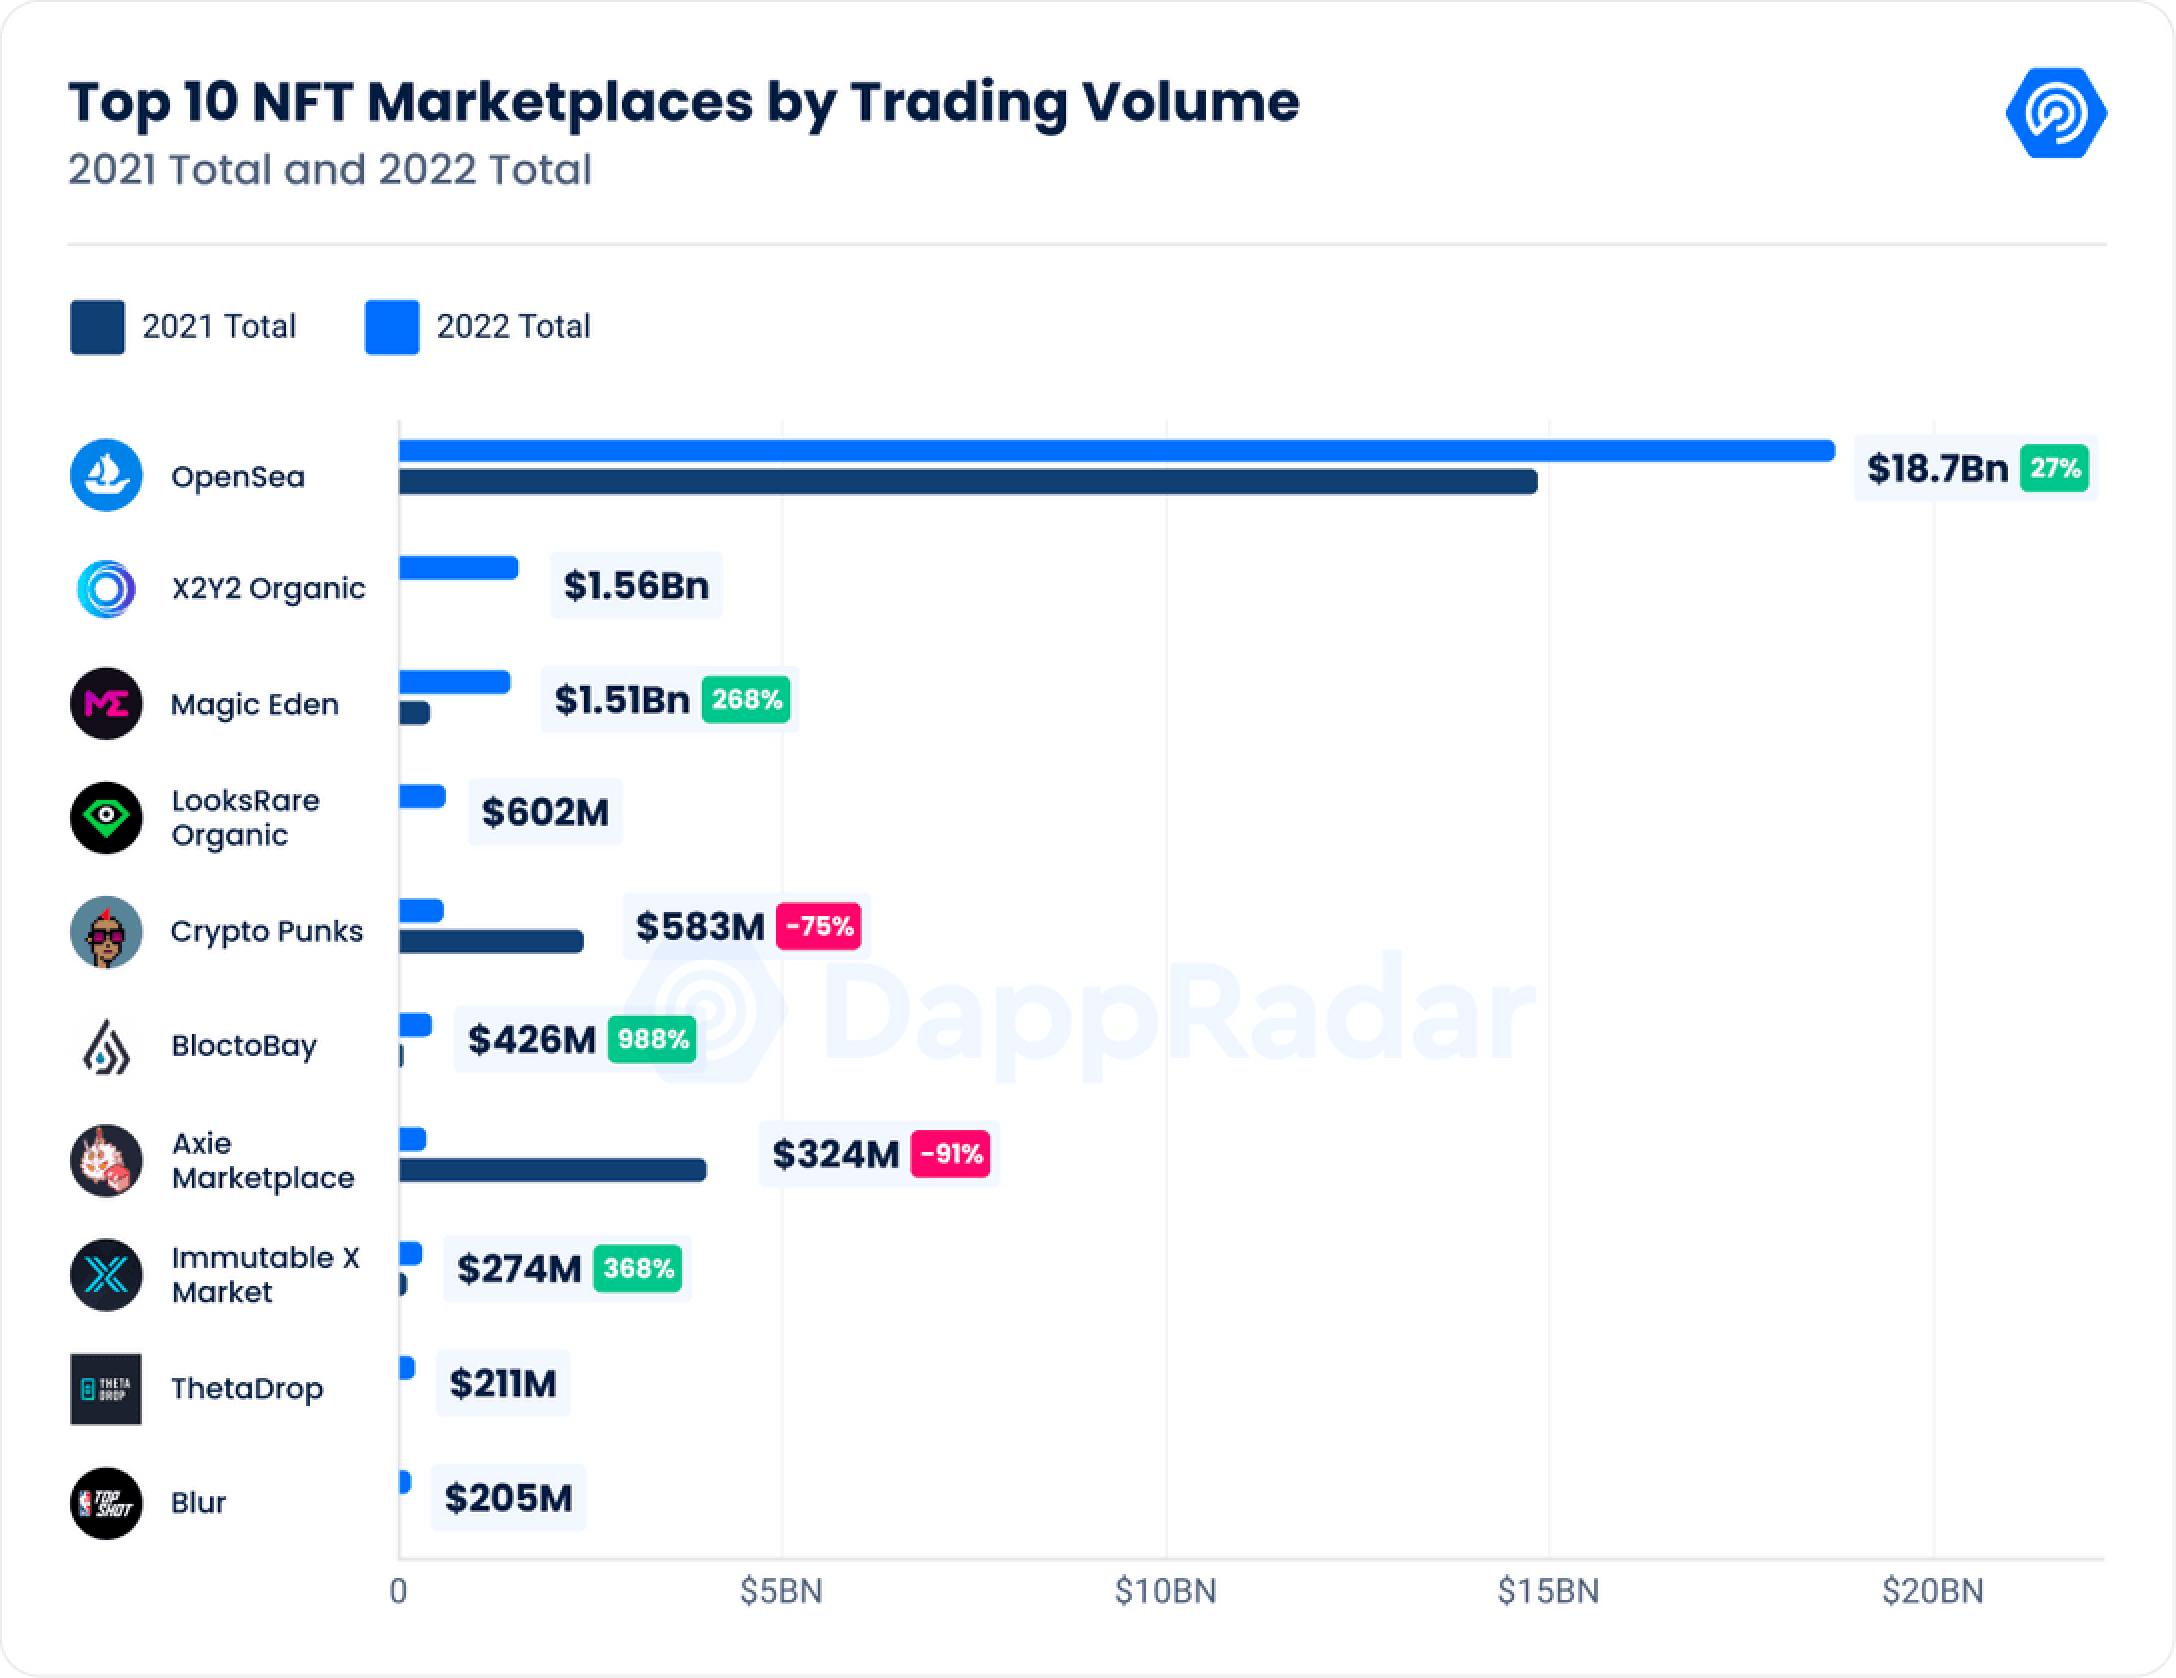
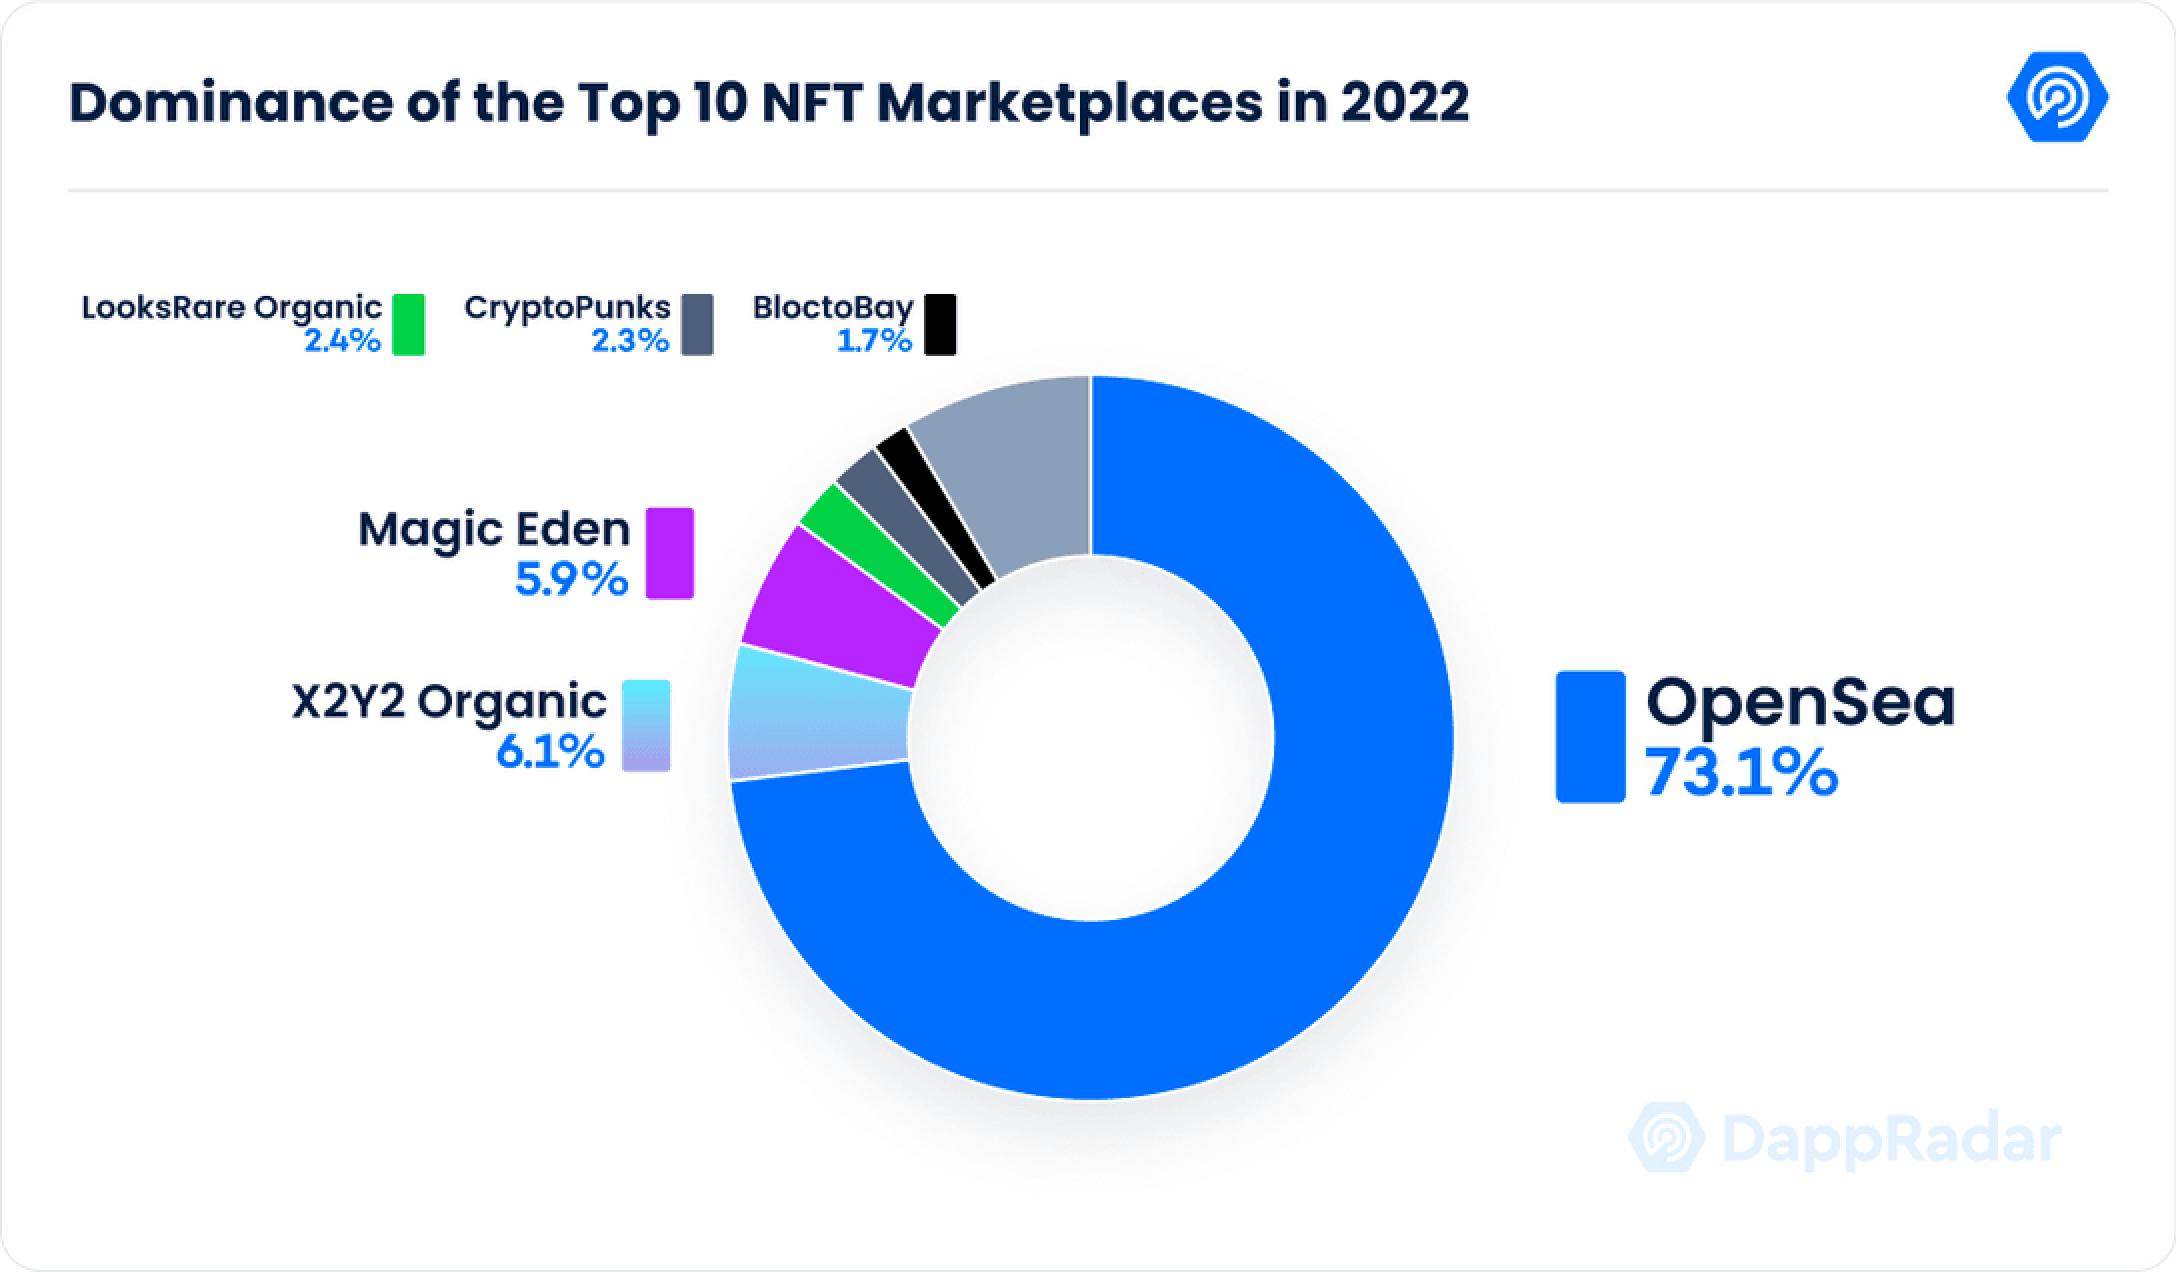
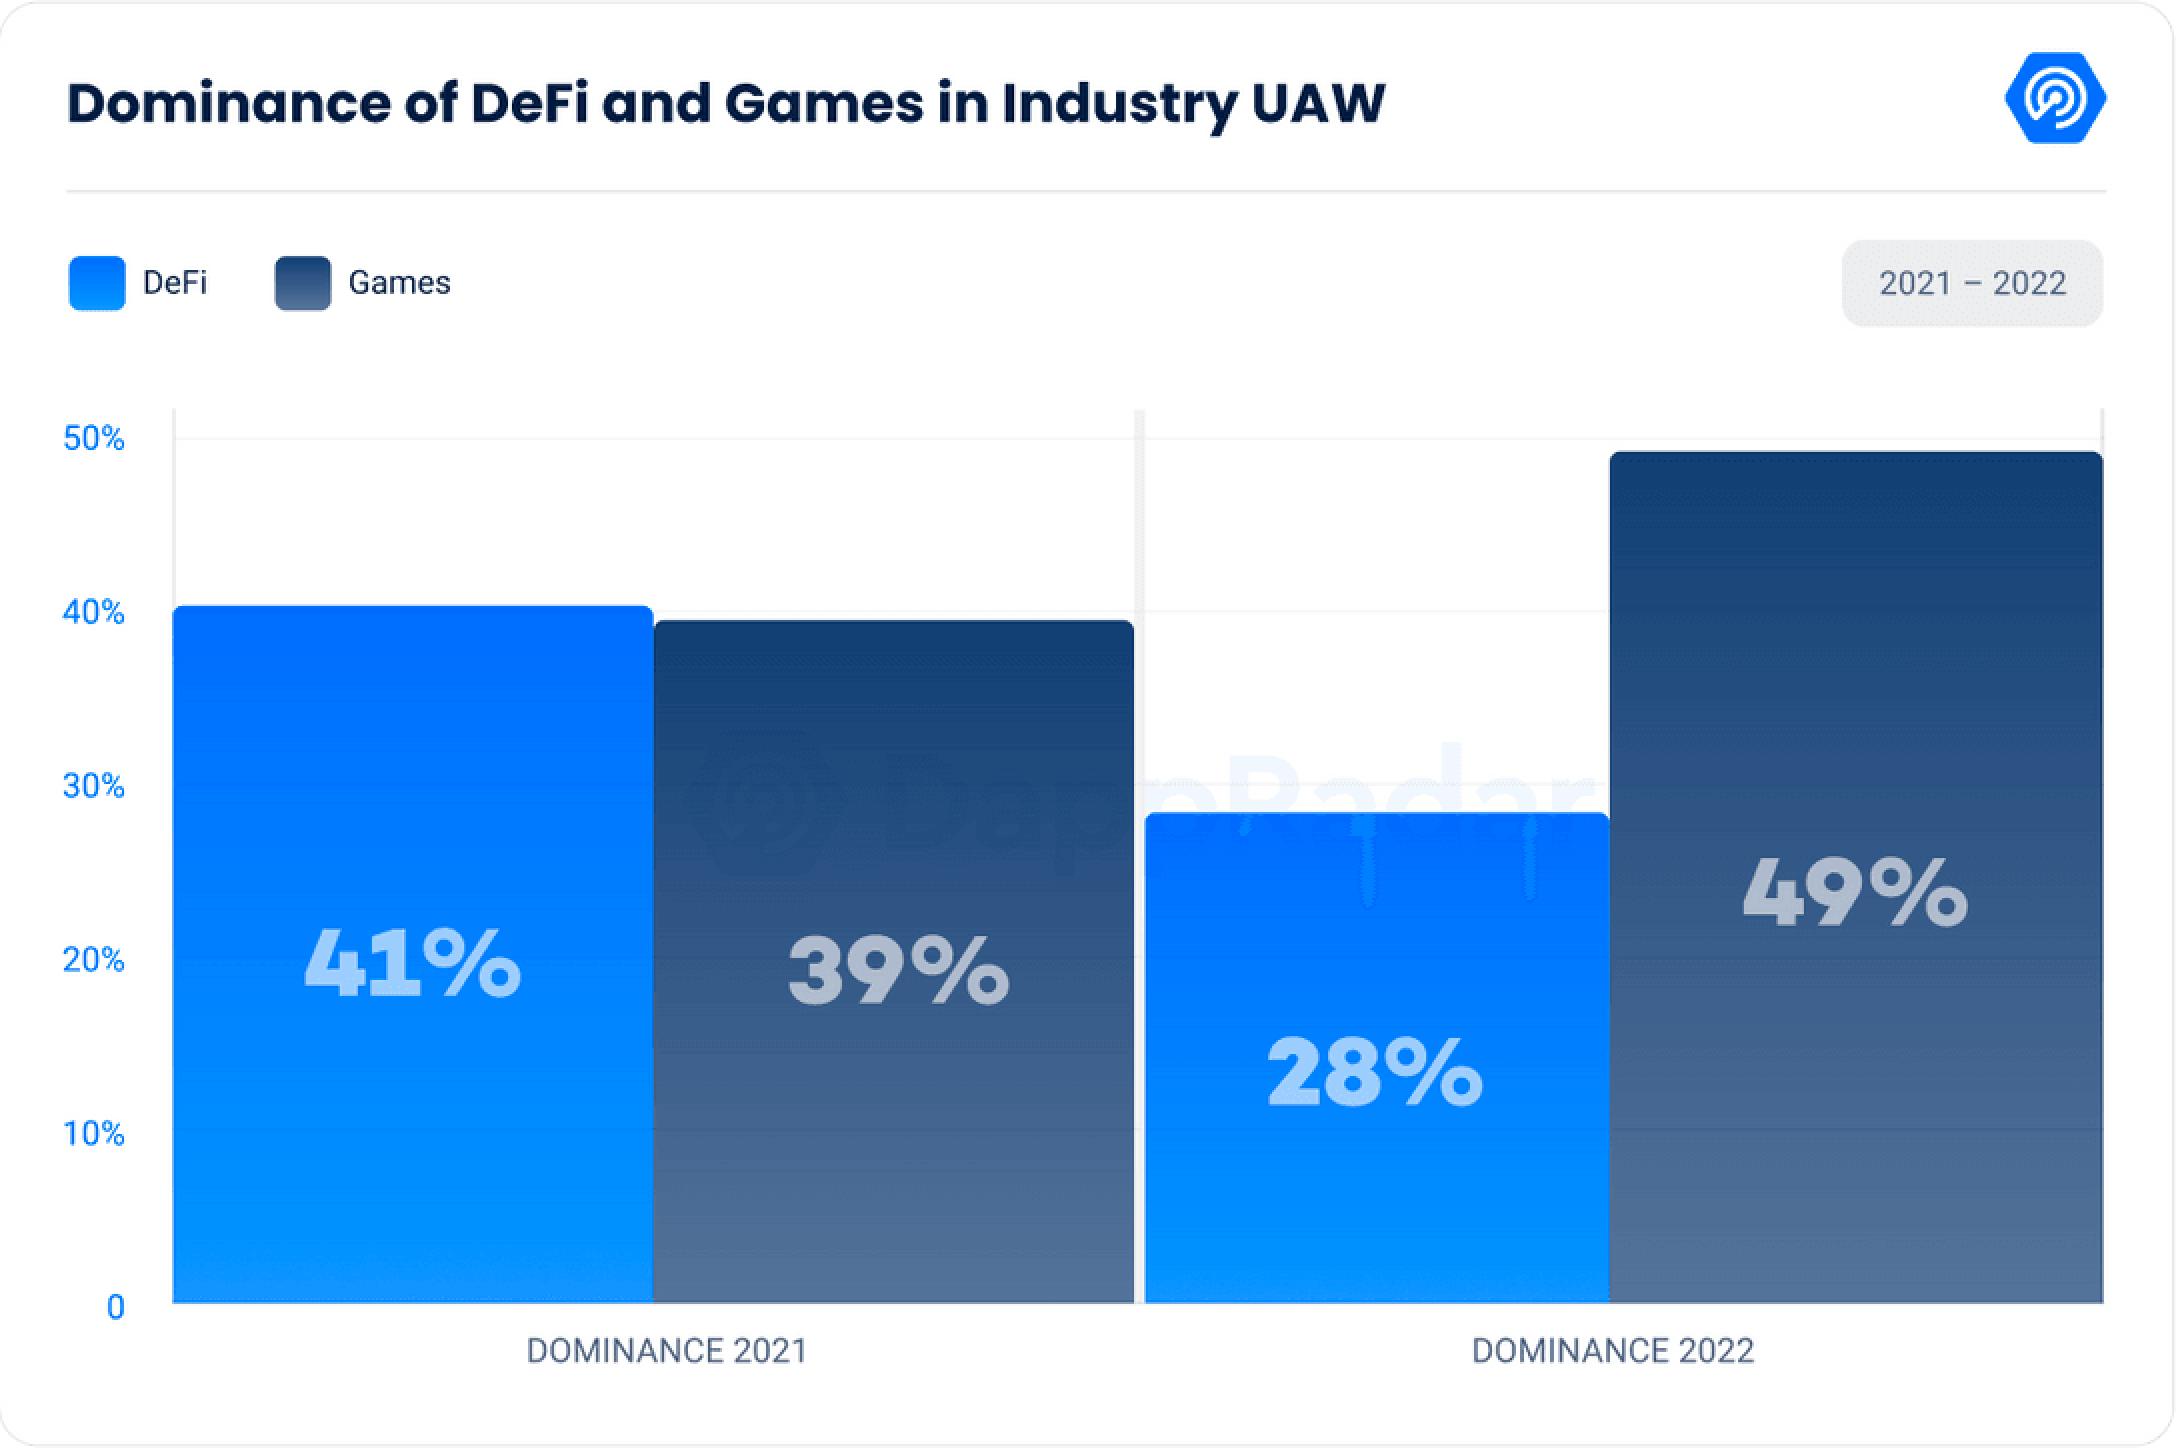
X2Y2 has climbed the leaderboard to become one of the top 10 NFT markets by trading volume with over $1.5 billion traded. Following the same trend, Blur, which launched in October, ranks at the bottom of the top 10 NFT markets in 2022 with a transaction volume of more than 205 million US dollars in two months. However, Opensea still holds on to its “dominance,” accounting for 73.1% of the entire NFT valid transaction volume even though sales have declined over the past month.8. In 2022,Blockchain games account for 49% of all dapp activity, with an average of 1.15 million unique wallets per day and 7.4 billion transactions
. Splinterlands remains the most popular game with 217,914 unique wallets per month, an increase of 85.78%. Alien Worlds came in second with 178,118 unique wallets, down 3.67%.9. In 2022,A total of 312 crypto hacks occurred, resulting in losses of $48.74 billion, an all-time high.
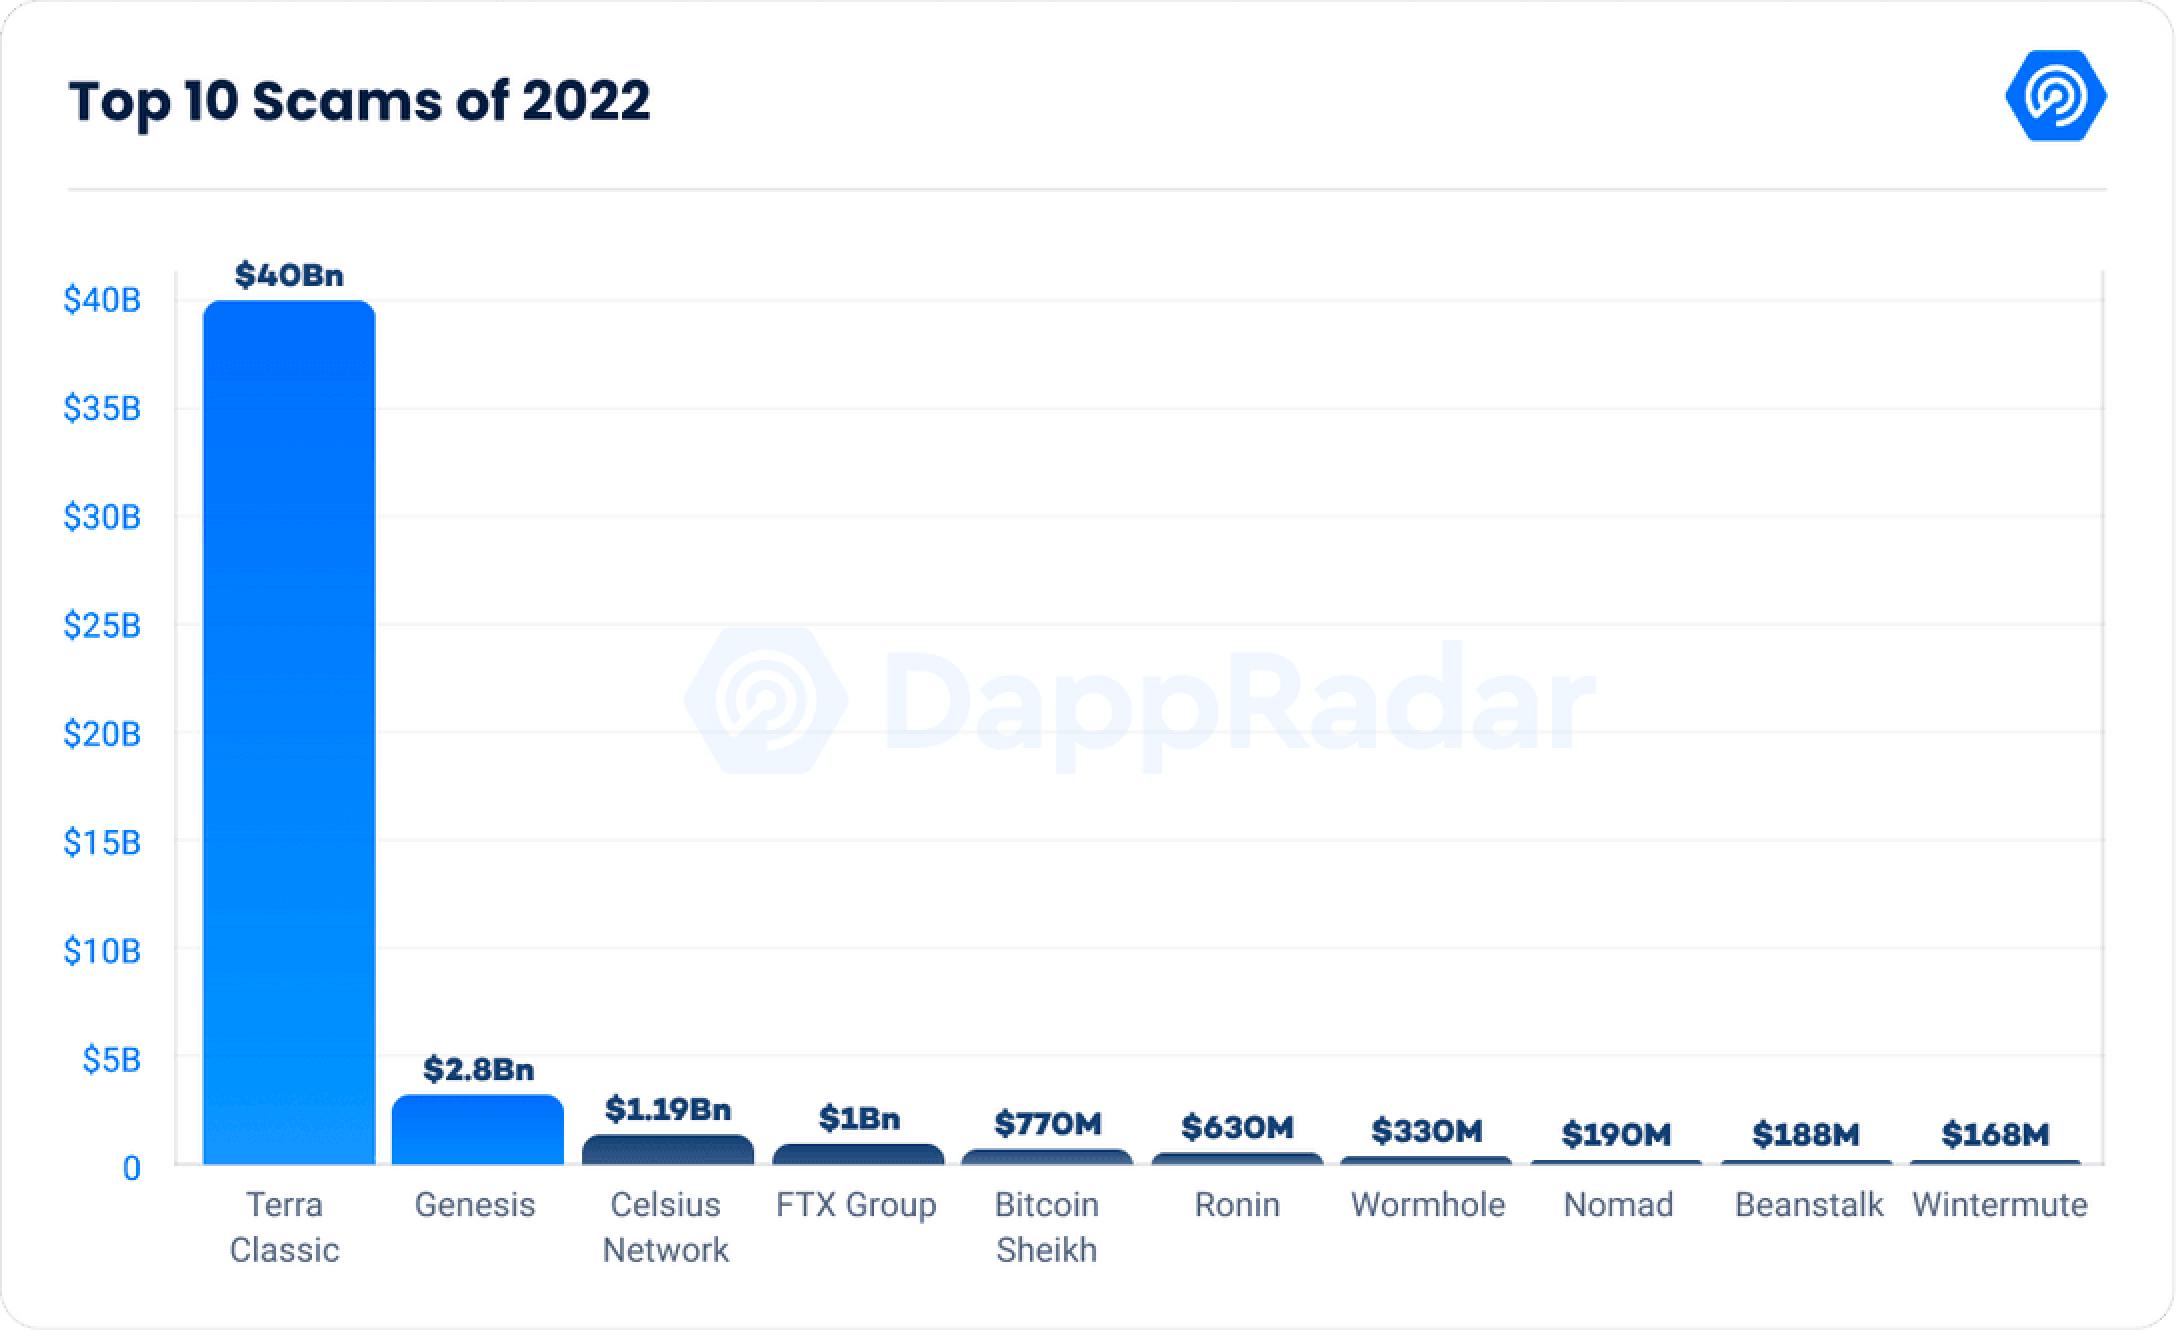
The Terra Luna scandal was the worst of these, costing $40 billion. Excluding this one incident, the median loss per hack was $283,000, for a total monthly loss of $728 million. Centralized platforms were the most common targets, with losses totaling $44.71 billion. BNB and ETH chains are the focus of hacker attacks, and rug pull is the most common type of attack.