
Taking Uniswap as an example, discuss the long-term impact of MEV on AMM
Original title: "Original title: " 》
The impact of MEV on Uniswap
Original Author: EigenPhi
MEV(Original compilation: angelilu, Foresight Newsmaximum extractable value) Not long after the initial concept was proposed, it has become a core topic in 2022, and MEV is also regarded as aNo permission incentives, users may withdraw on a first-come, first-served basis. However, the alluring opportunities for wealth in the dark forest alsohard to find, but require specialized capabilities. These phenomena have also raised concerns about public issues in the Ethereum ecosystem, fromPriority gas auction
From the block congestion problem caused by (PGA) to the more serious vulnerability security problem that may exist between validators and block builders.
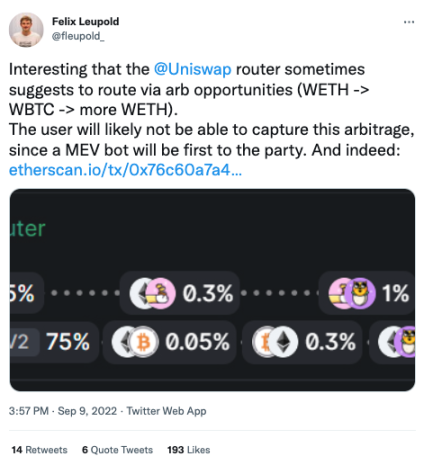
The AMM is one of the most relevant, if not the most important, components in the MEV extraction process, and due to the transparency of the memory pool, users of the AMM will inevitably connect to the MEV robot. The tweet is a direct reflection of the trouble users may be facing.UniswapFrom another perspective, arbitrage bots play a vital role in improving the efficiency of price discovery in the AMM market. In exploring how MEV impacts
When it comes to users on the Internet, stakeholders may consider the following two points to be very important:
How much impact will it have on the Uniswap community and its users?
In this report, we find some interesting and exciting conclusions and illustrate them based on observational samples and data analysis. While it is difficult to calculate the maximum extractable value of Dark Forest, we can calibrate the MEV market and its impact by looking at the asset value extracted. In the following, we analyze three types of MEV bot activity for Uniswap V3 liquidity pools.
overview
overview
MEV robot activity revenue
Total Revenue Scale ComparisonPart of the income of the MEV robot comes from the arbitrage income when the market spread is reduced, which is also reflected in the impermanent loss of liquidity providers (LP) and the slippage loss of swap users. Another part of the revenue comes from the swap transactions of early adopters and causes them to bear additional slippage losses.New features in Uniswap V3——concentrated liquidityconcentrated liquidity
Aspects are unique. They act as highly active LPs and extract swap fee income from otherwise passive LPs.
We visually measured the scale of revenue extracted by these bots and compared it to Uniswap V3's commonly defined supply-side revenue.
Let's see how different types of MEV robots will perform between January 1 and October 31, 2022:
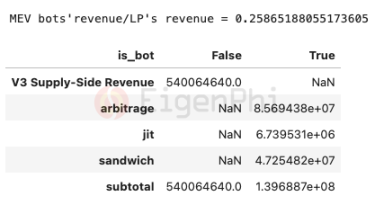
Arbitrage bots extracted at least $85 million from market price asymmetries involving Uniswap V3 liquidity pools.
Sandwich bots pulled at least $47 million from swap users in Uniswap V3 liquidity pools.
JIT bots pulled $6M from Uniswap V3 swap fee revenue.
The total extraction value of these three types has exceeded 25% of the supply side revenue (ie LP's swap fee revenue), or $540 million.
LPs, exchange users, and governance token holders played an important role in the AMM community before Dark Forest and MEV bots entered the public eye. TVL, transaction volume, fee rate, slippage, and liquidity mining yield are important indicators. Today, MEV robots are one of the components of this community that cannot be ignored in terms of the scale of value extracted.
As communities become more diverse and evolve into more complex value transfer networks. Given this pattern, MEV data has become a valuable asset for enhanced decision-making. One of the goals of this report and future work is to provide a transparent overview of this network. And tracking its evolution from time to time can help interested parties better understand how MEV will impact the Uniswap community in the long run.
monthly income trend
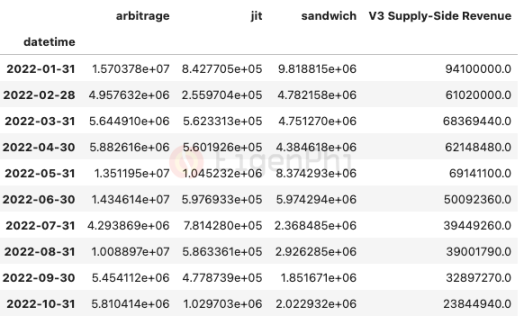
Let's start with this year's monthly revenue figures:
), which means that there is no apparent conflict of interest between them. In recent months, however, their earnings have more likely fluctuated with the overall market.
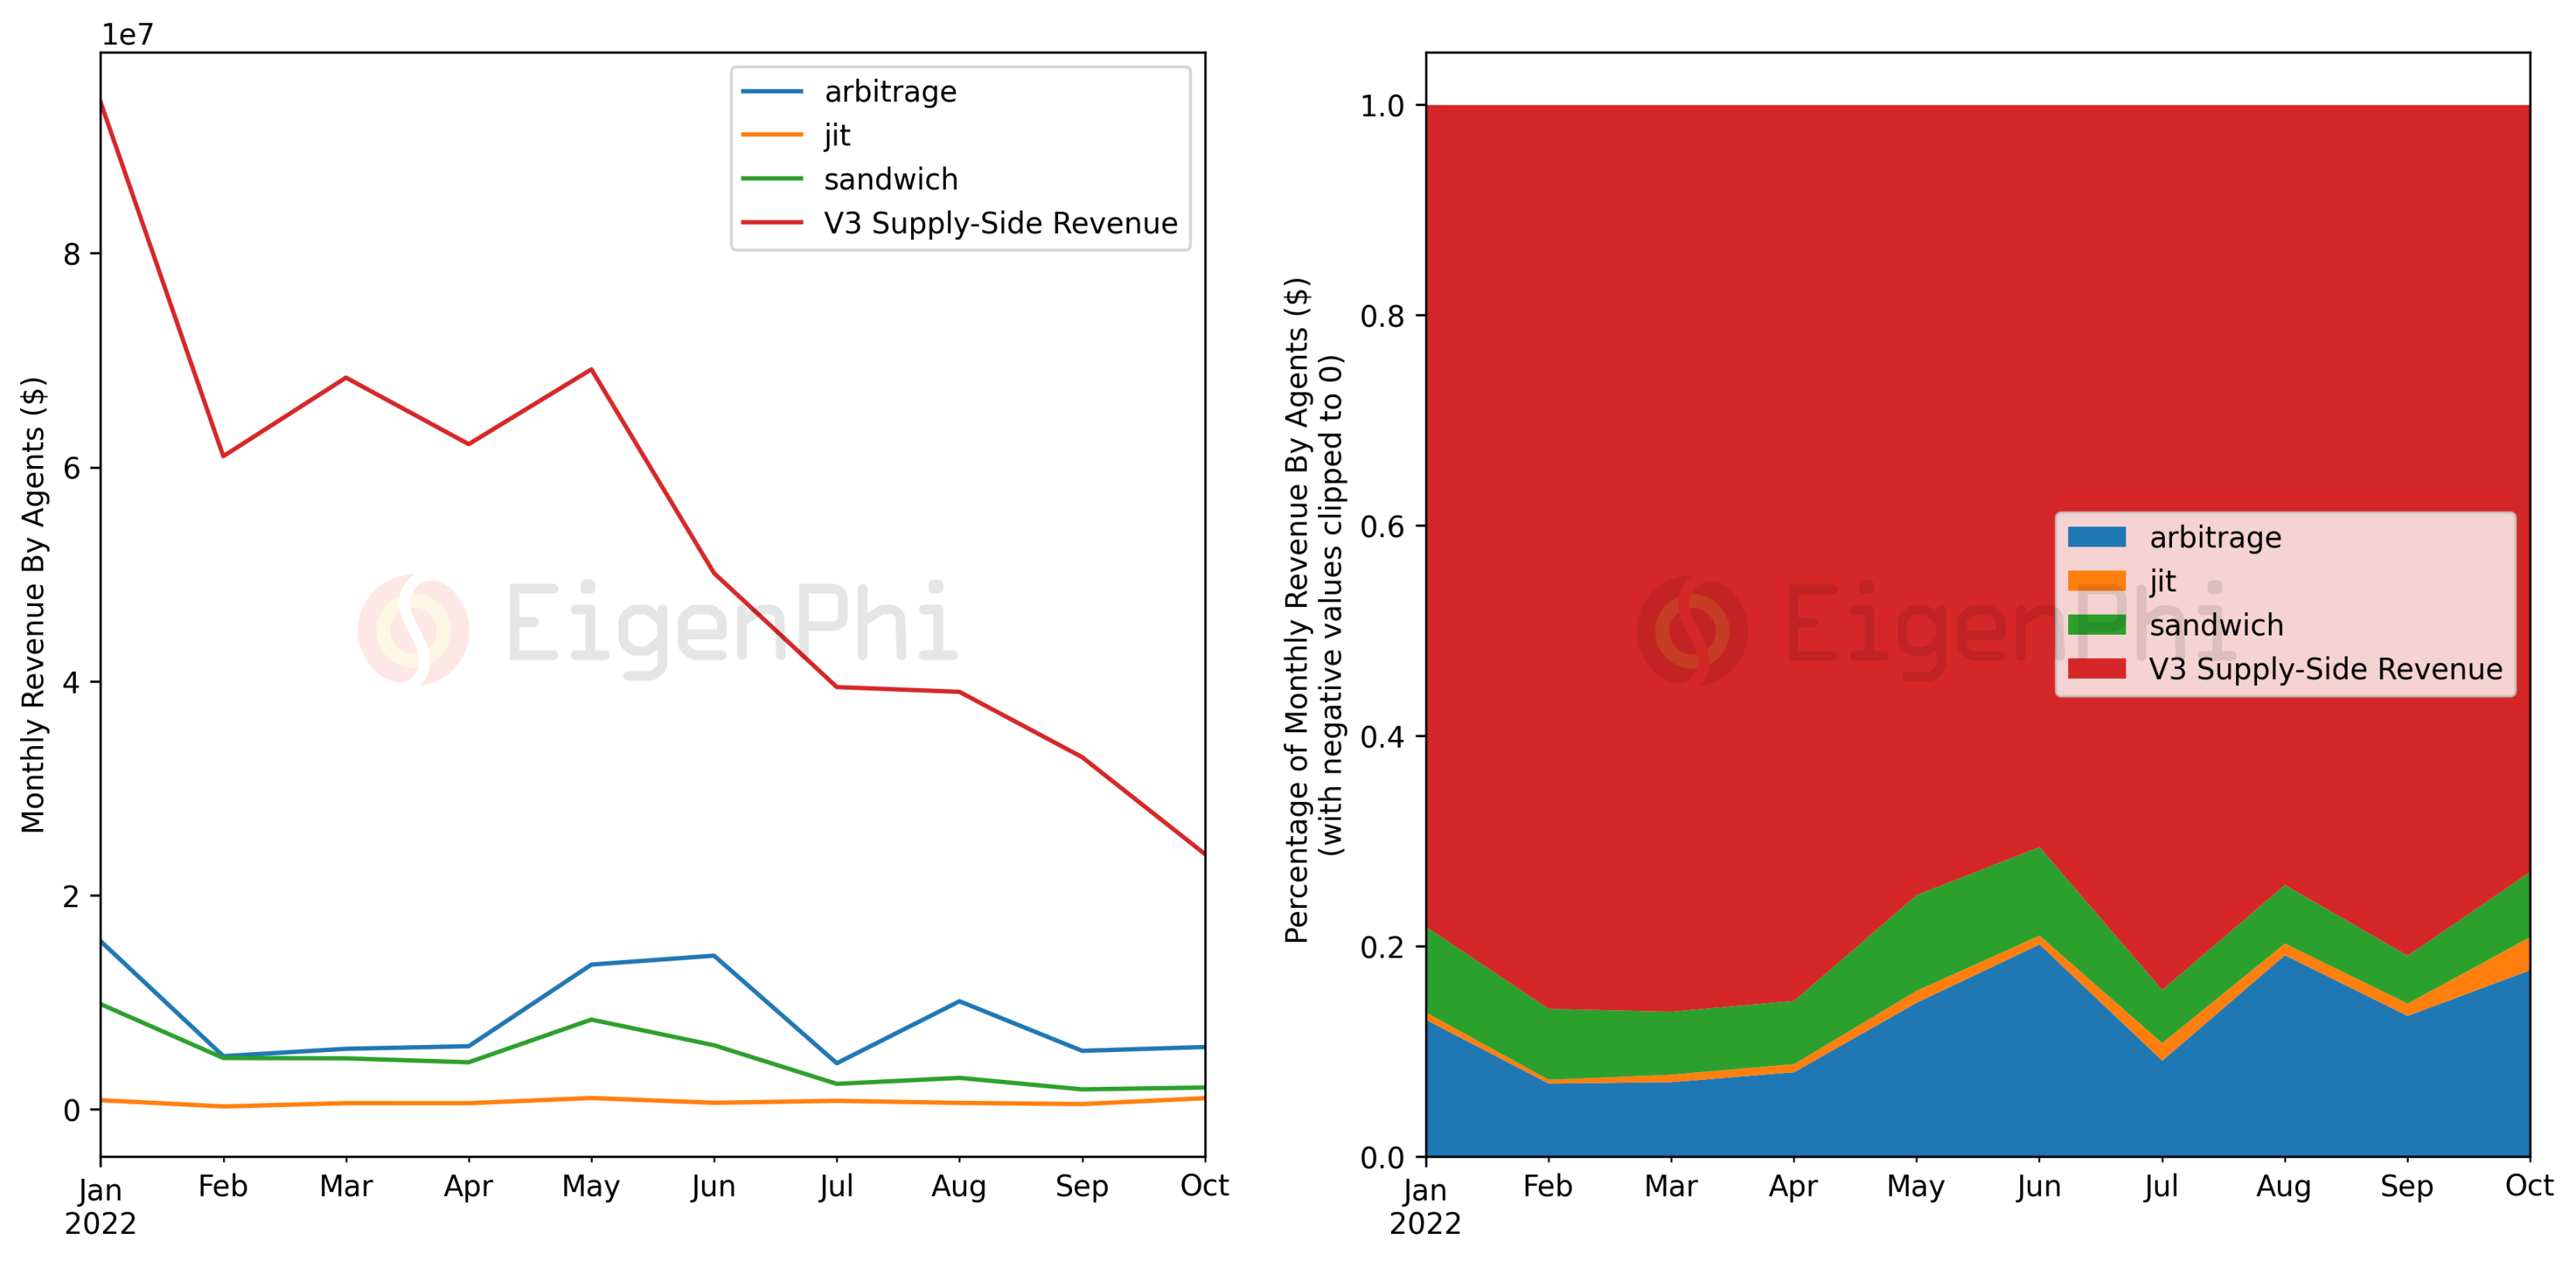
Comparing the returns of different types of MEV bots, we found that arbitrage bots can extract more value than other types of bots. The monthly income of JIT robots is an order of magnitude smaller than the other two types, and it has not yet shown a clear trend, which is also related to the fact that such opportunities have just emerged.
Volume Contribution
The volume contribution of these MEV bots to Uniswap is also another way to calibrate the macro-level impact.
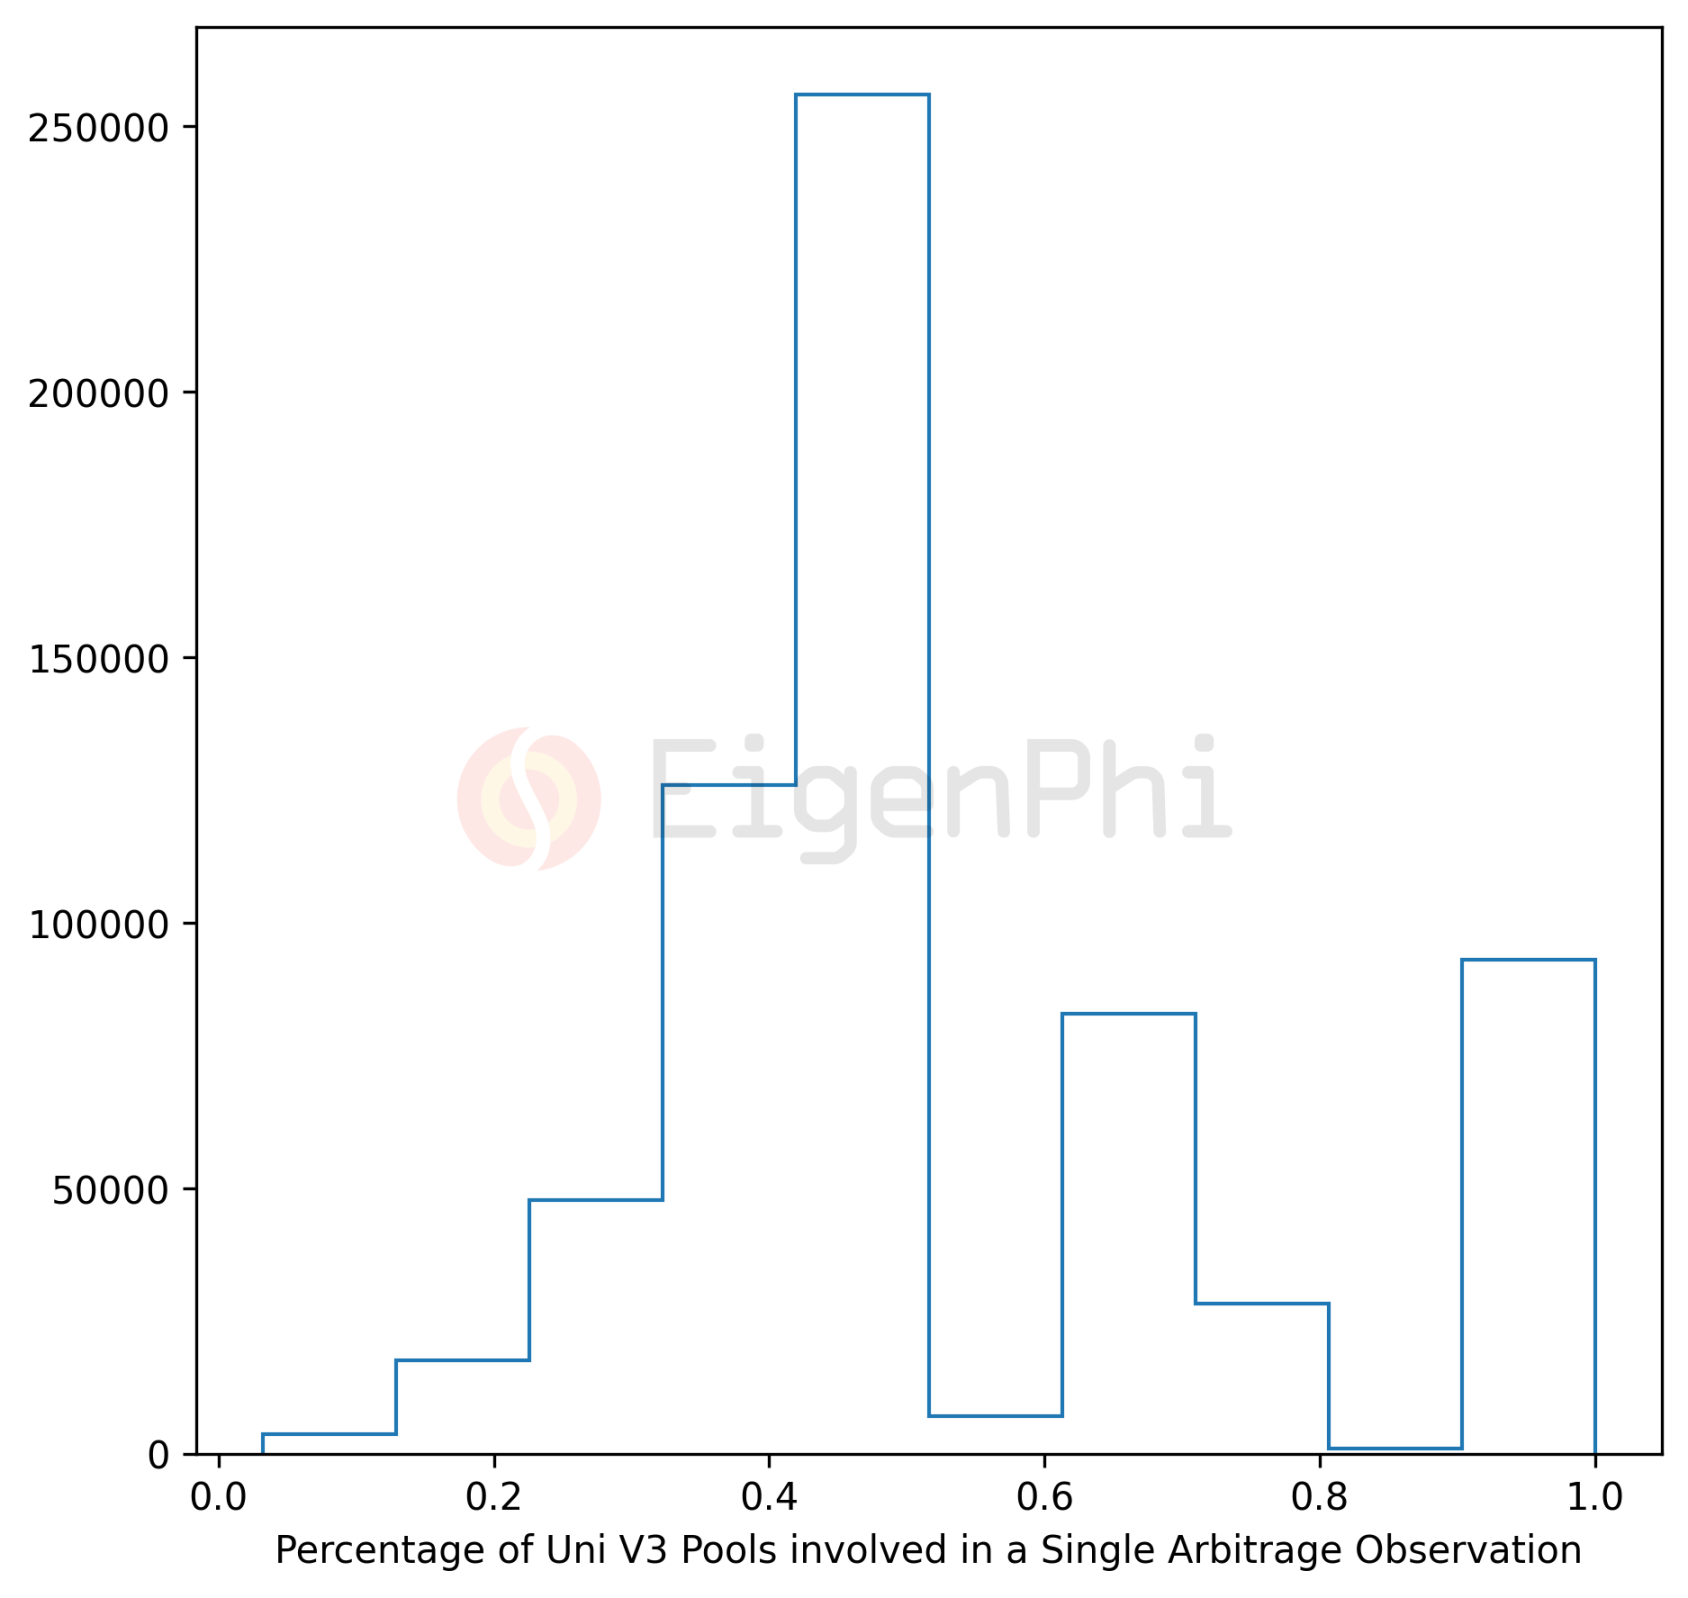
From the histogram below, we can see most arbitrage observations: Tokens are traded between Uniswap V3 pools and other venues.
Therefore, to examine the transaction volume contribution of arbitrage events, one cannot simply summarize the arbitrage transaction volume and compare it with the total transaction volume of Uniswap V3, and the contribution to other venues will also be counted. Instead, a more believable approach would be to consider arbitrage volumes compared to volumes that occur directly in Uniswap V3 pools. The same logic applies to calculating the volume contribution of the sandwich robot.
JIT bots do not need to issue swaps; they add and remove liquidity to withdraw fees. However, we can measure the number of targeted swap transactions in JIT events to study the impact on swap users. We will explore this in a future report.
frequency analysis
Observations per day
We can also detect how often these bots find MEV opportunities by looking at the number of daily observations. Although the results below show the smallest set observed, it is still reasonable to compare data along timelines or robot types.
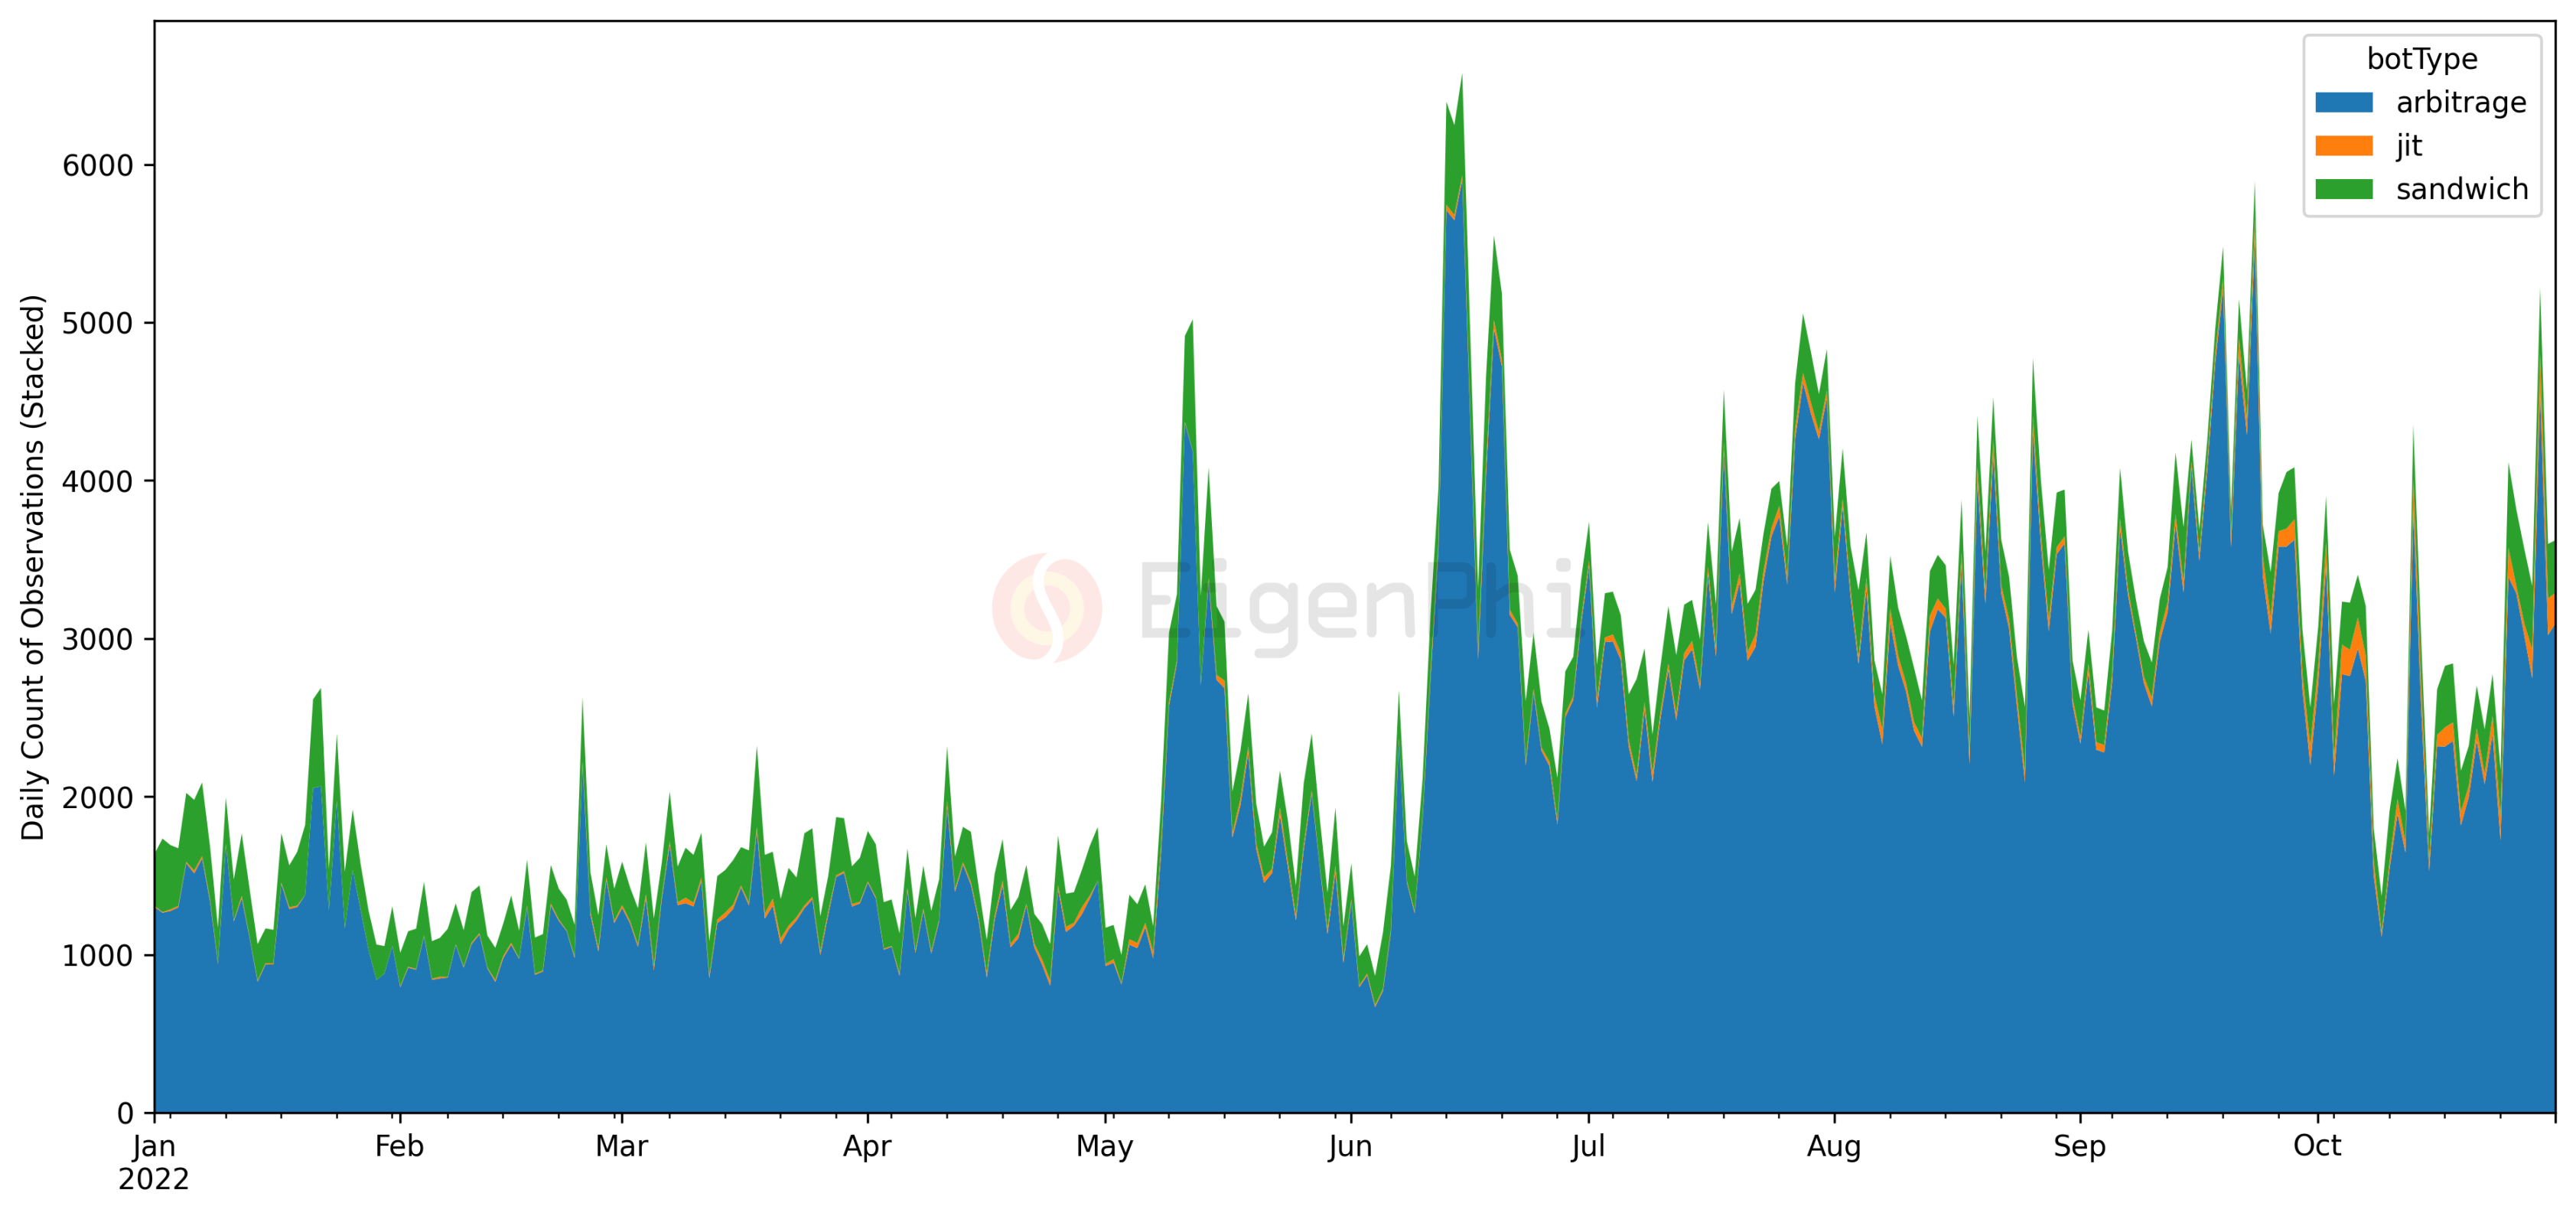
The graph below shows that arbitrage bot activity has increased significantly since May of this year. In contrast, the observation frequency of the sandwich robot remains at a steady level. Clearly, arbitrage bots are more likely to find MEV opportunities than other bots.
Daily Count Fluctuations and TrendsFluctuations in observation frequency are positively correlated with absolute price changes of representative cryptoassets in terms of arbitrage and sandwich activity. Here we show an example of ETH's 7-day price change percentage (moving average result in absolute value, source:via coinmarketcap.comhistorical closing price). The correlation coefficient between the moving averages of the arbitrage robot is about 0.43, and that of the sandwich robot is about 0.60. The results show to a certain extent that the occurrence of trading opportunities is related to the strength of market price fluctuations, which is quite reasonable. The structural increase in arbitrage bot activity since May may also be related to other factors, such as in recent monthsAverage Gas Price Decrease
, which is not the focus of this report.
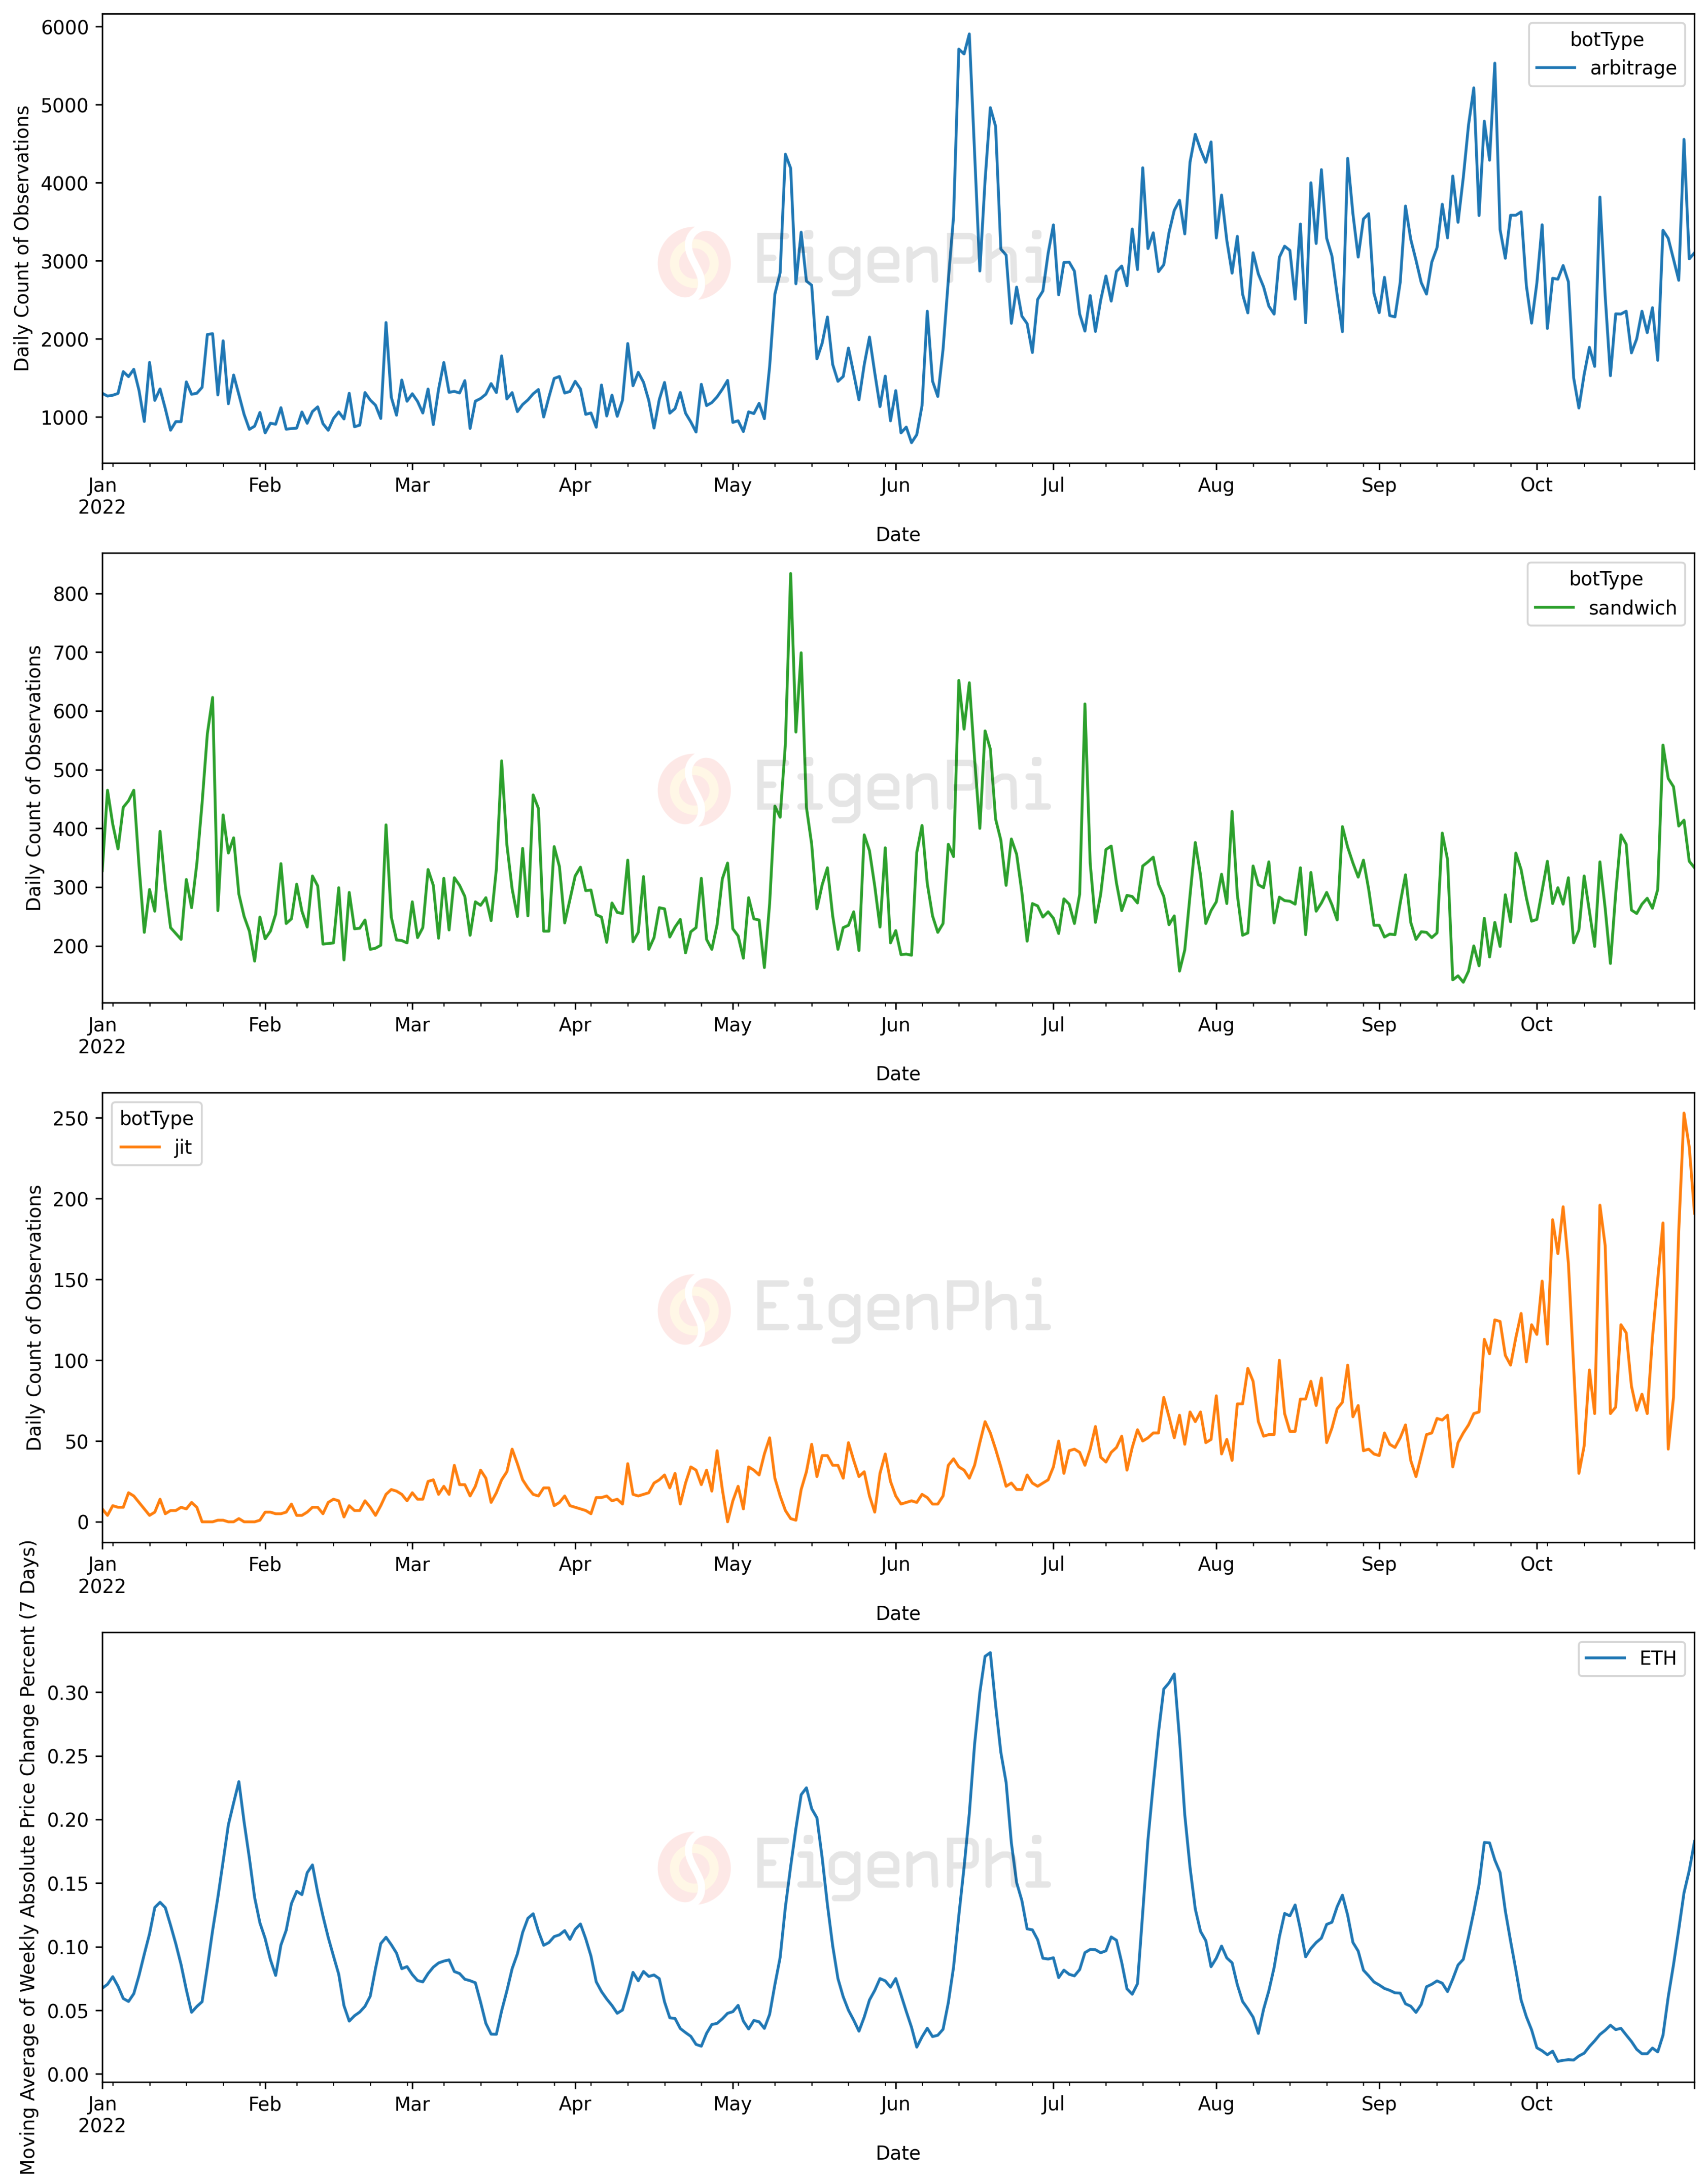
Meanwhile, JIT bots have tended to find more and more opportunities in recent months.
observe profit
The actual profit in the pocket of MEV robots is another parameter to predict the attractiveness of the future MEV market to the outside world. Assessments in this area require a more careful and refined treatment of the data for two reasons:
Relying solely on on-chain data to get an accurate answer is not enough because of survivorship bias. For example, a bot that appears to be profiting from on-chain transactions may still suffer from the costs of many failed transactions or other off-chain hedging costs.
The process of converting token prices into dollars can strongly affect the assessment of robot profitability. This is because every penny counts when the price error is close to the difference between revenue and cost, which is the profit figure we want. In addition, the achievable liquidity of long-tail assets is also a factor that needs to be considered.
We are working hard to optimize the calculation of token prices, the results below are based on the latest version of our price index.
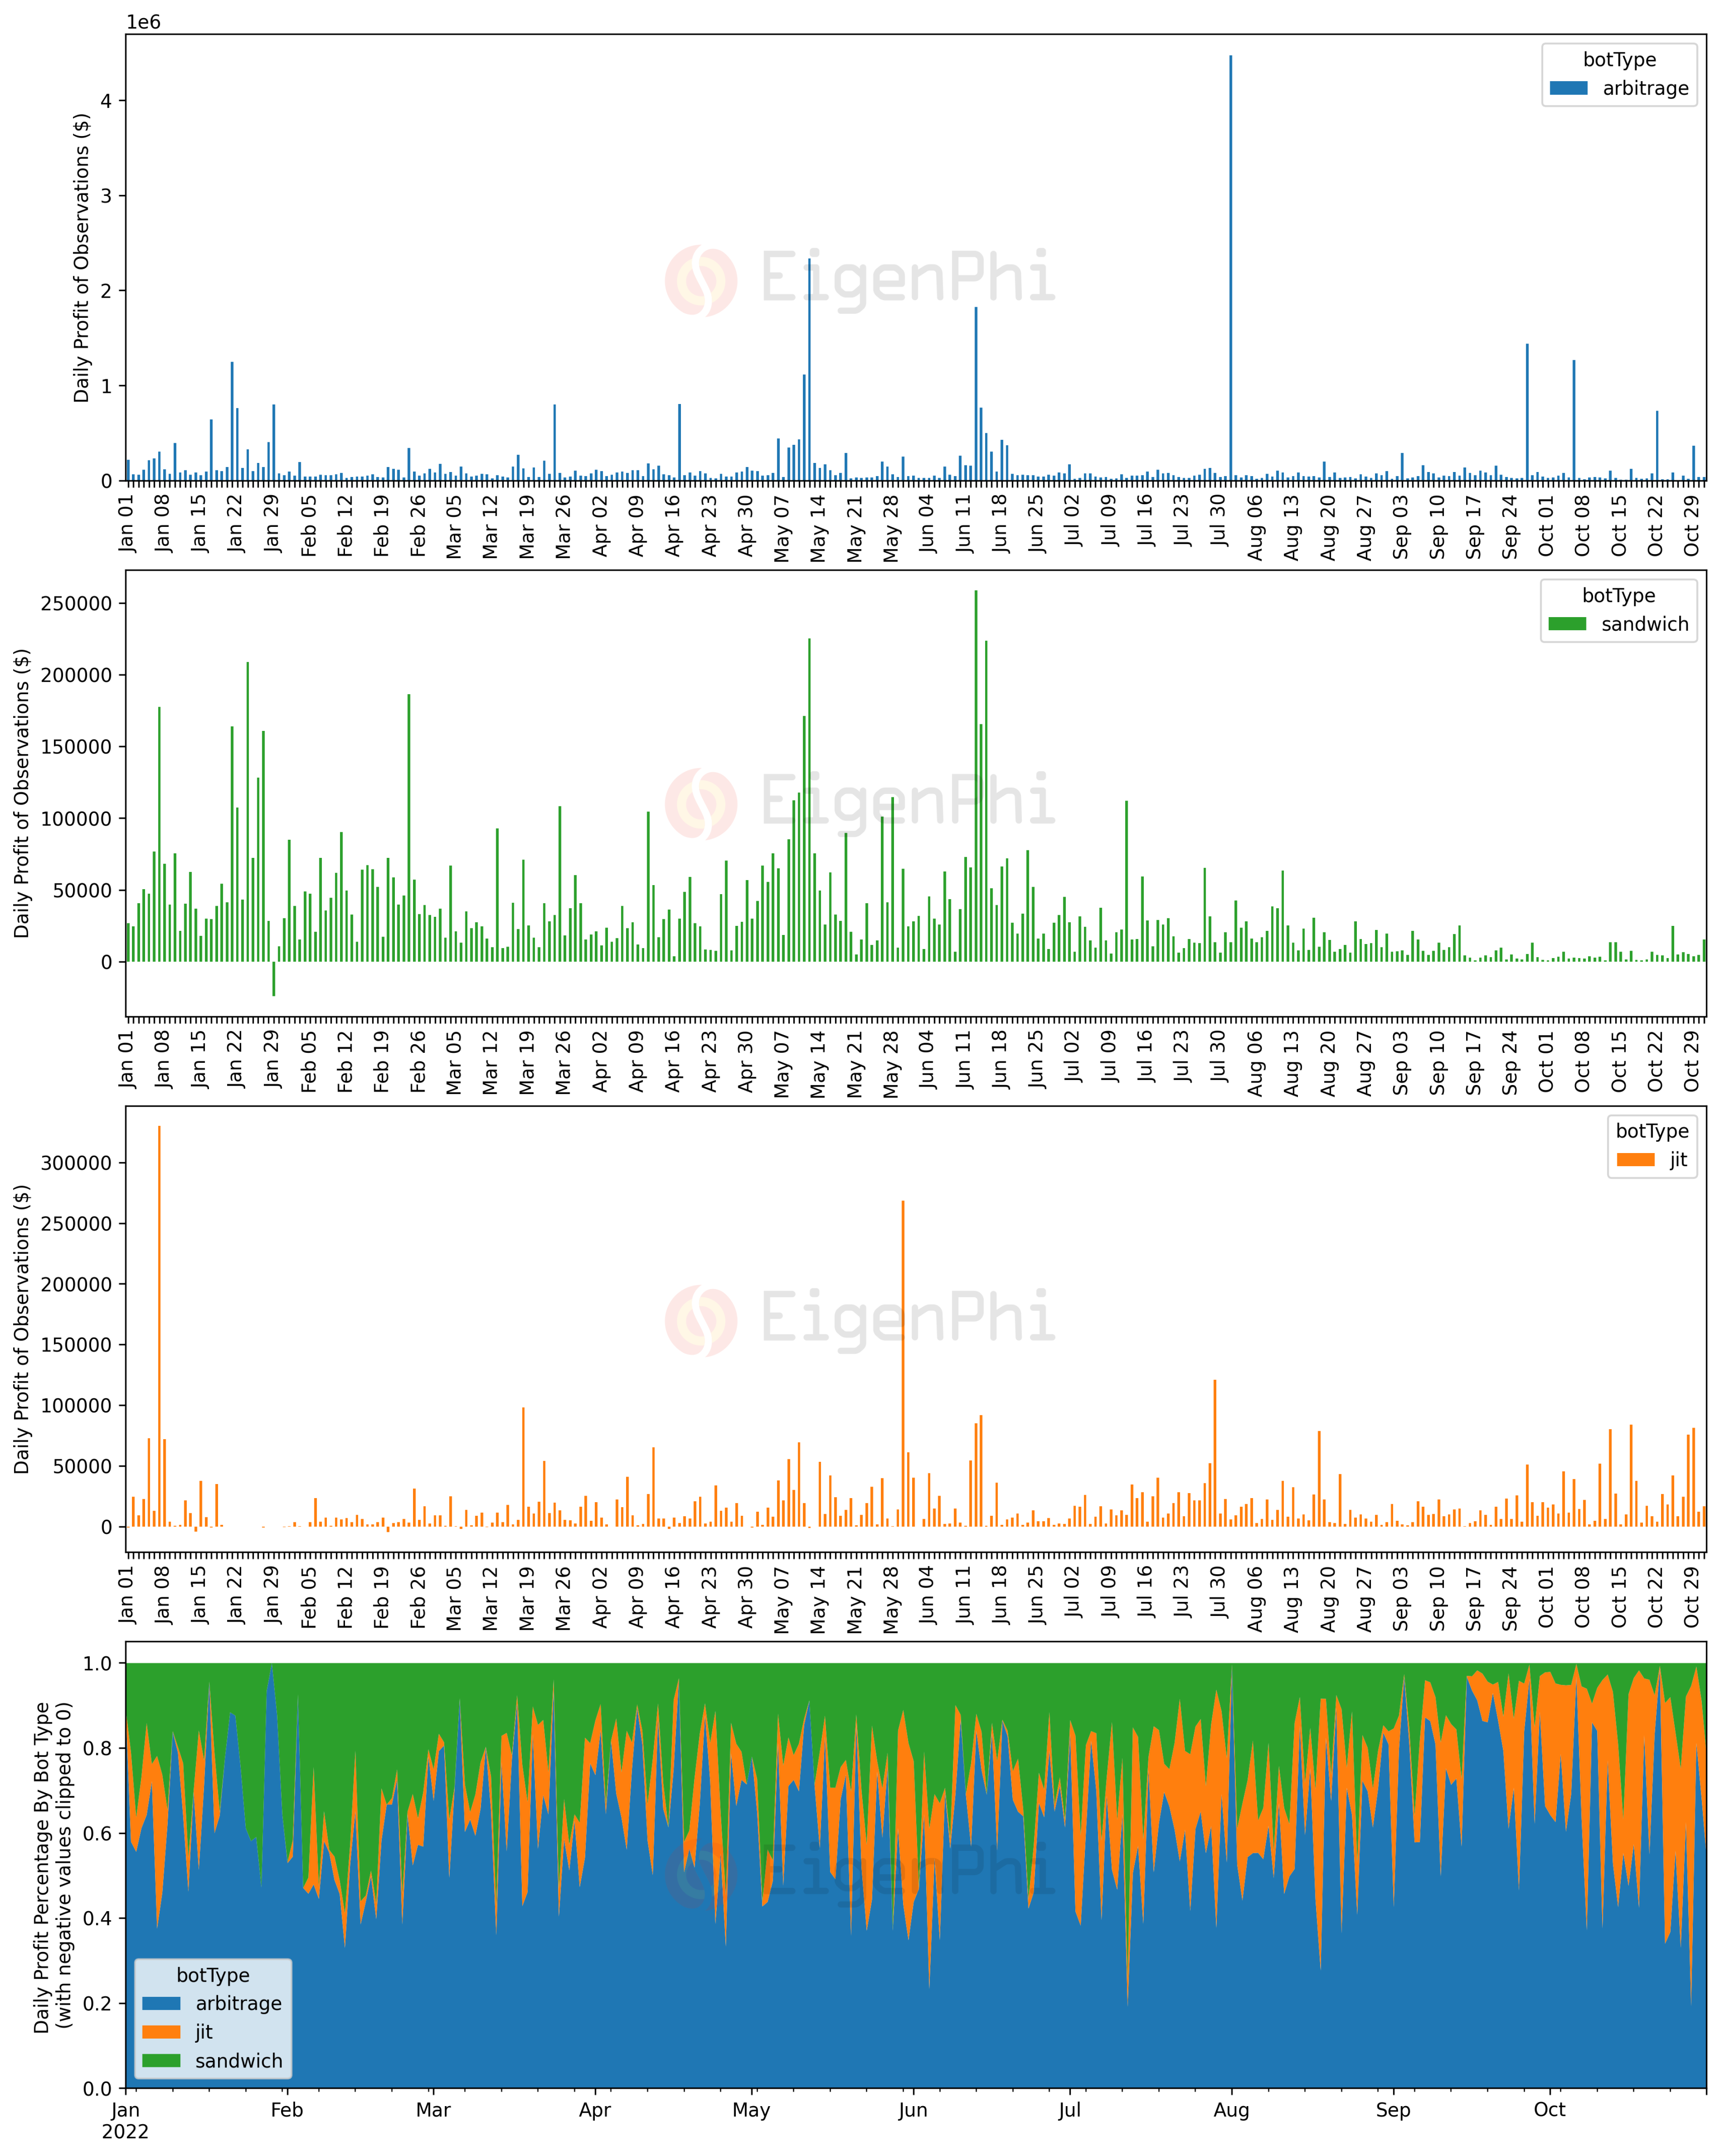
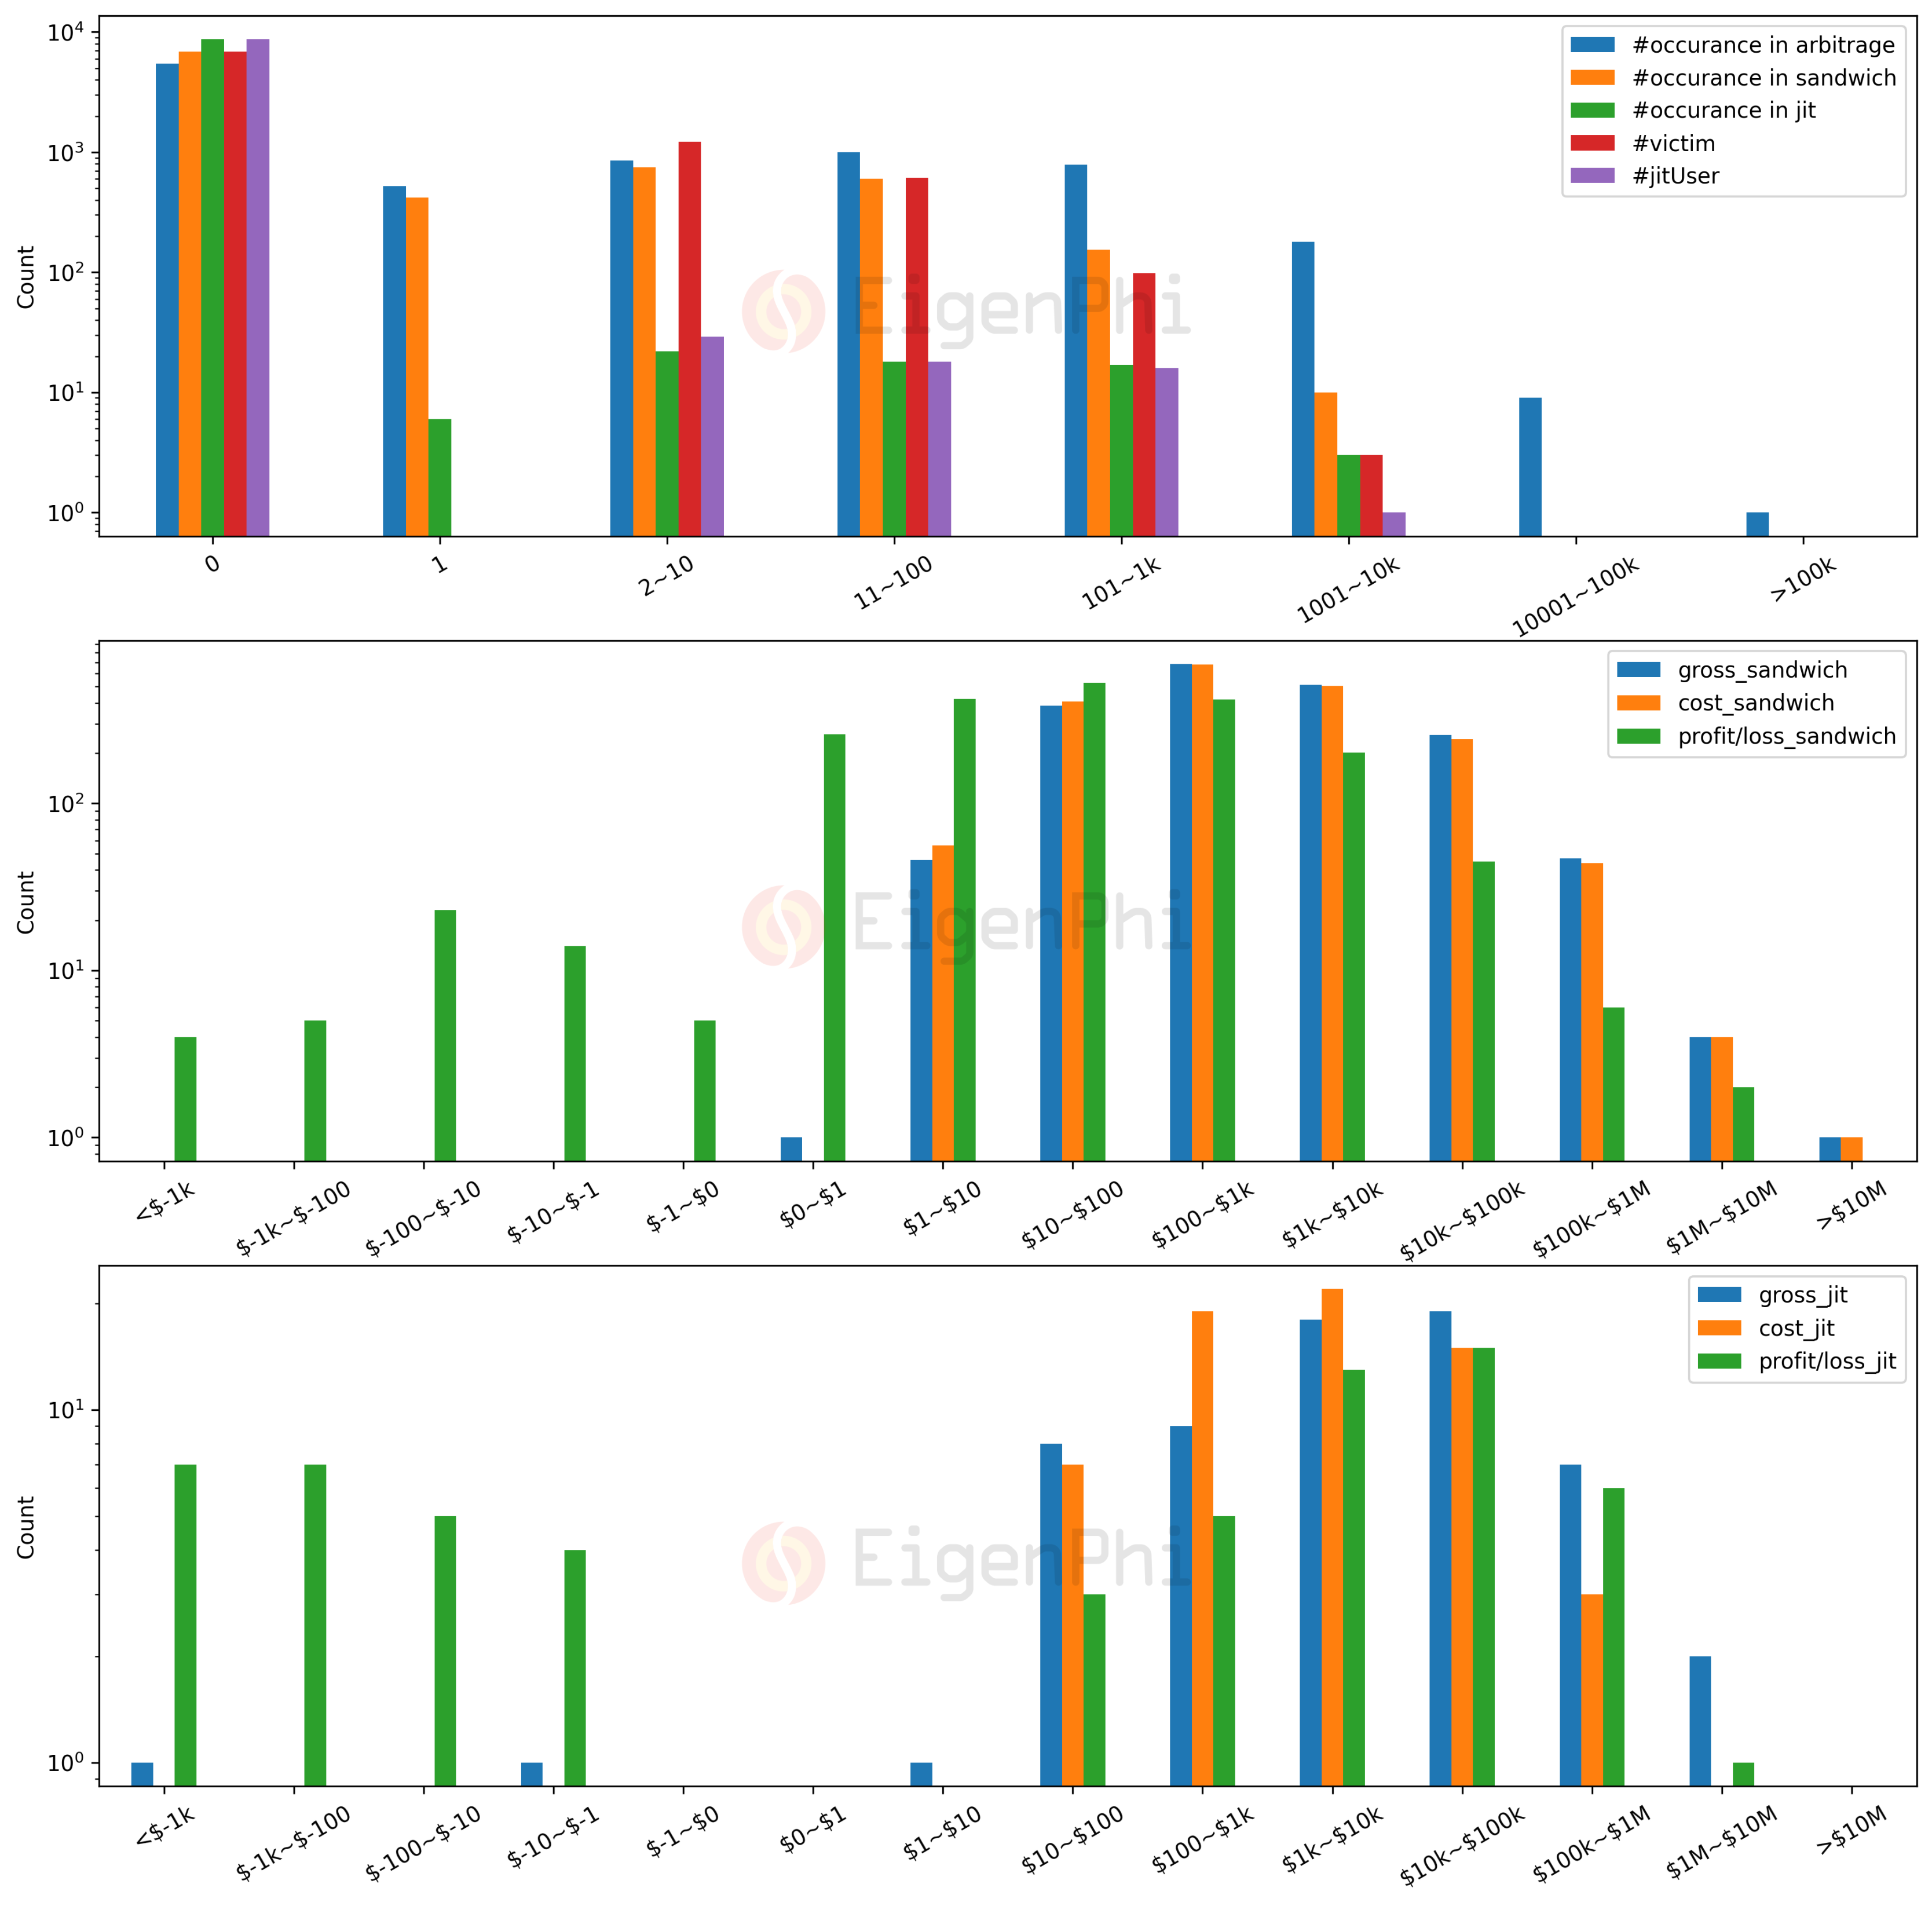
From the daily distribution of profits we can see that the arbitrage and sandwich bots make average profits on most days and have a few lucky days where they earn more than average profits. For example, on August 1st, the daily profit of the arbitrage bot reached more than $4.47 million. On the day, simple space arbitrage contributed 71.6% ($3.2 million). Judging by their daily profit percentages, JIT bots sometimes seem to make more money than arbitrage bots.
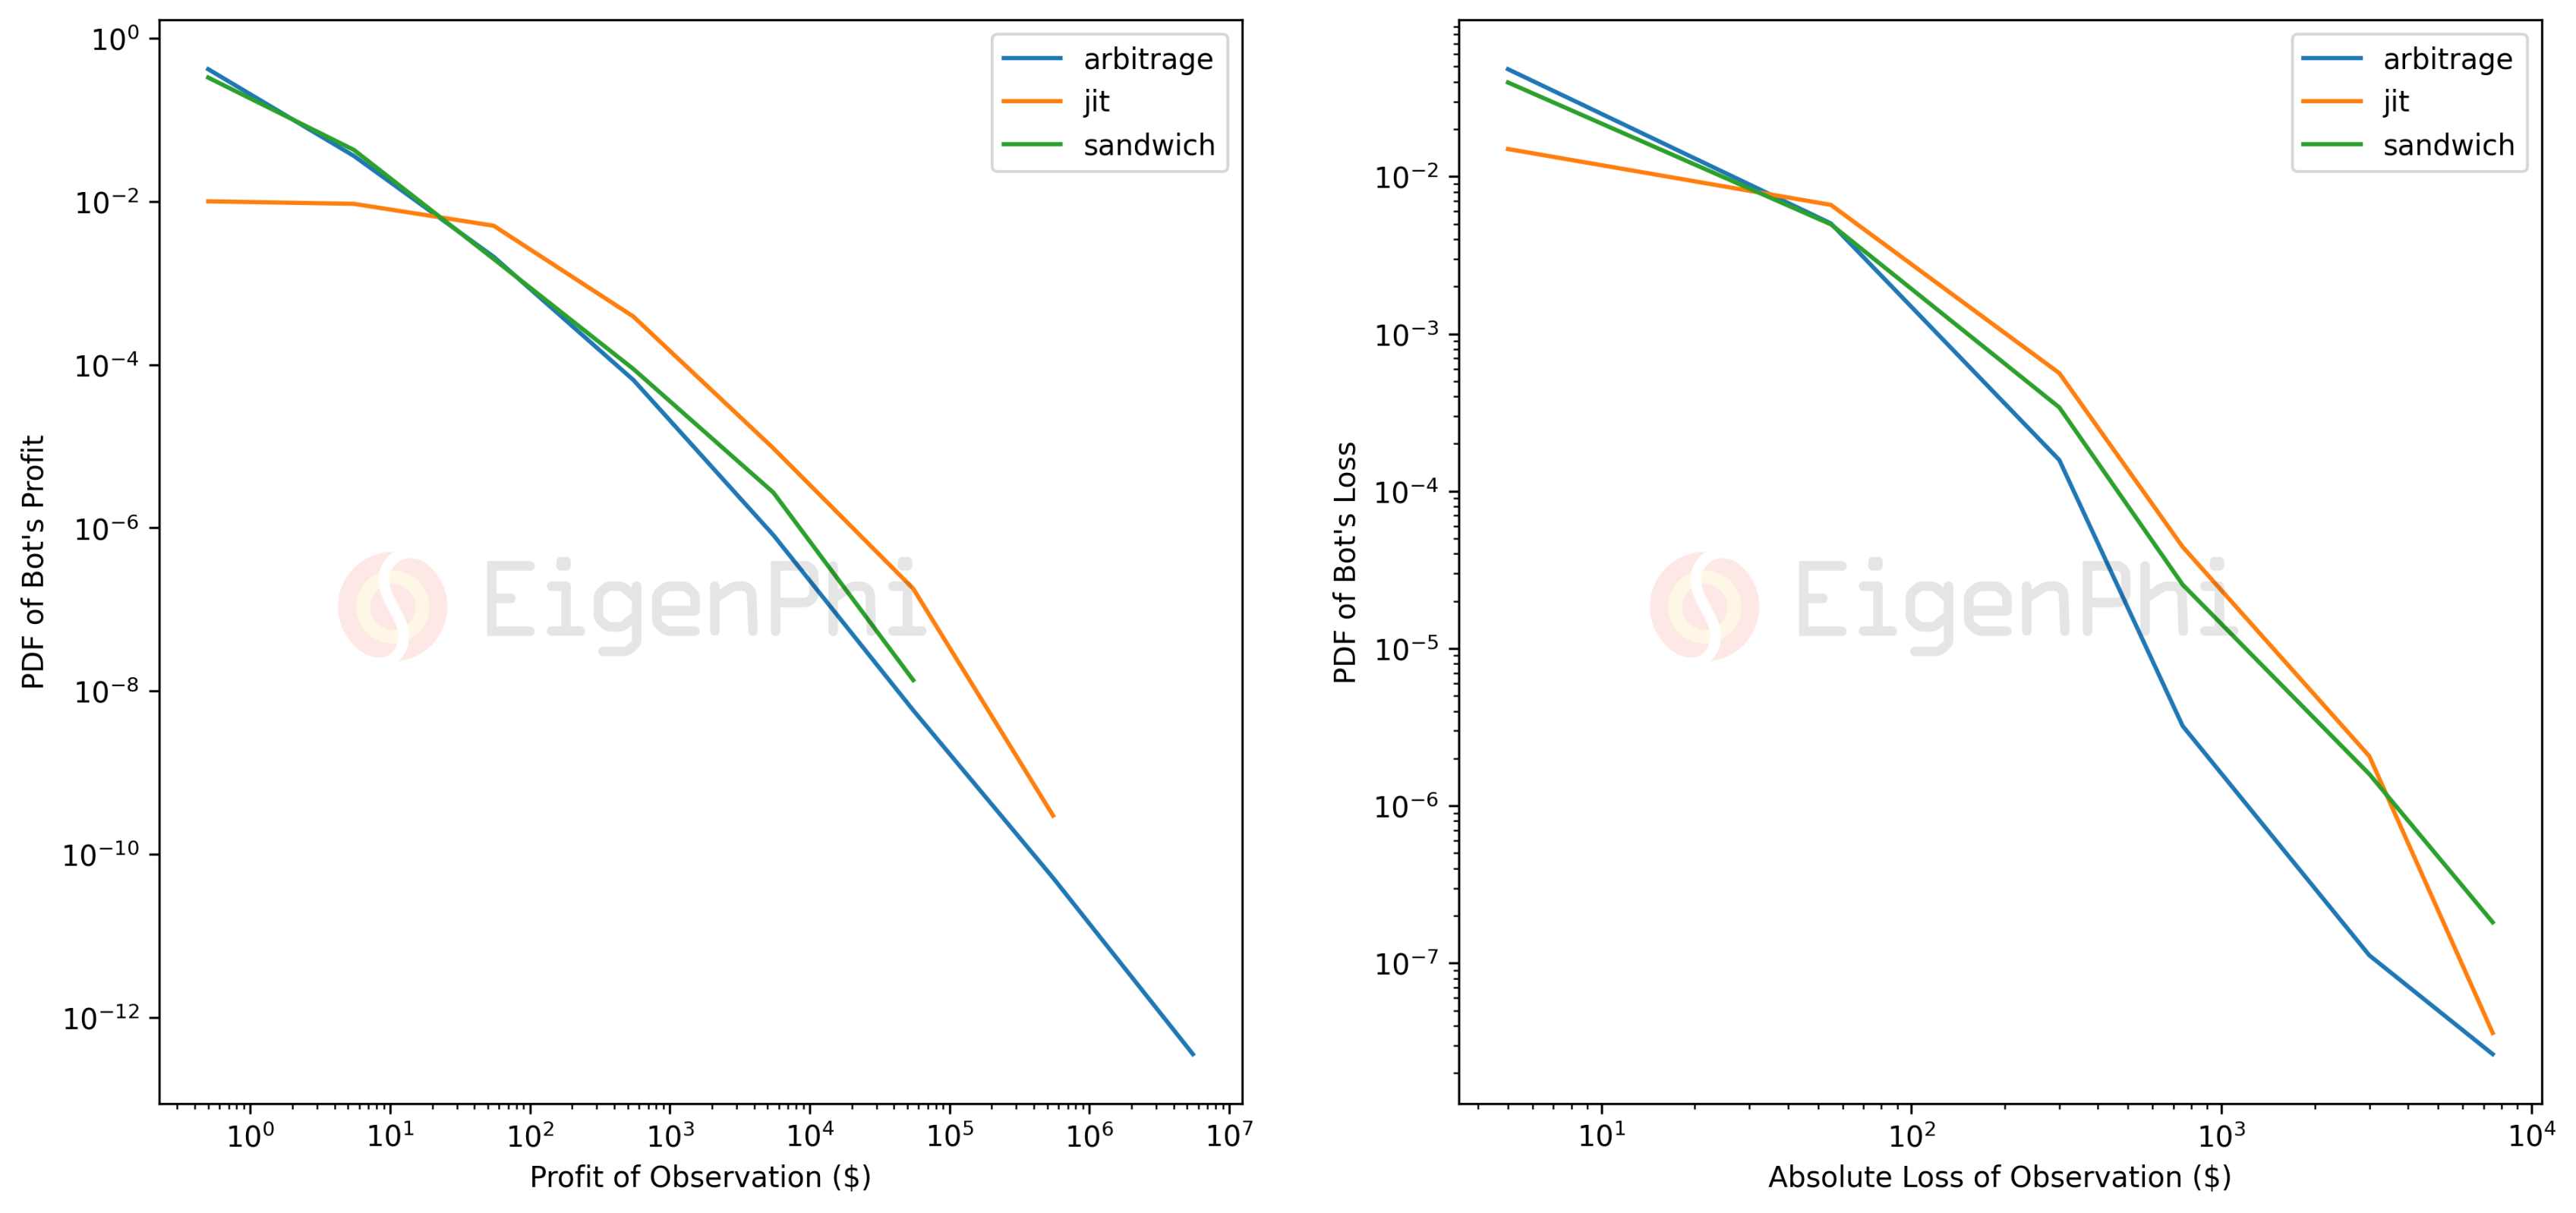
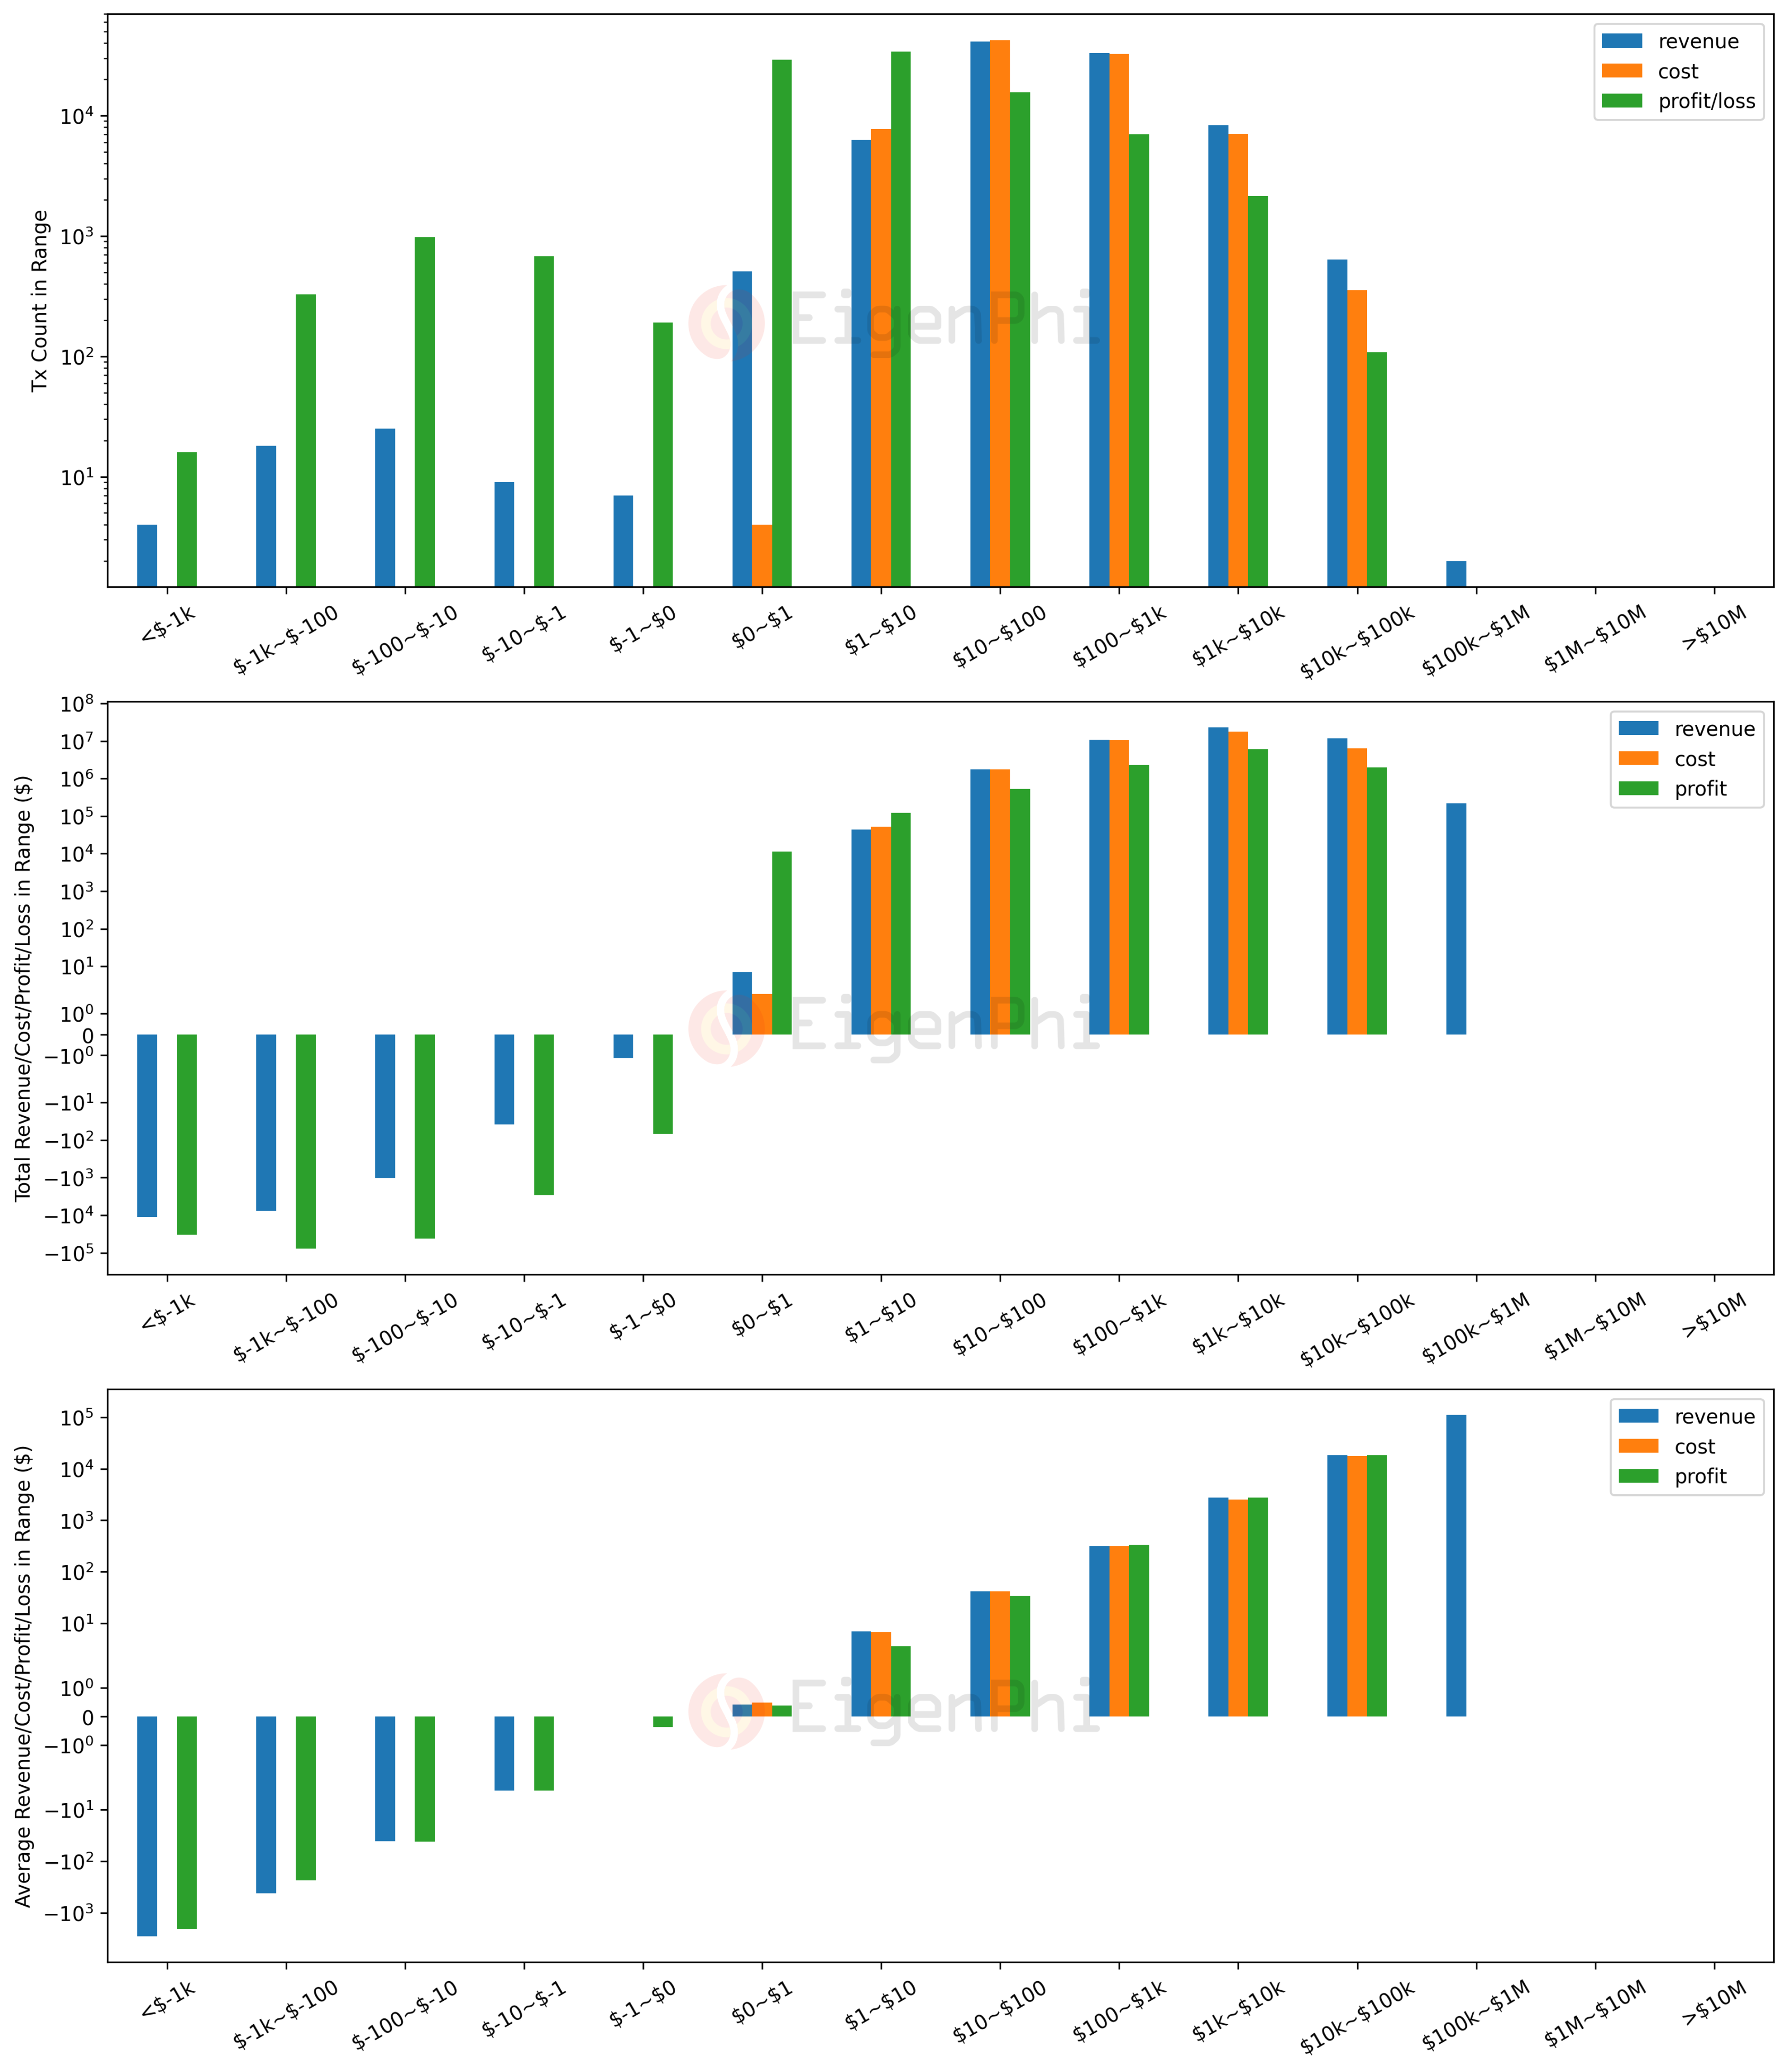
The profit and loss of a single observation conform to the fat-tailed distribution. Compared to the profitability of arbitrage robots, sandwich robots and JIT robots follow the same distribution properties, but the maximum profit in a single observation they can extract is at least an order of magnitude smaller. MEV robots also take considerable damage during a single operation.
Observing cost and value extracted by miners
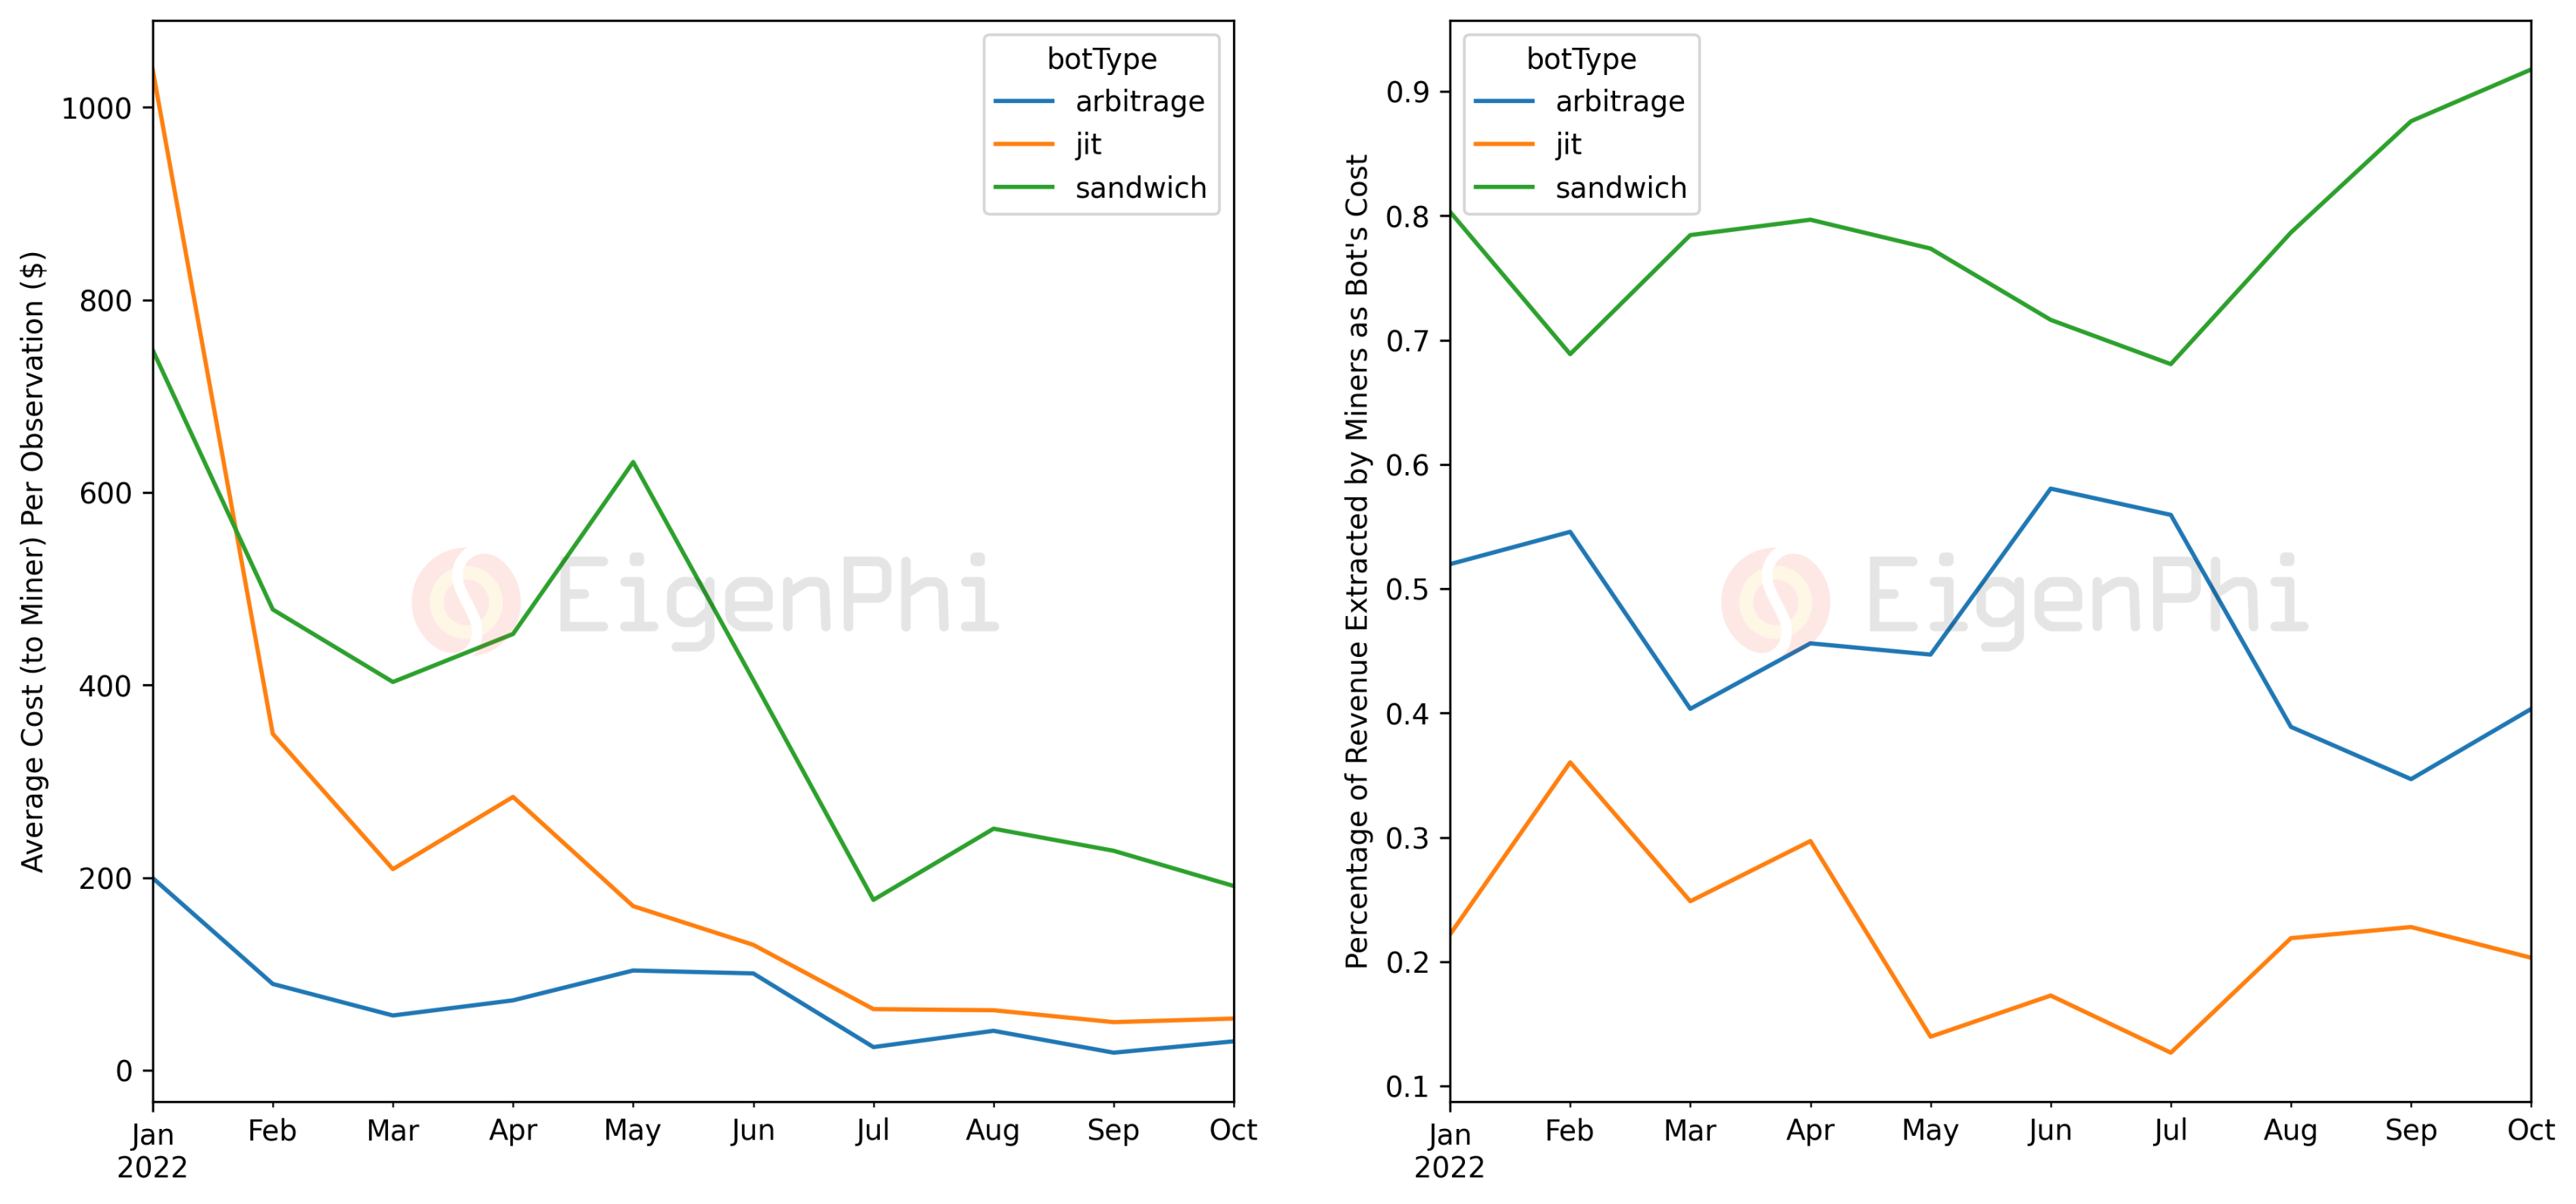
In order to allow miners to package transactions in a timely manner, MEV robots participate in the gas fee auction market, and fierce competition pushes the cost of gas fees very high. Institutions such as Flashbot have launched off-chain auction markets where some of the auction costs are converted to miner tips in the form of coinbase.transfer(). These two parts constitute the main explicit cost for MEV robots to participate in the MEV market. Using this as a percentage of revenue gives us an idea of the level of profit margins for bots, and how much MEV value is being extracted by miners.
Average transaction costs (gas fees and miner tips) for bots are generally on the decline. However, the cost of sandwich robots is higher than the other two, and the proportion of income allocated to miners has increased significantly, approaching 90% in October.
The proportion of revenue arbitrage bots paying miners is on the decline, below 50% in October. Miners have the lowest percentage of value extracted from JIT bots, which is consistent with the fact that they are currently engaged in less competition.
Overall, more than half of the extracted value actually went into the pockets of miners.
impact on the pool
We can also observe which liquidity pools are more likely to participate in MEV activity. Let's break this problem down into feature analysis and correlation analysis tasks. In this report, first we present a general result.We merged the Uniswap V3 liquidity poolmetadata
and MEV activity parameters grouped by liquidity pool address, as shown in the figure below. Since the profitability parameters of arbitrage bots involve Uniswap V3 liquidity pools and other venues, we set them aside and focus on the frequency of bot activity, the profitability of sandwich bots and JIT bots, and the profile of trading users involved.
The results show that more than 80% of the profit of Sandwich Robot comes from the top 10 liquidity pools sorted by trading volume. However, only 20% of sandwich activity occurs in these liquidity pools, which means that liquidity pools with high trading volumes are more likely to be extracted from by sandwich bots, but trading users of other liquidity pools may still often be caught in the middle . This fact is also validated by the distribution of the number of unique transacting users in each pool subjected to sandwich activity. Some liquidity pools also did not participate in sandwich activity in the time frame we observed.
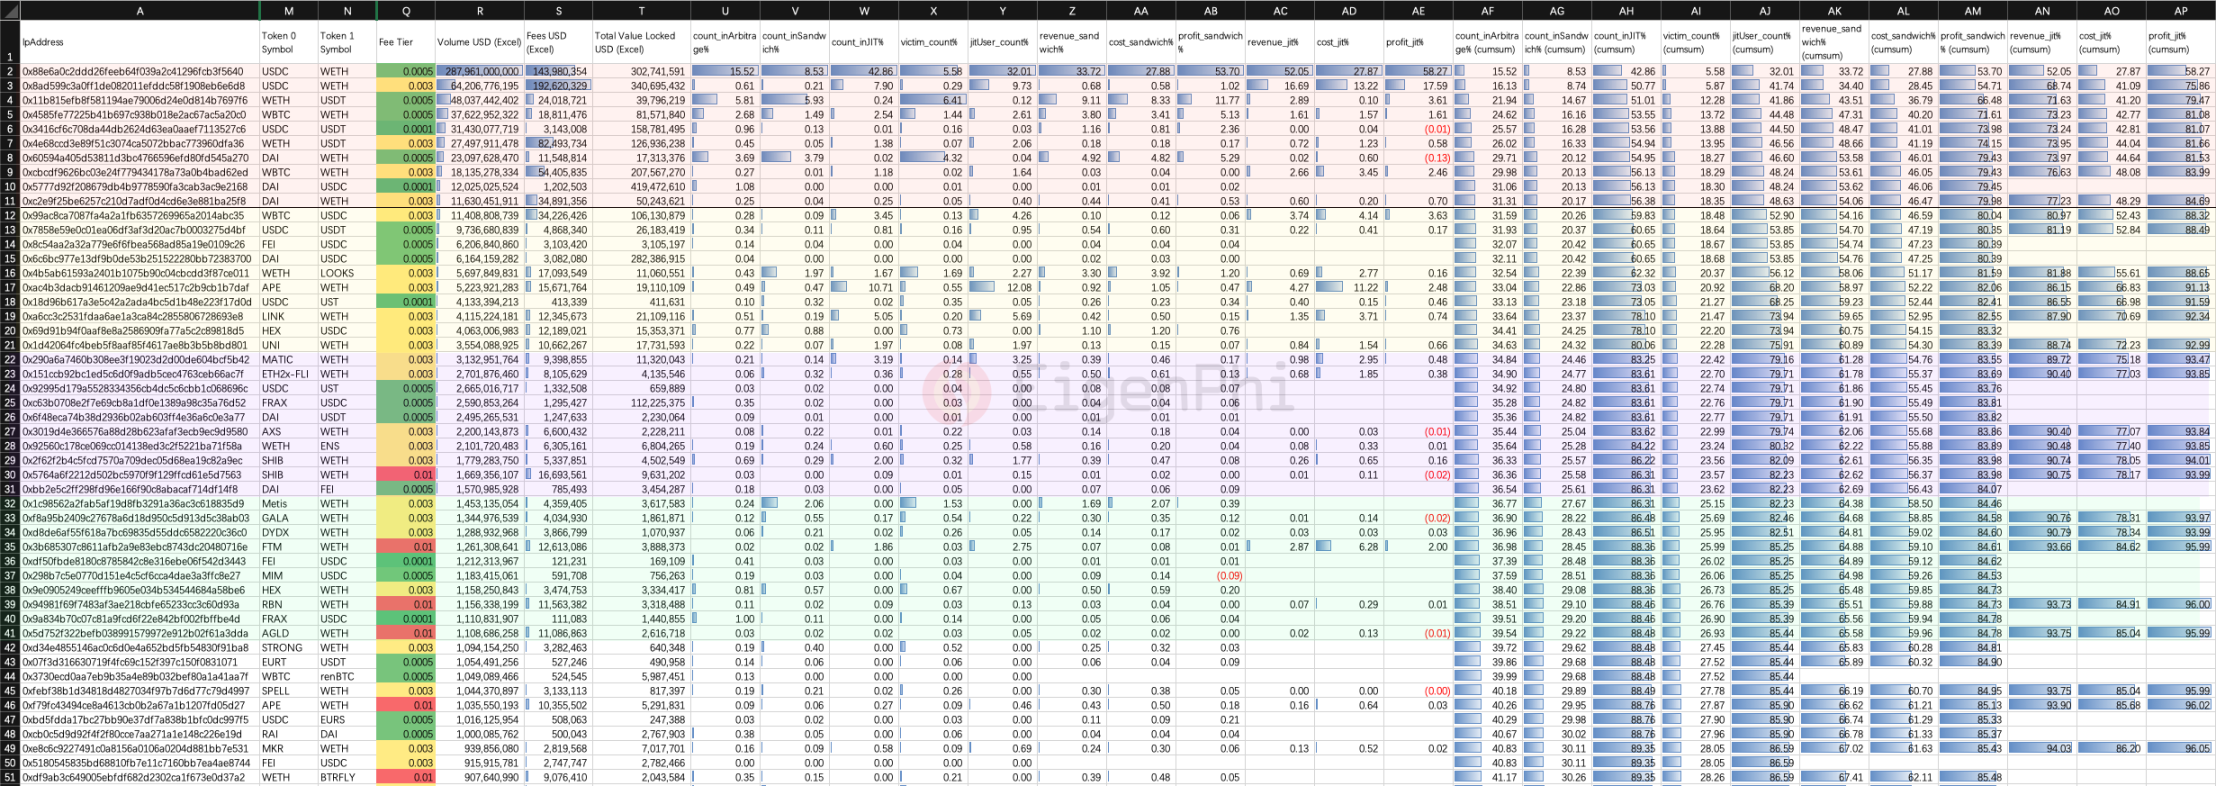
As for JIT bots, they seem to focus more on the top 10 liquidity pools by volume, 84% of profits are drawn from these pools, and 56% of JIT activity also occurs here.
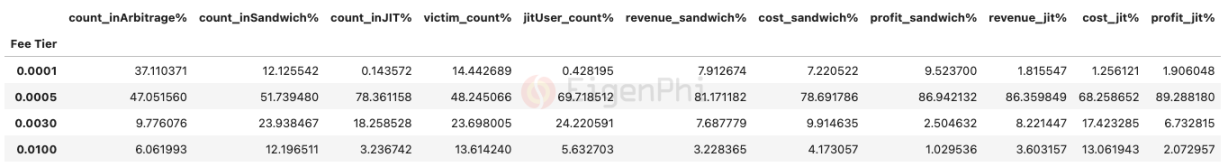
Pools with fee levels equal to 0.0005 or 0.0001 are more likely to be withdrawn in terms of the average frequency of activity of arbitrage bots in these pools. Pools with a fee class of 0.0005 are mostly affected by sandwich activity. JIT activity also occurs primarily in pools with a fee class of 0.0005.
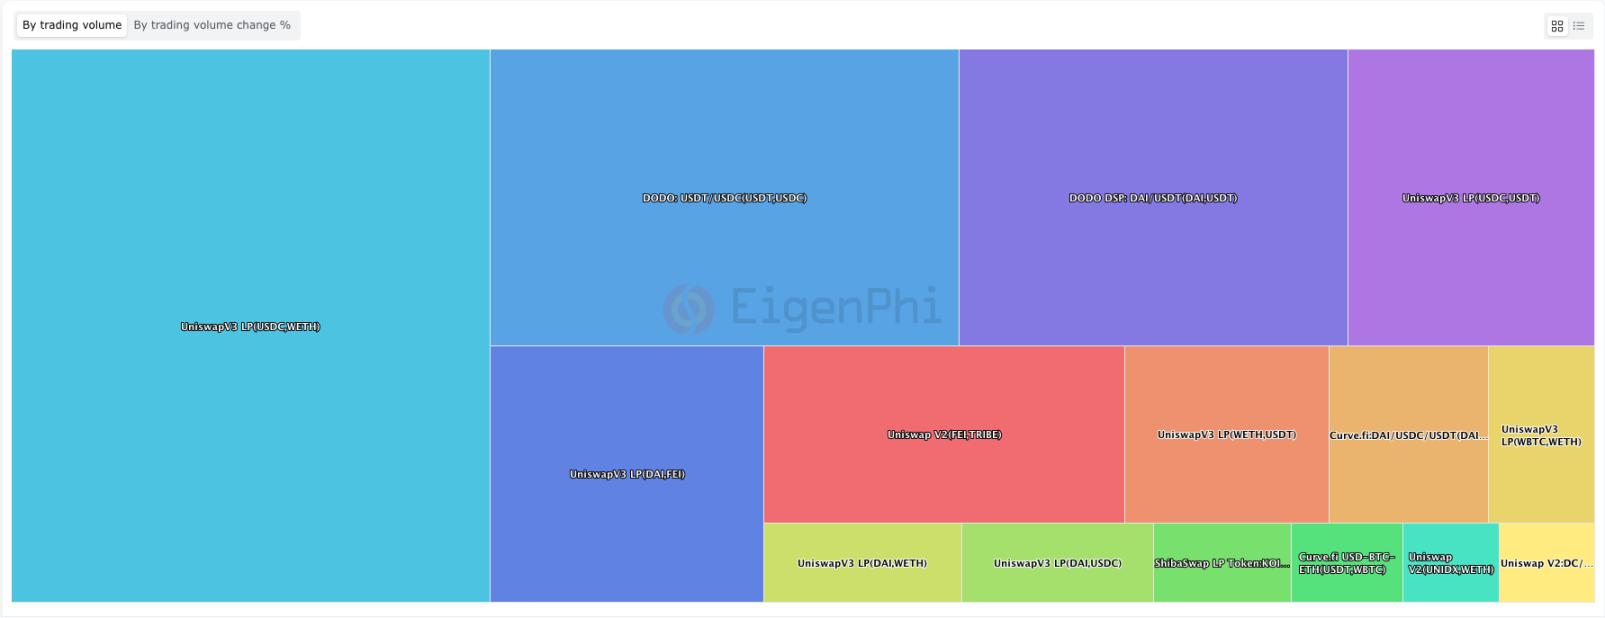
We also show histograms of several parameters grouped by pool address. The results also follow a fat-tailed distribution, meaning that a small group of pools is much more involved than average.Uniswap V3 liquidity pools related to cryptoassets, USDC, WETH, and USDT are the most preferred liquidity pools for MEV bots to interact with compared to other venues.See real-time stats on top liquidity pools in MEV activity sorted by volume or percent change in volume.
participant
participant
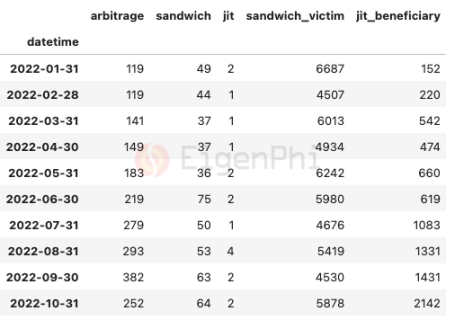
The interaction relationship between MEV robots and other users is also a fascinating topic. The table and figure below compare the number of different agent types participating in MEV activity in our observation range. From the table below, we see a growing trend of unique transacting user addresses that can benefit from JIT activity.
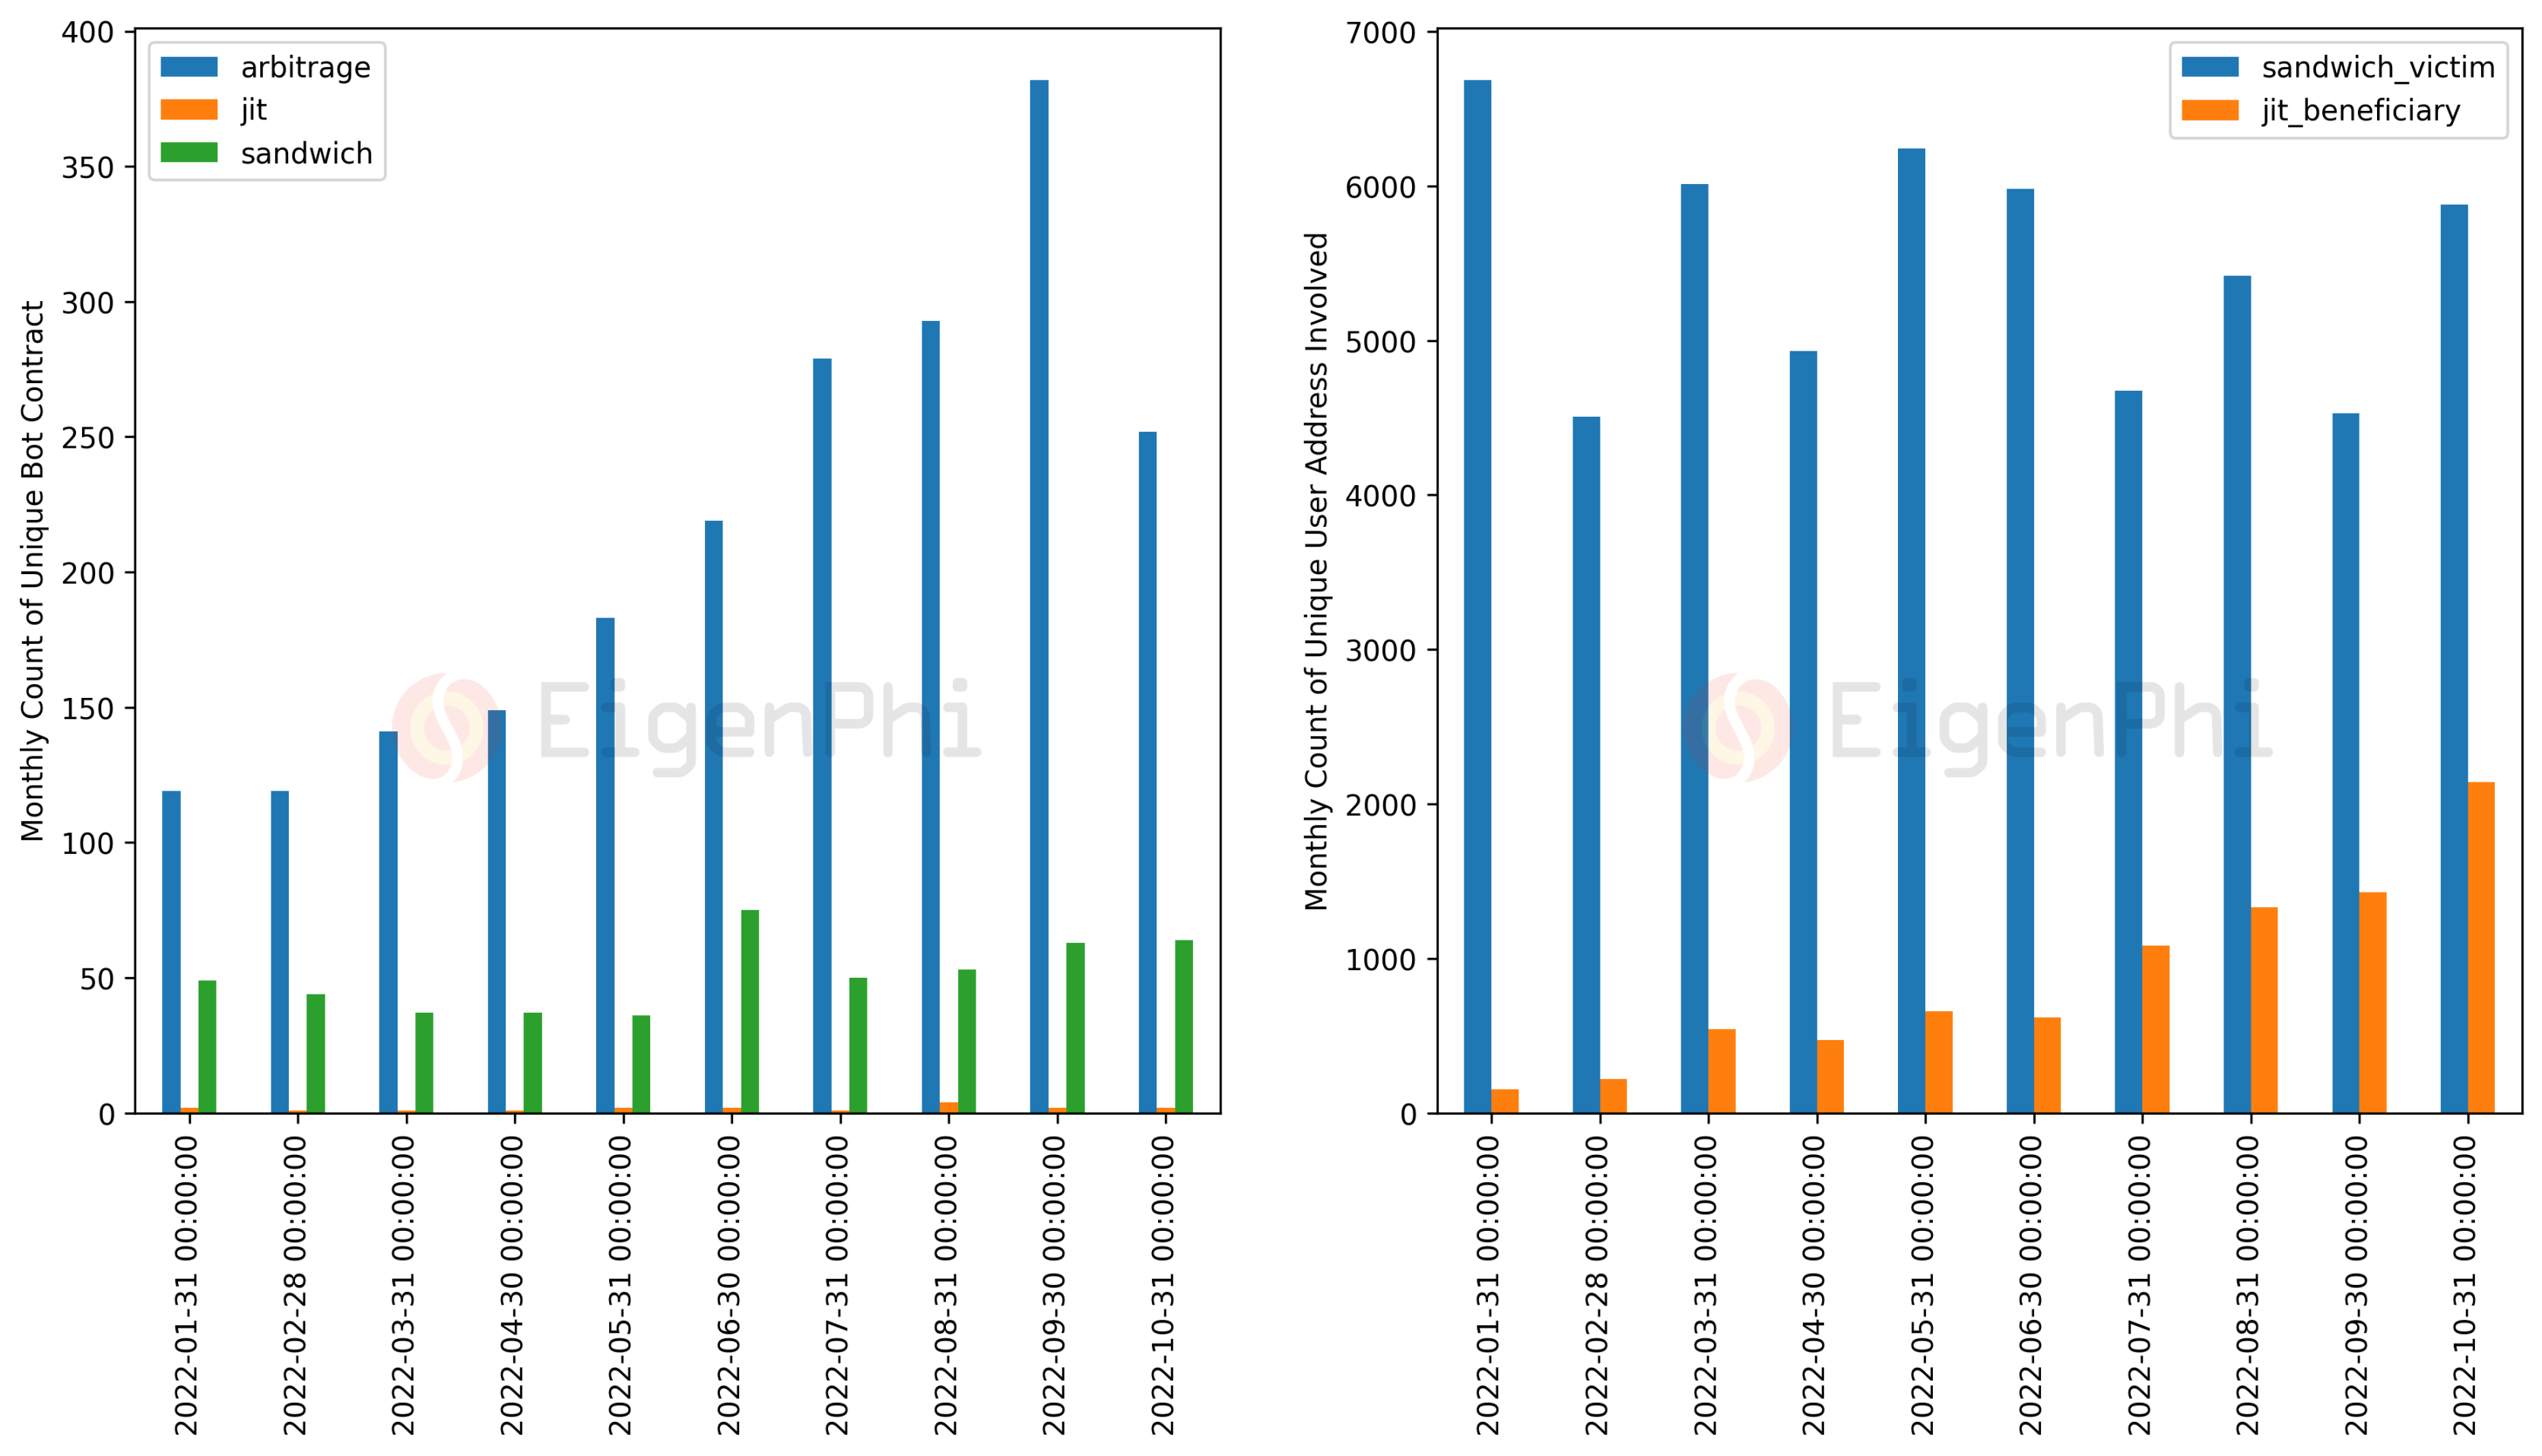
However, by counting the number of unique bot contracts and user addresses involved, it is difficult to comment on how many entities are behind these addresses, since different addresses may belong to one entity. A vivid interactive network mapping the transaction relationships of these addresses can help to better understand this issue, which is not covered in this report.
Arbitrage Bot
Arbitrage Robot Leaderboard (Top 20)
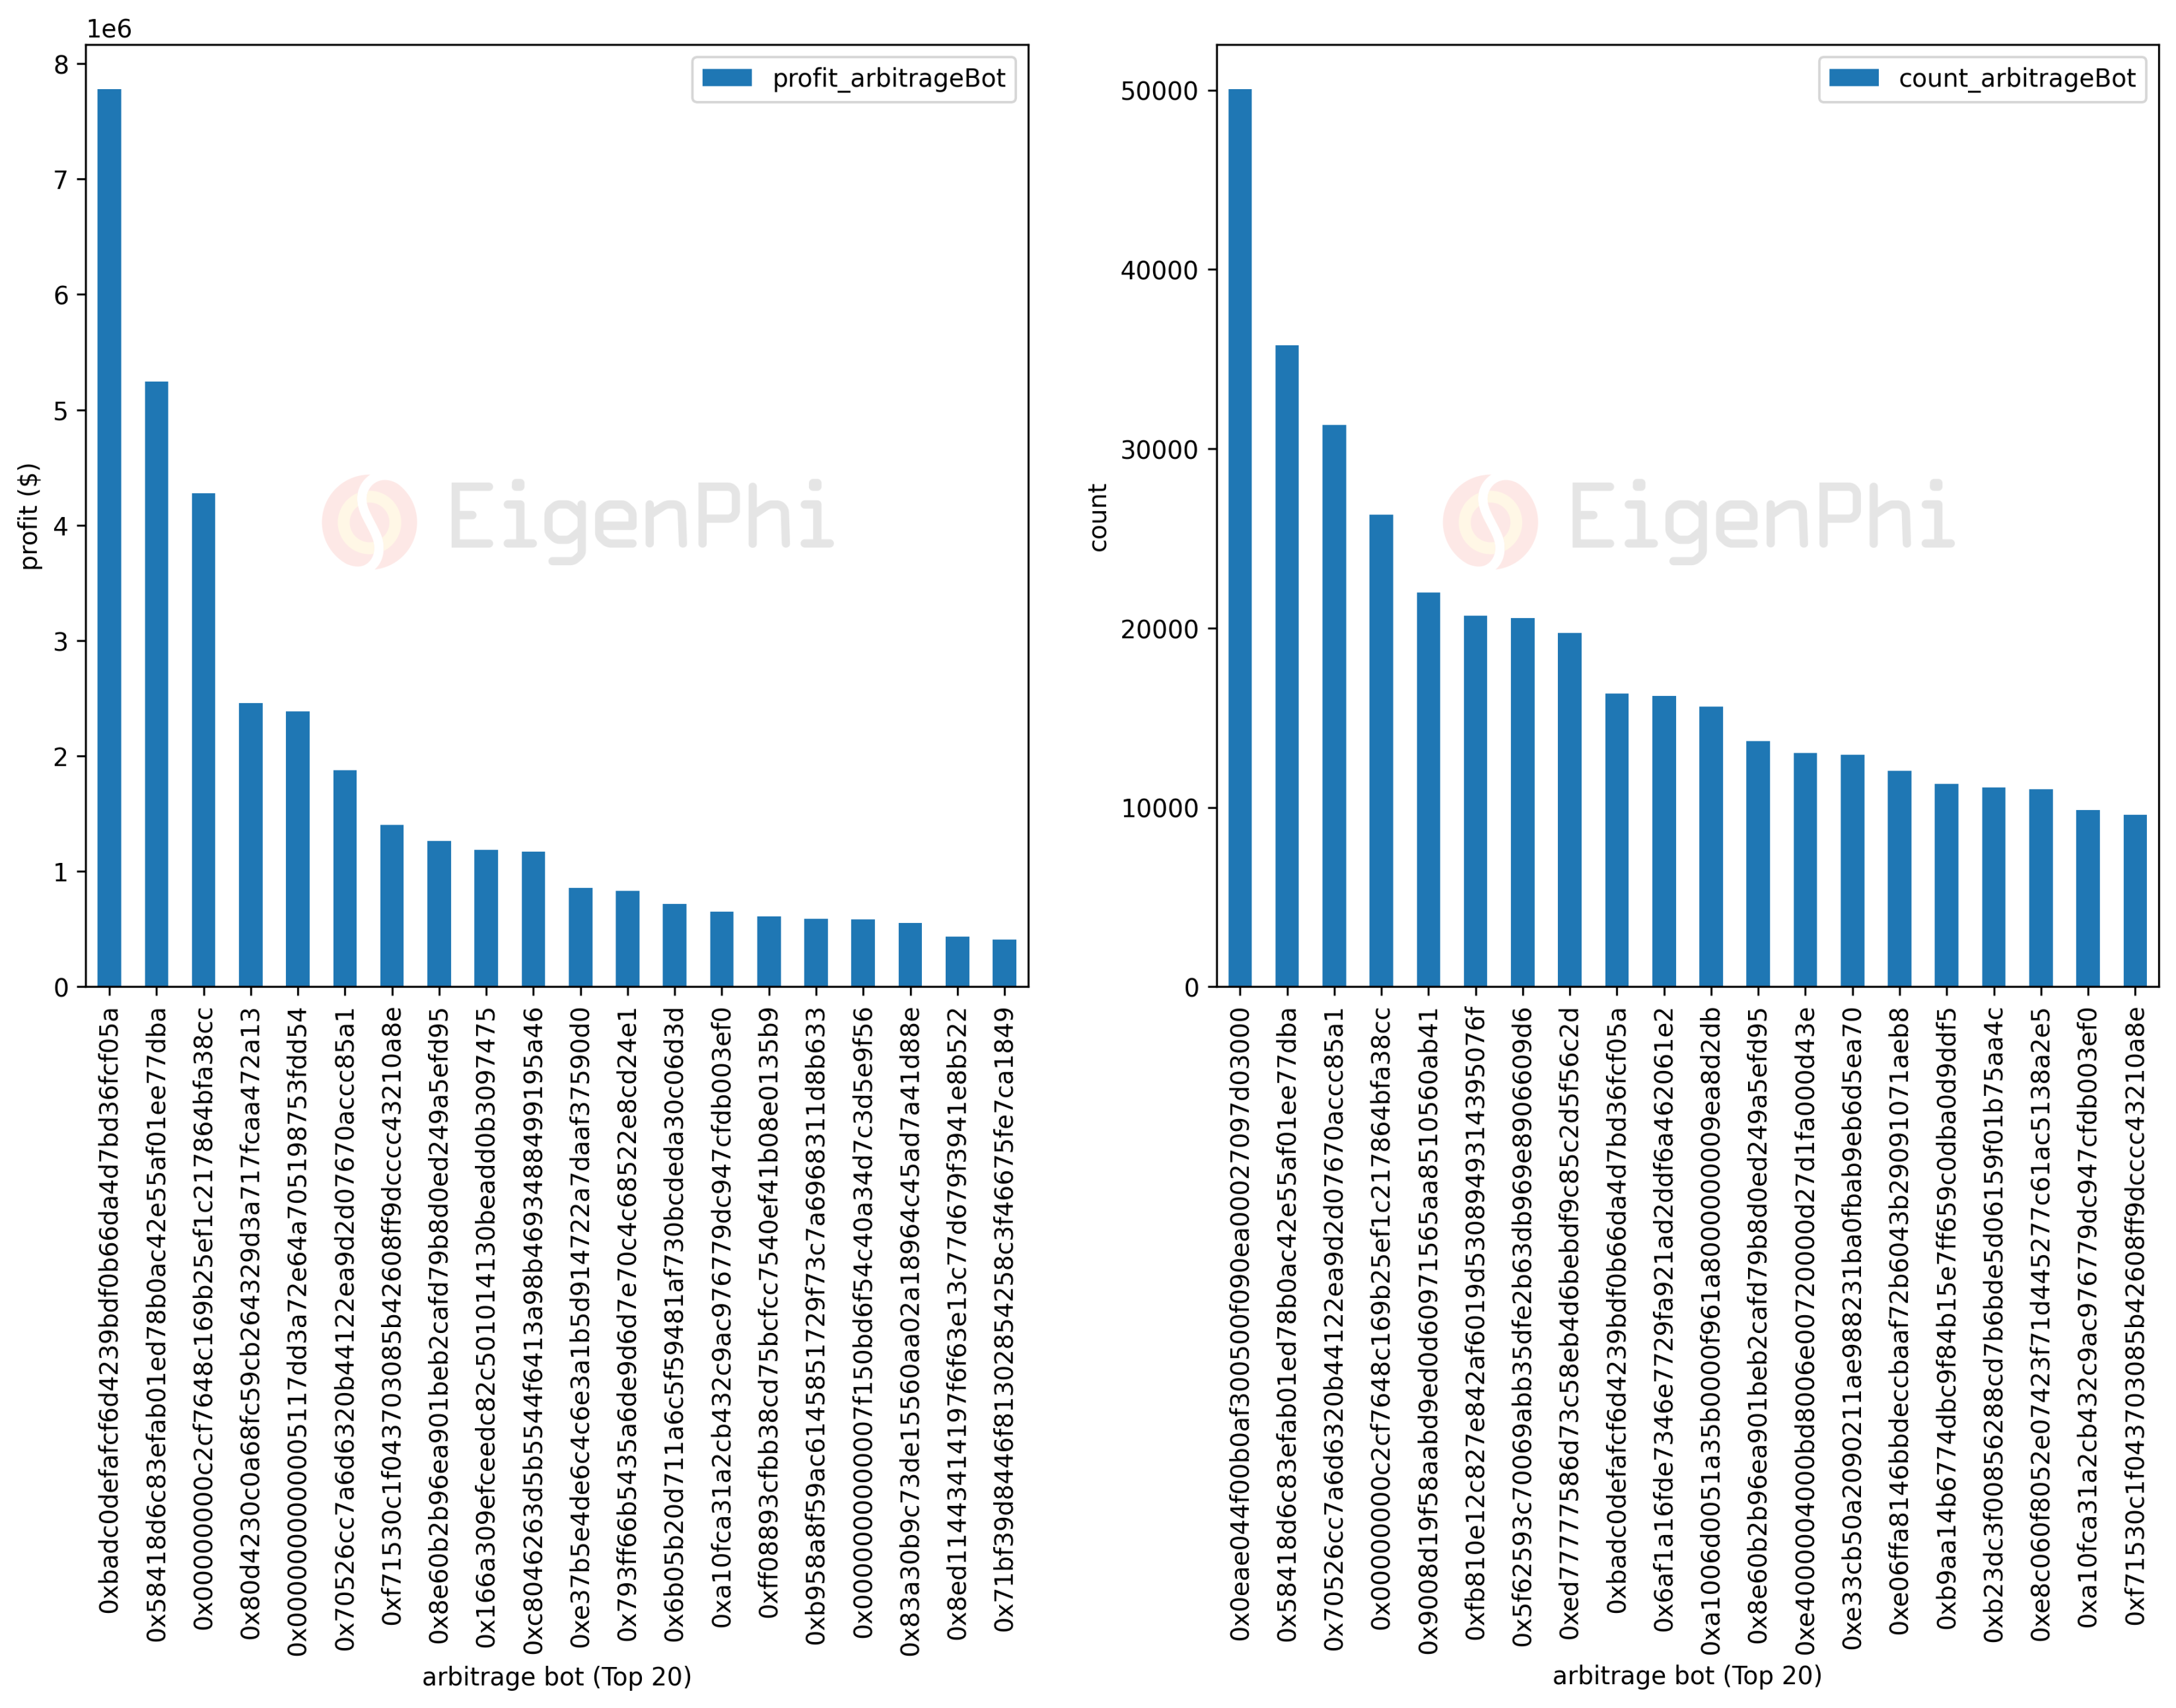
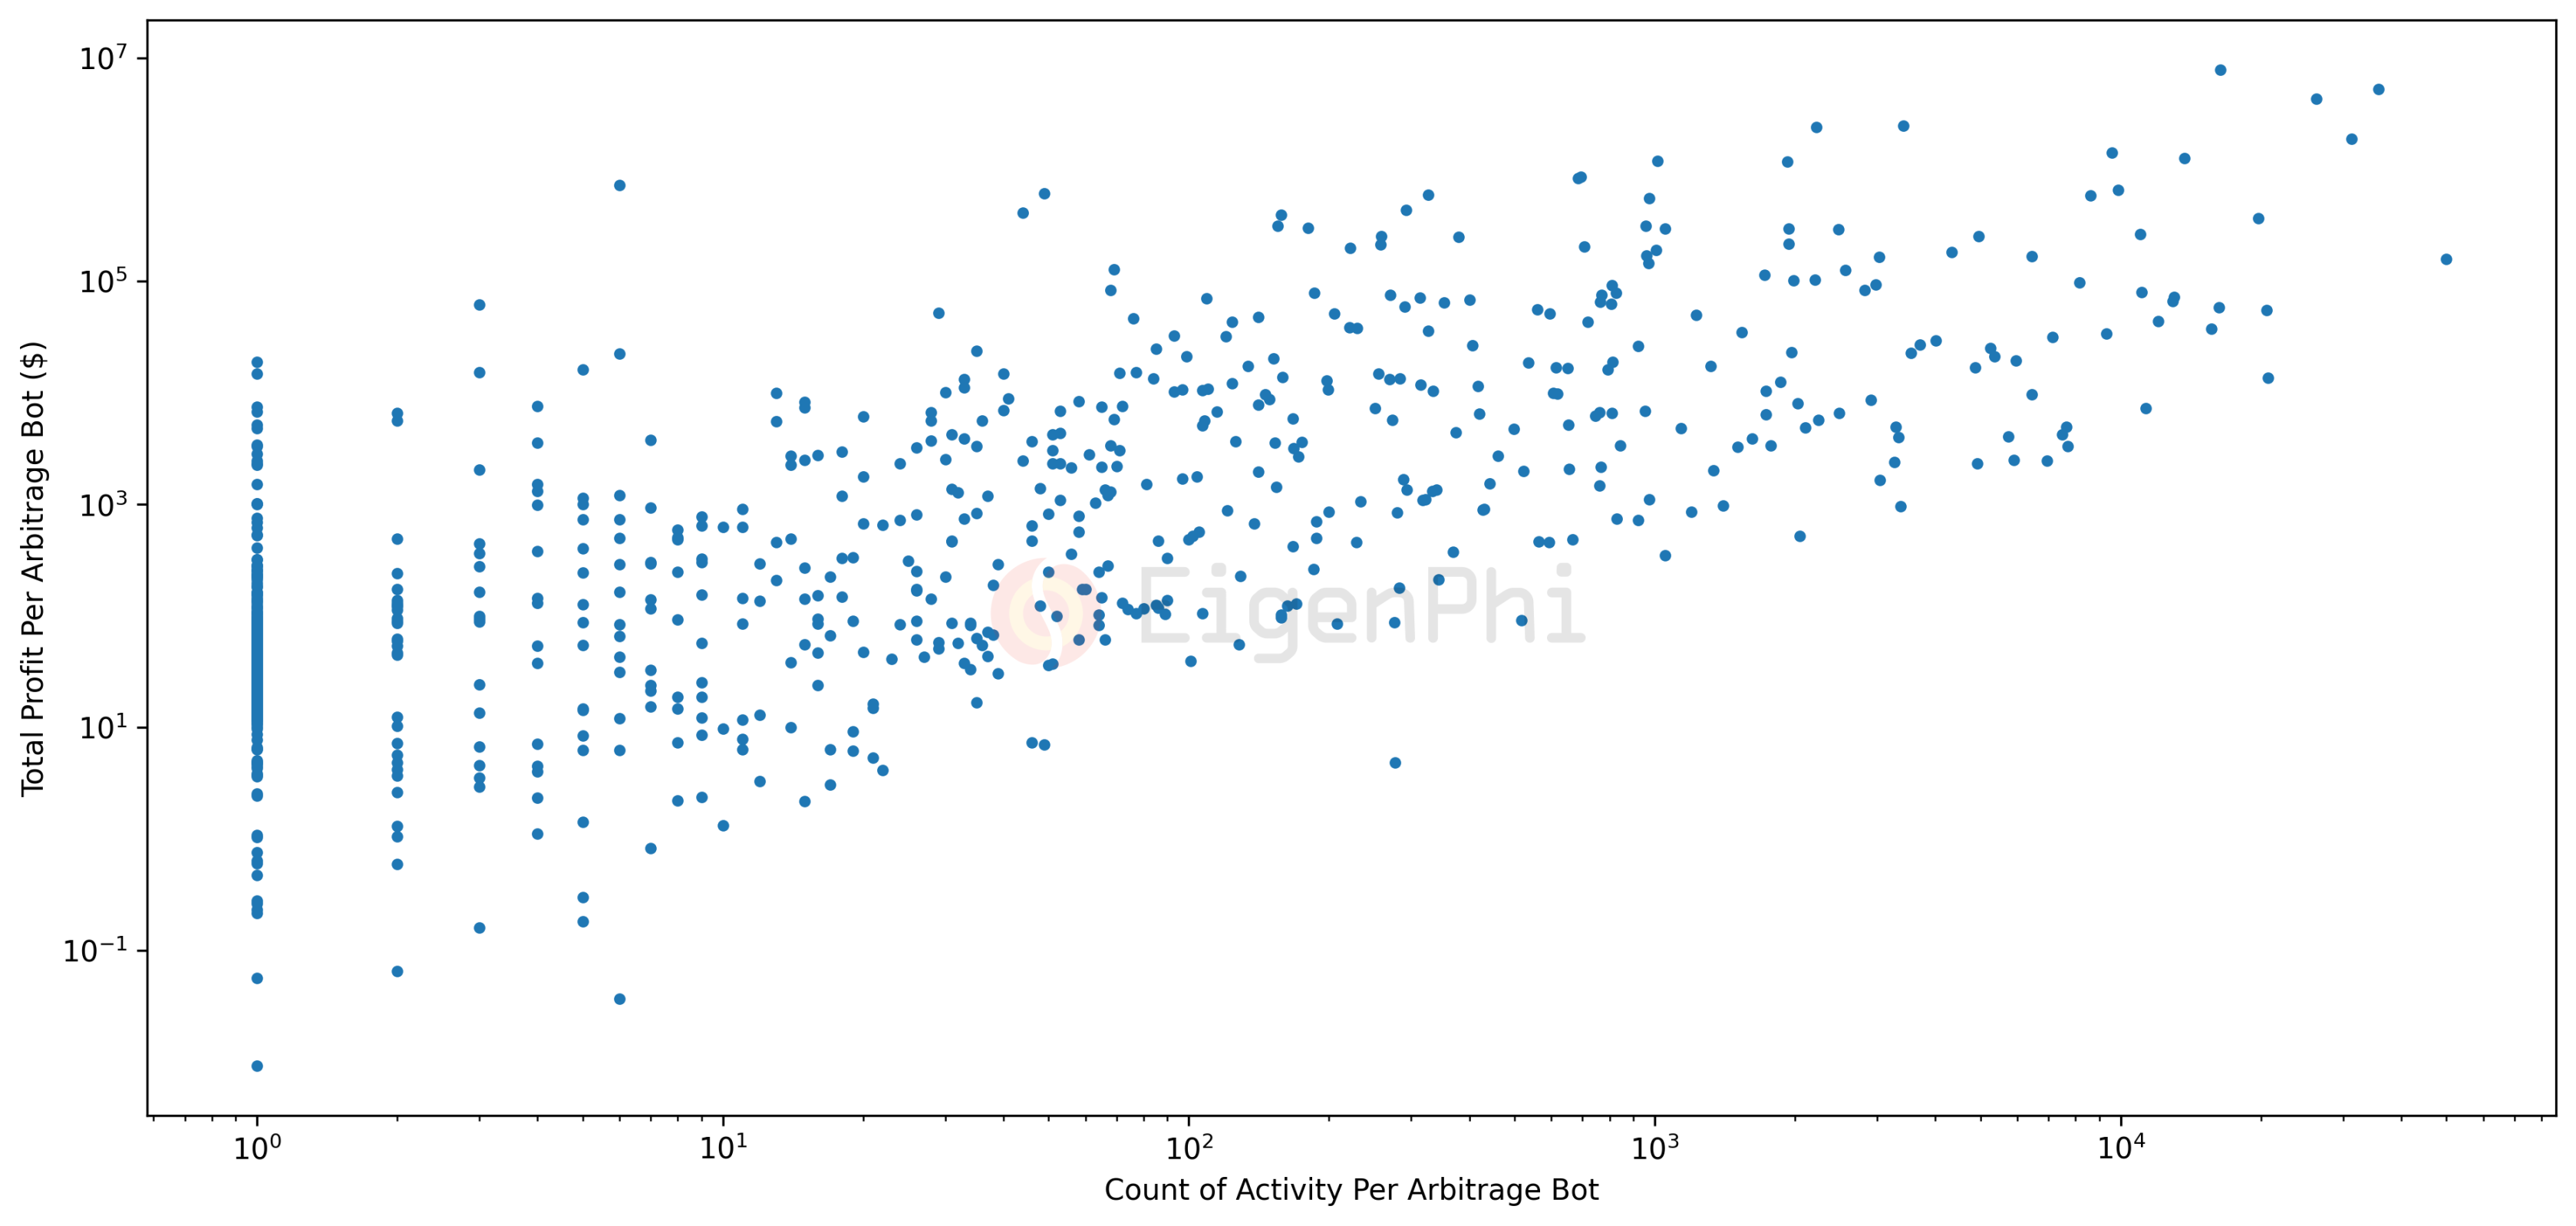
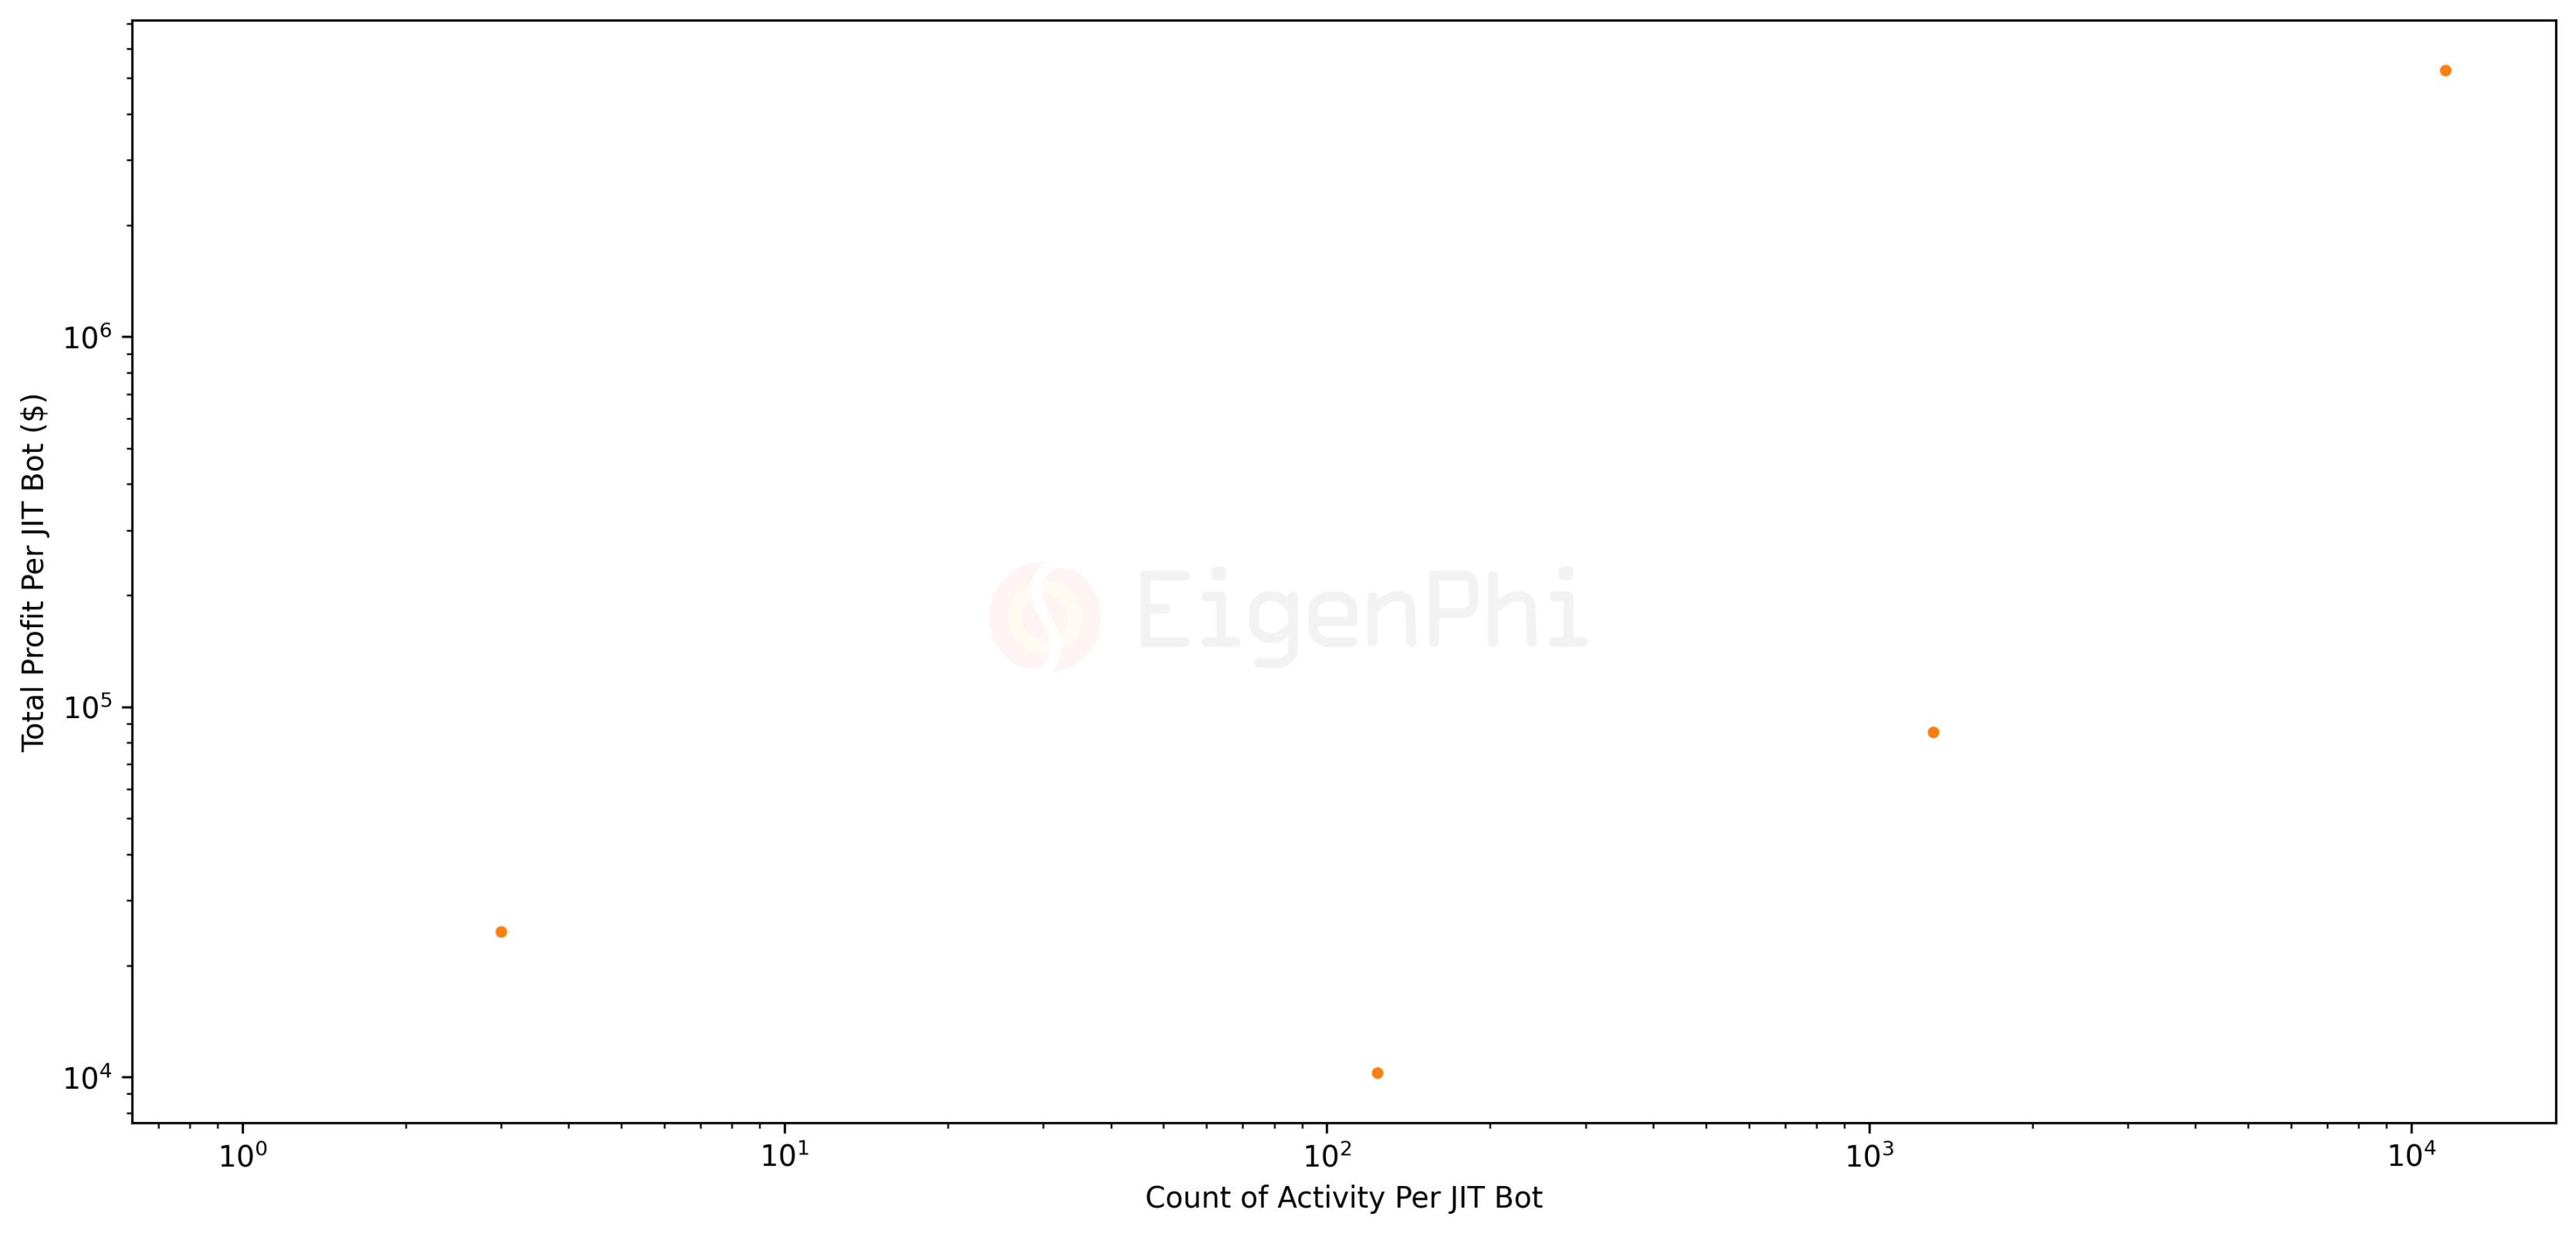
The chart below shows the top 20 arbitrage contract addresses sorted by total profit and total activity count, respectively. The relationship between total profit and total activity count is positively related to the upper limit of profit that the robot can extract the most.
Frequency of arbitrage patternsWe can observe the structure of the arbitrage trade by counting the number of venues involved and the percentage of Uniswap V3 pools involved. The top 10 possible combinations show that a pool involving a Uniswap V3 pool and another venuespace arbitrage
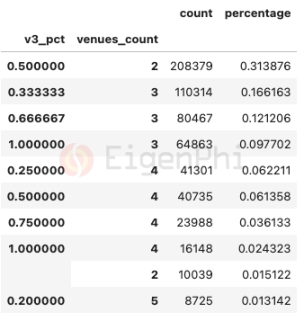
is the most common mode. Two common patterns that follow are triangle arbitrage involving one or two Uniswap V3 pools.Another interesting finding is that there are also many arbitrage opportunities in the Uniswap V3 liquidity pool alone. A single arbitrage transaction may also involve more than 100 venues ():
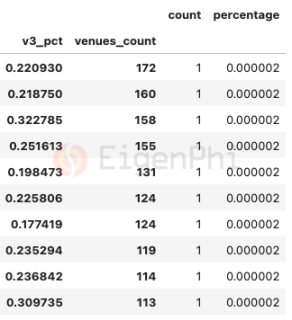
For example
Users themselves as arbitrage bots
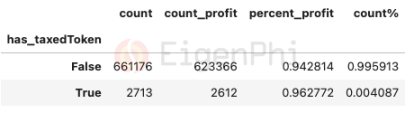
Arbitrage bots, also a type of transaction user of AMMs, are subject to taxed token contracts in addition to their heavy gas activity. The data and charts below show that while most profitable arbitrage transactions do not involve tax tokens, it is not excluded that some particularly good bots can find fortunes in tax tokens. There is a subtle trend that more profitable arbitrage bots may participate in a smaller percentage of taxed tokens.
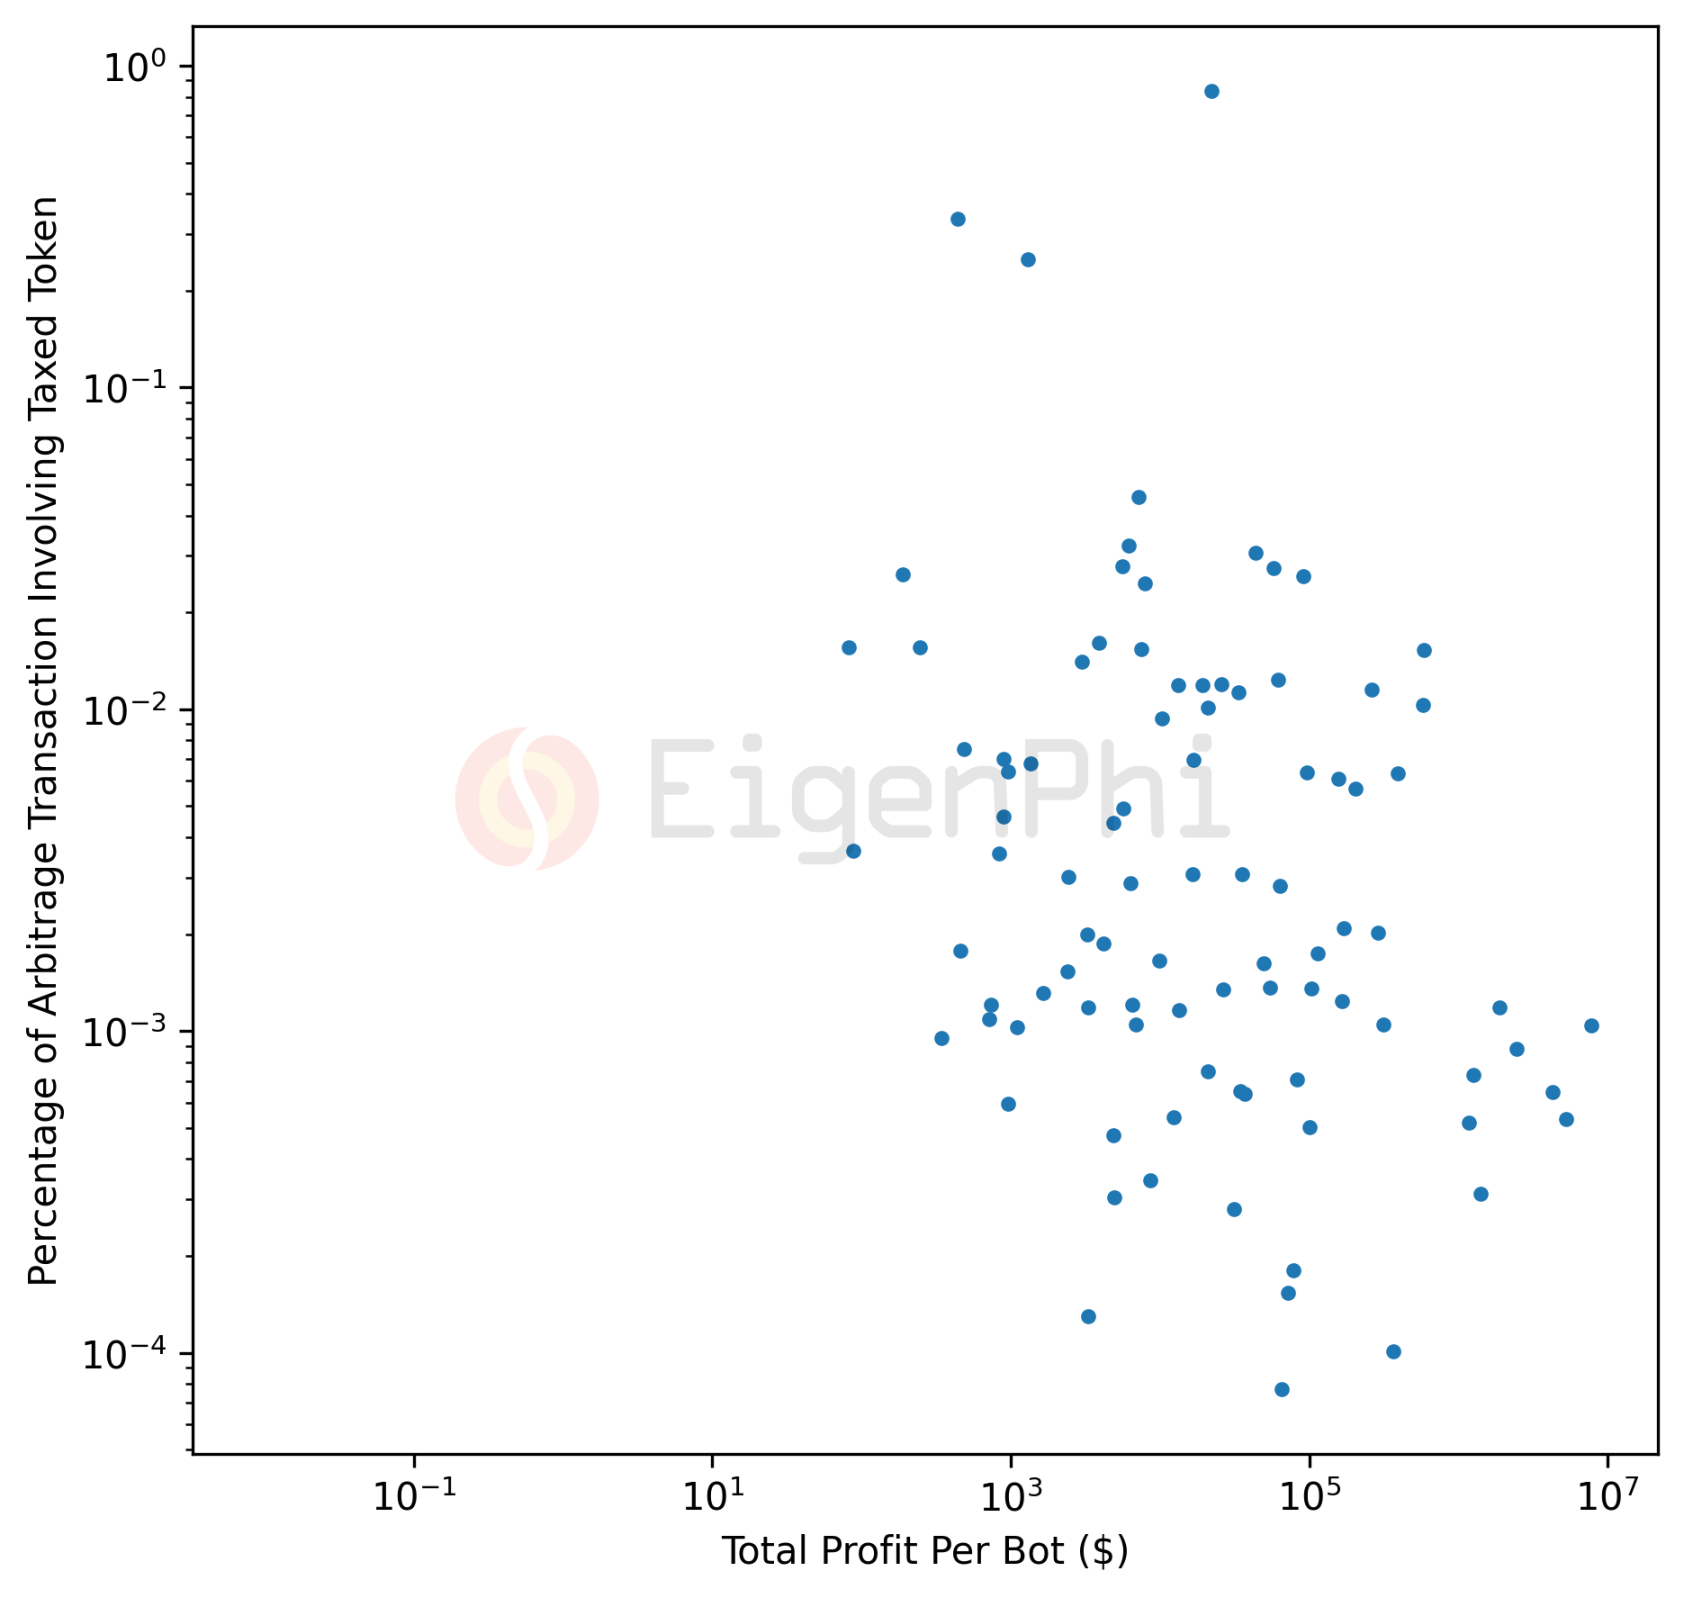
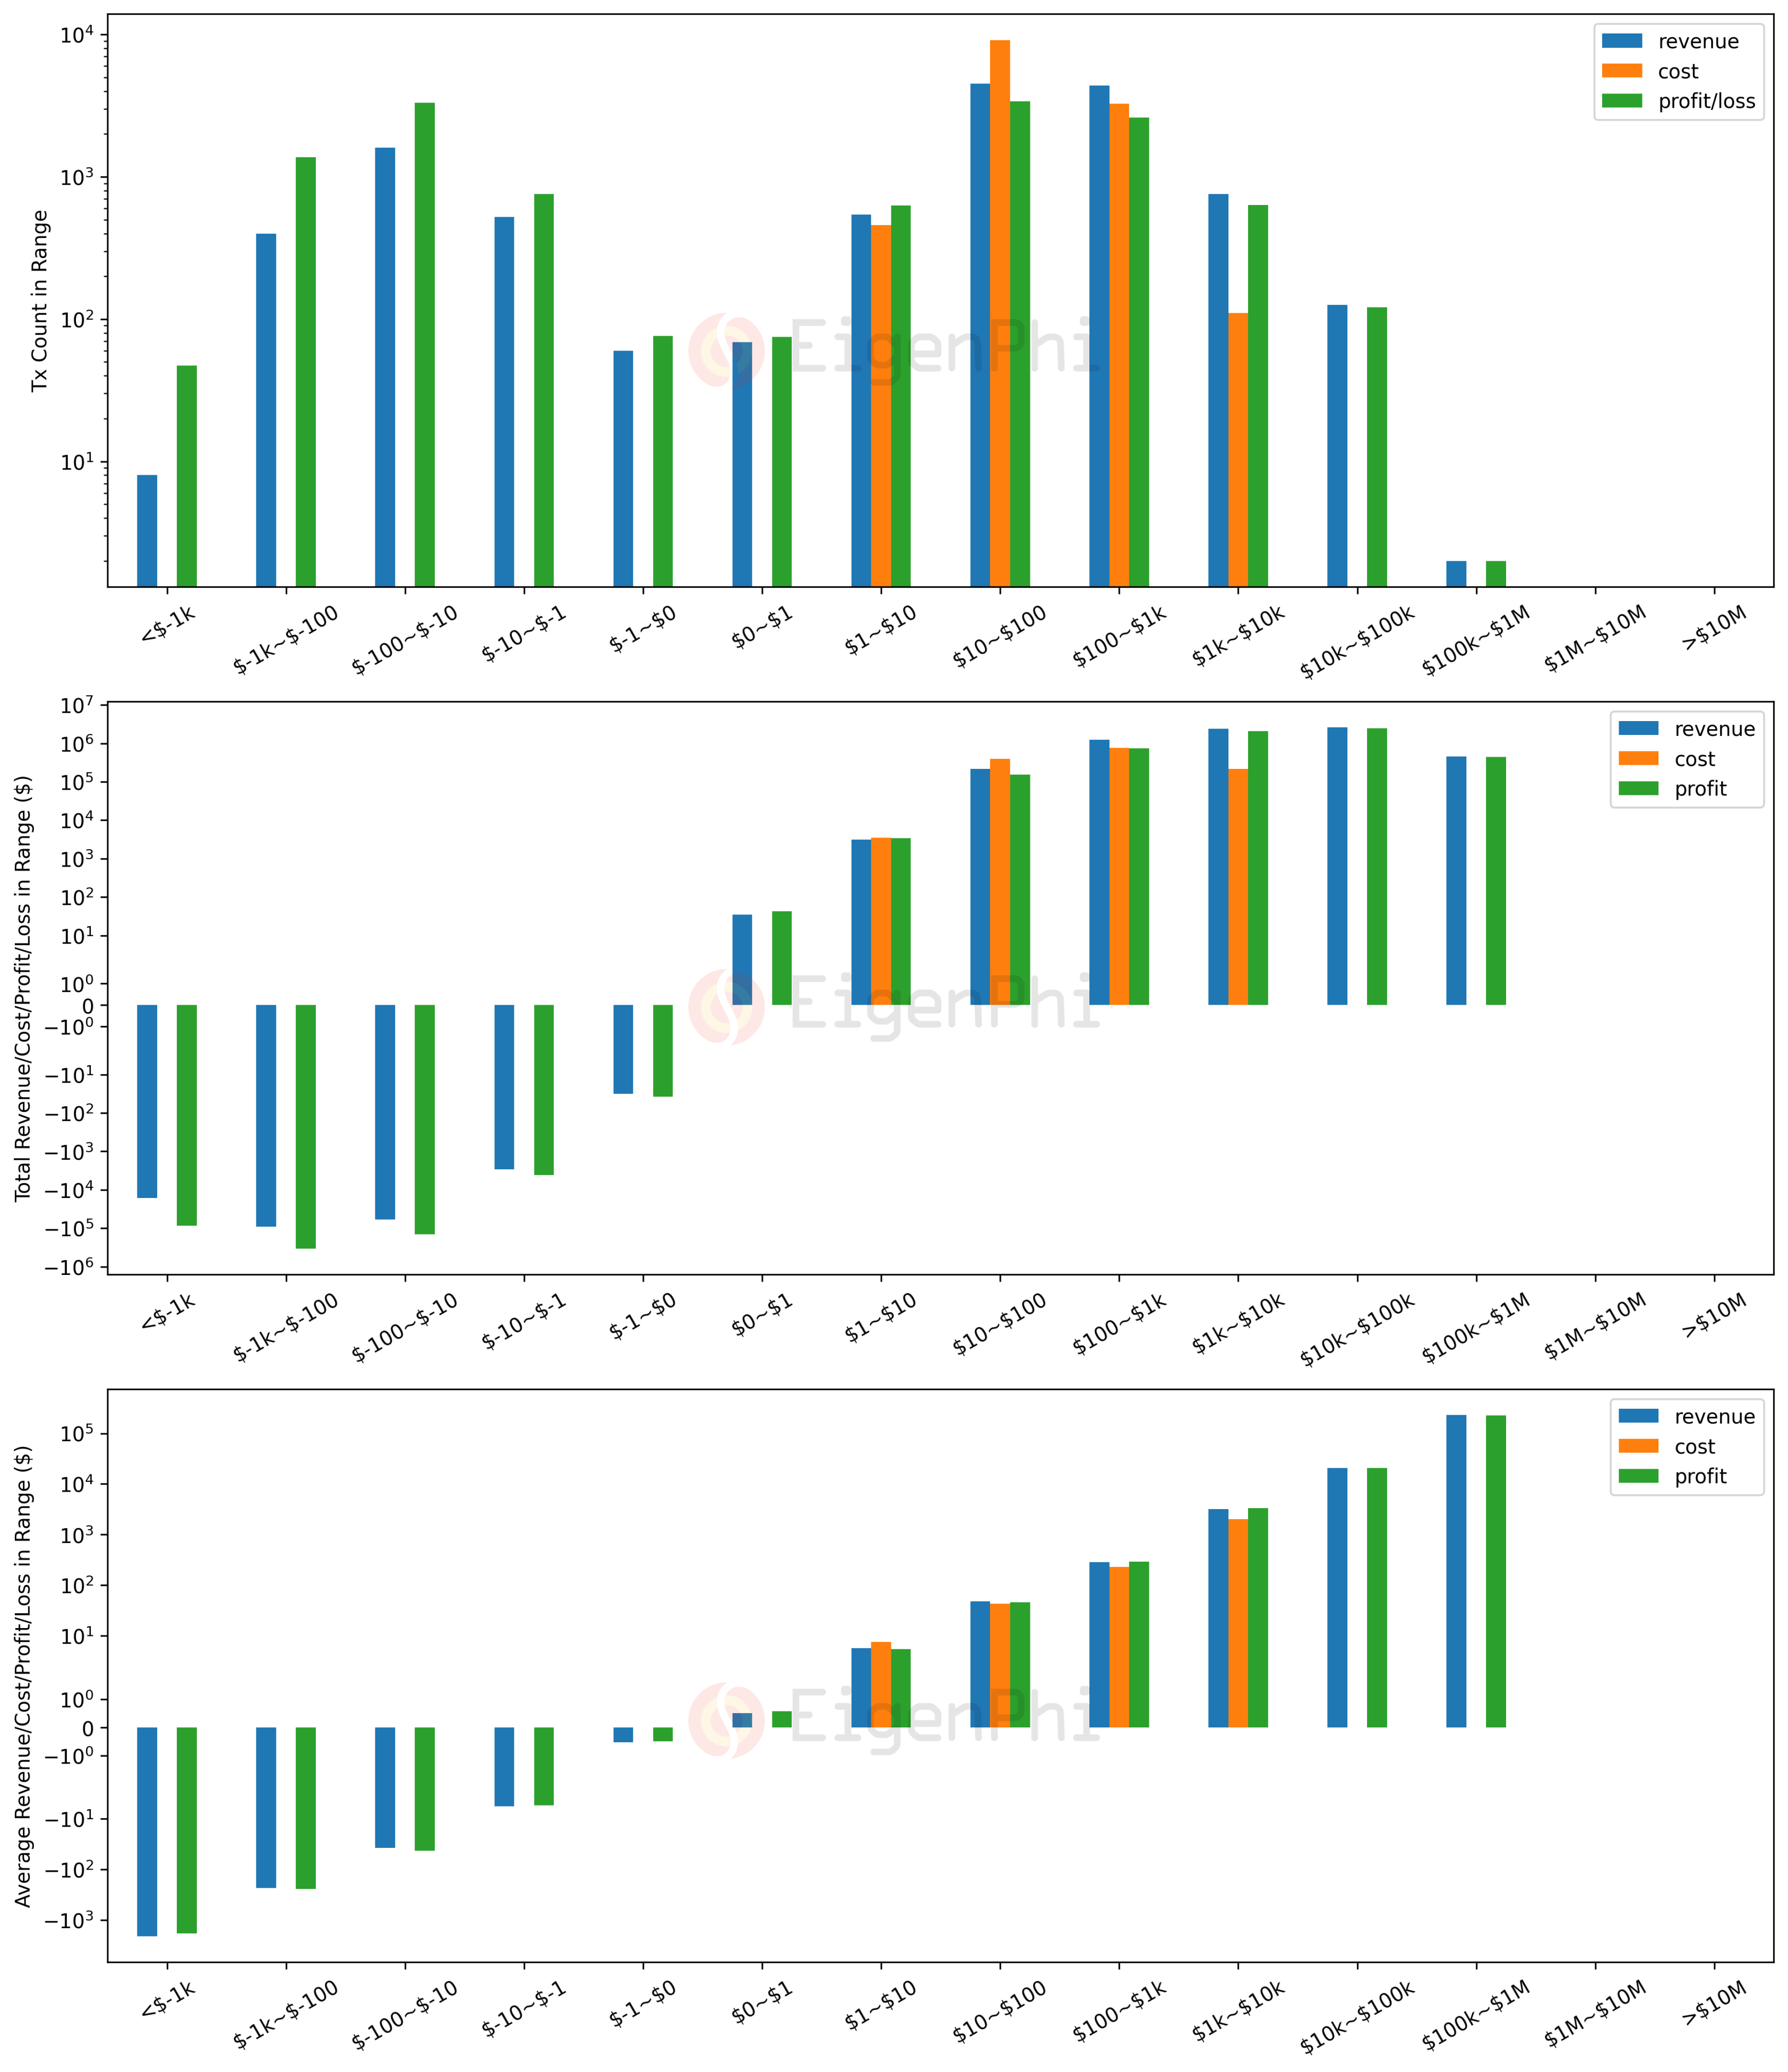
Segmentation of Profitability
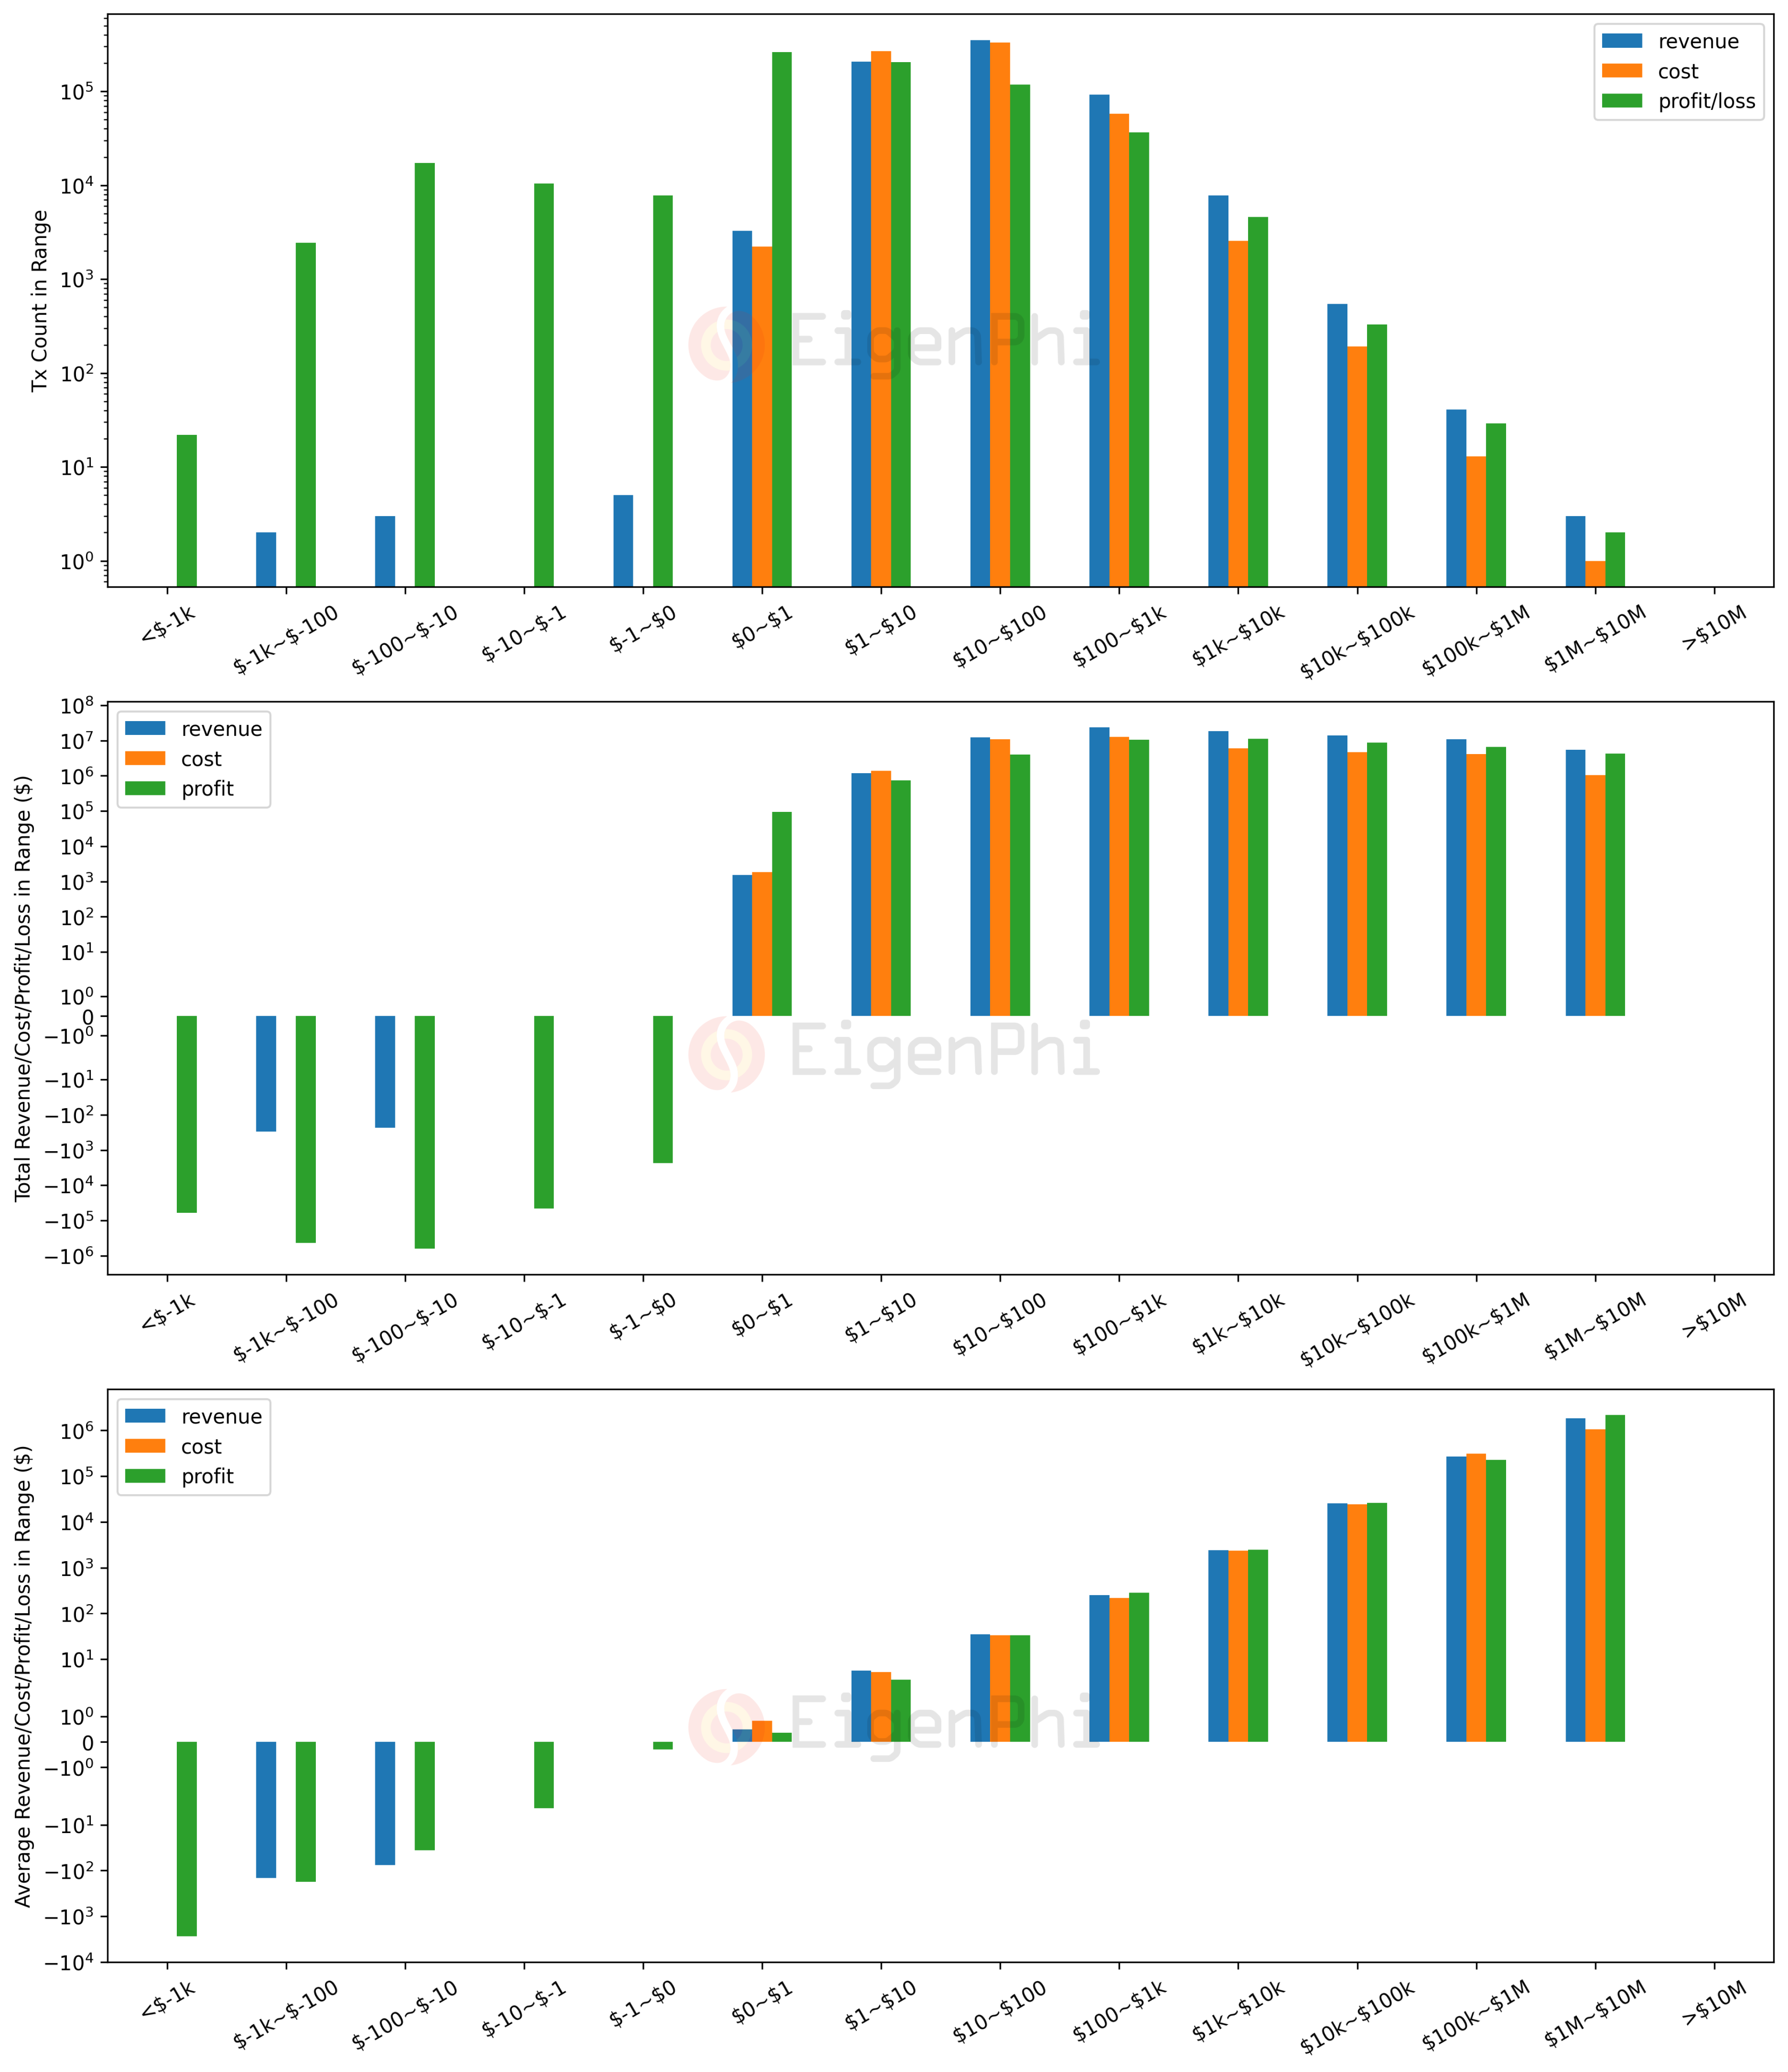
We also put the distribution of profitability parameters below for the reference of interested parties.
sandwich robot
Sandwich Bot Leaderboard (Top 20)
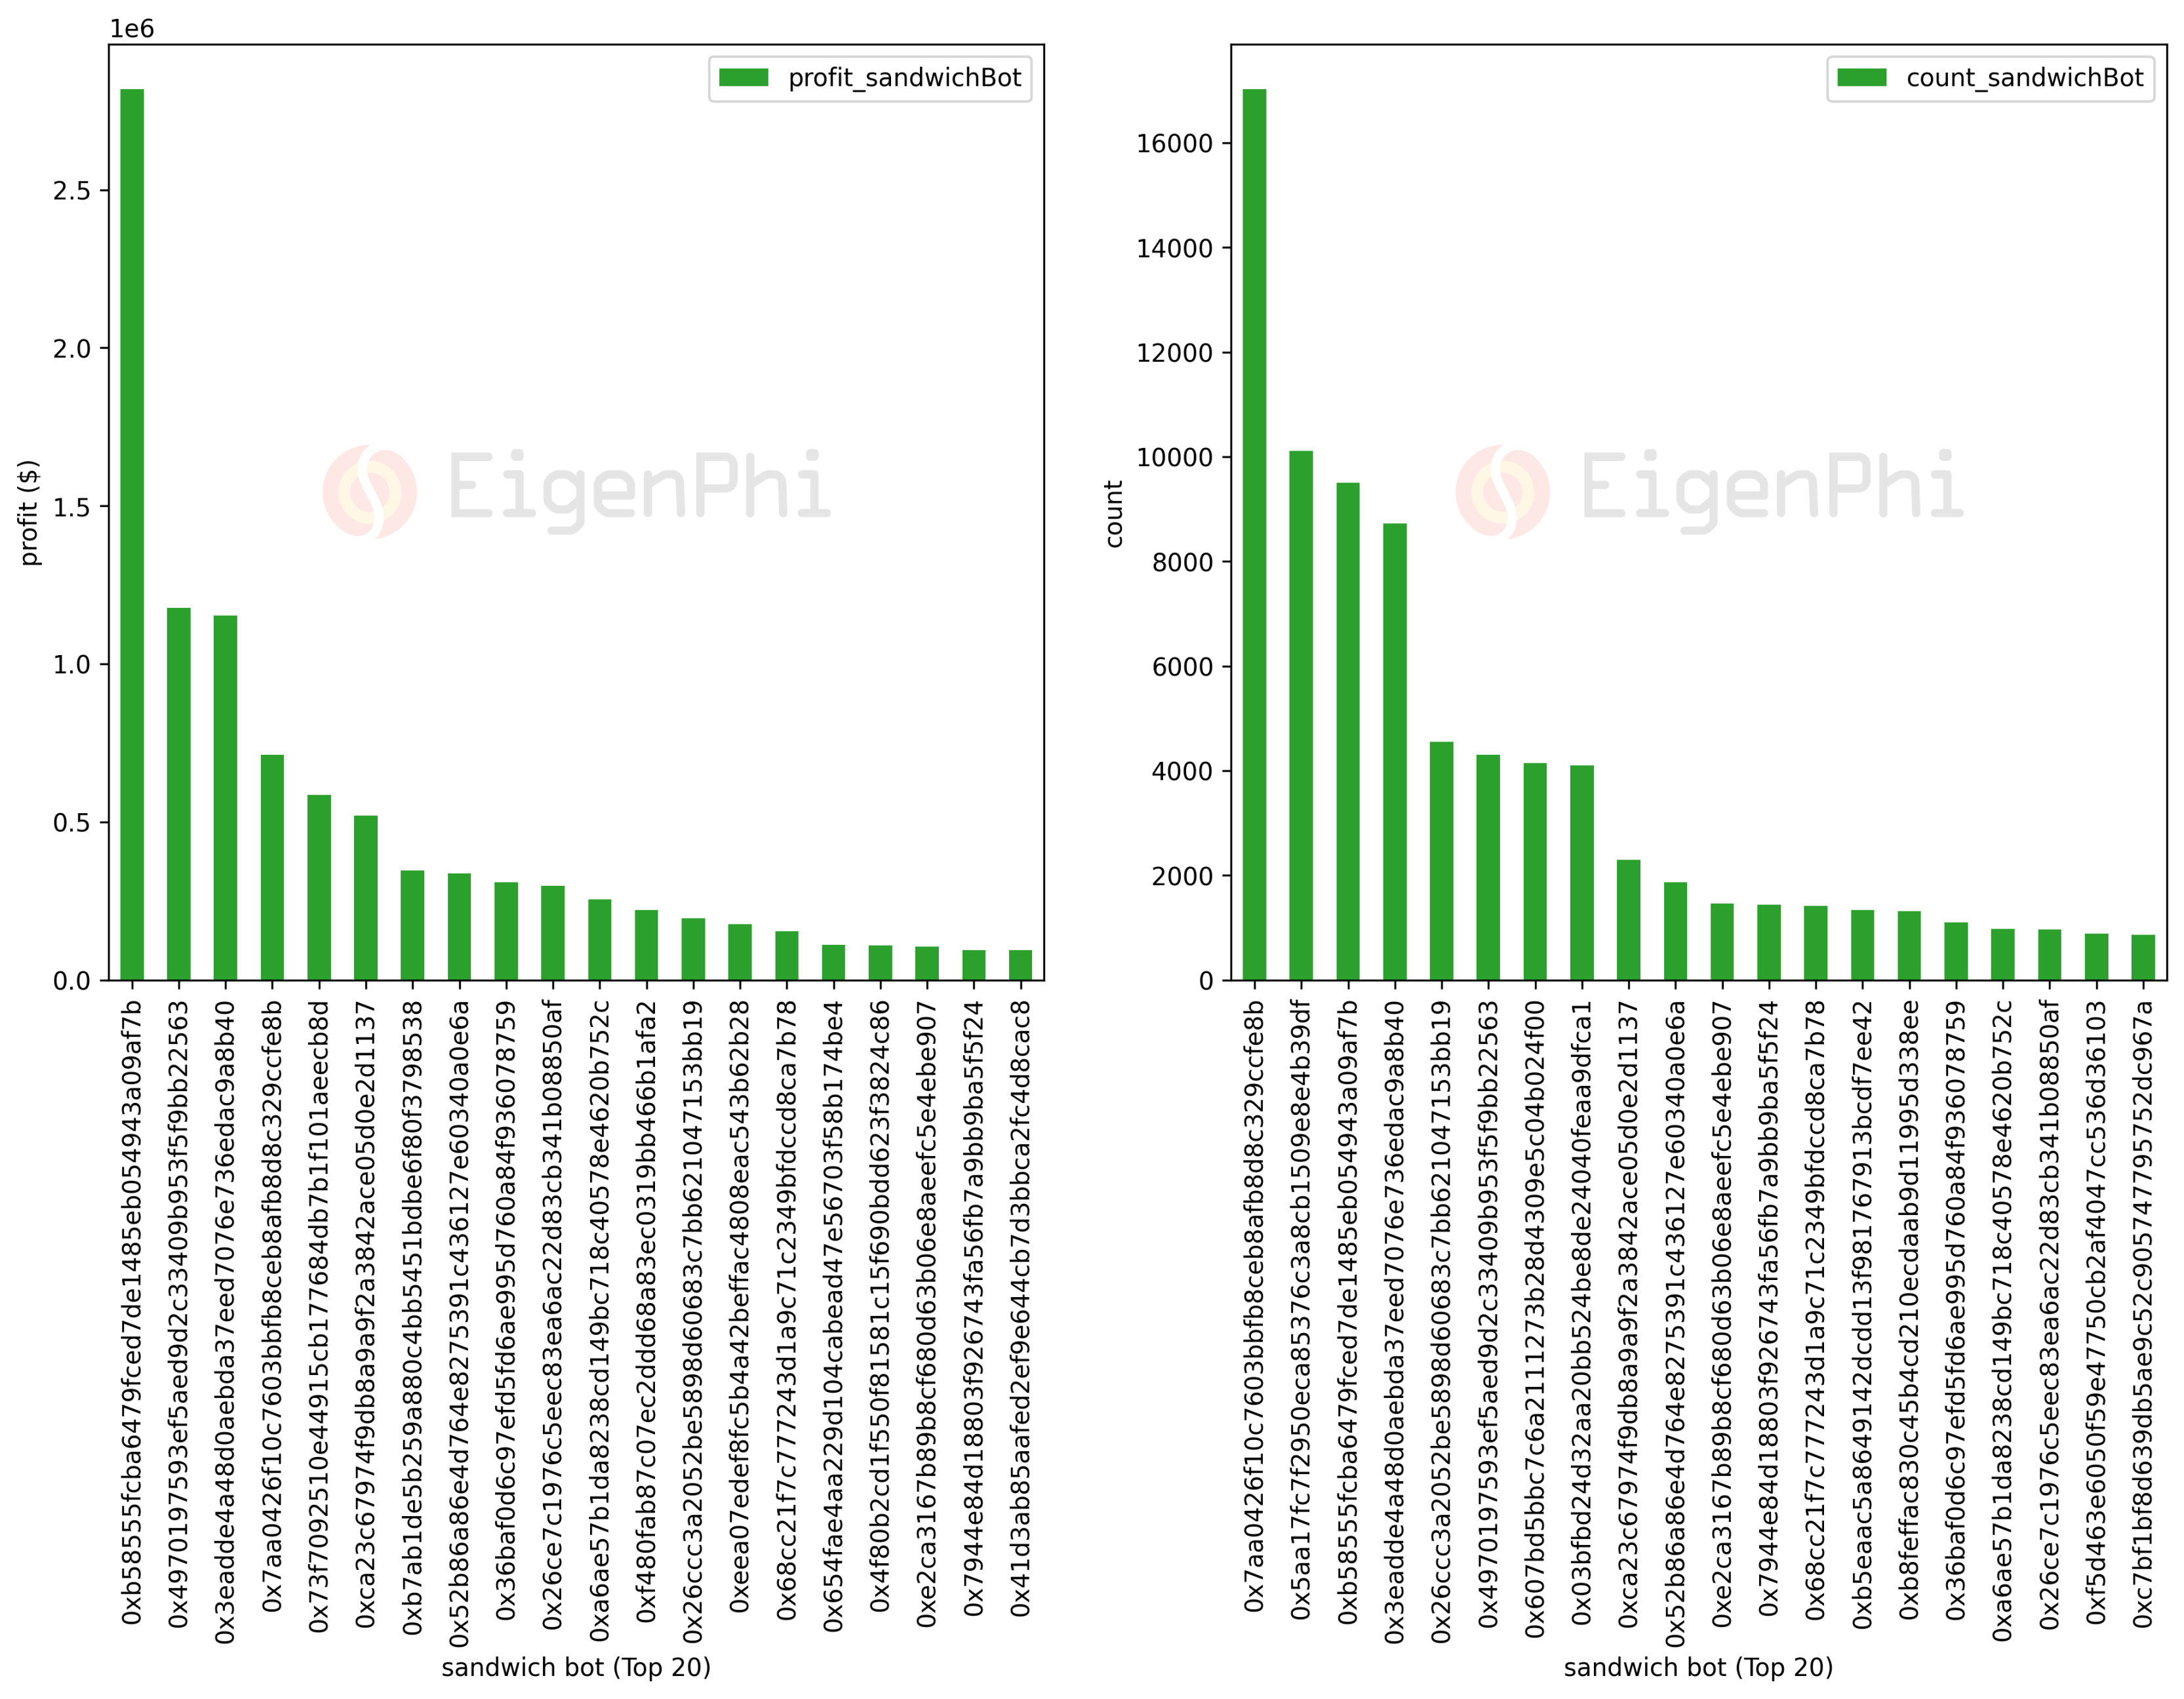
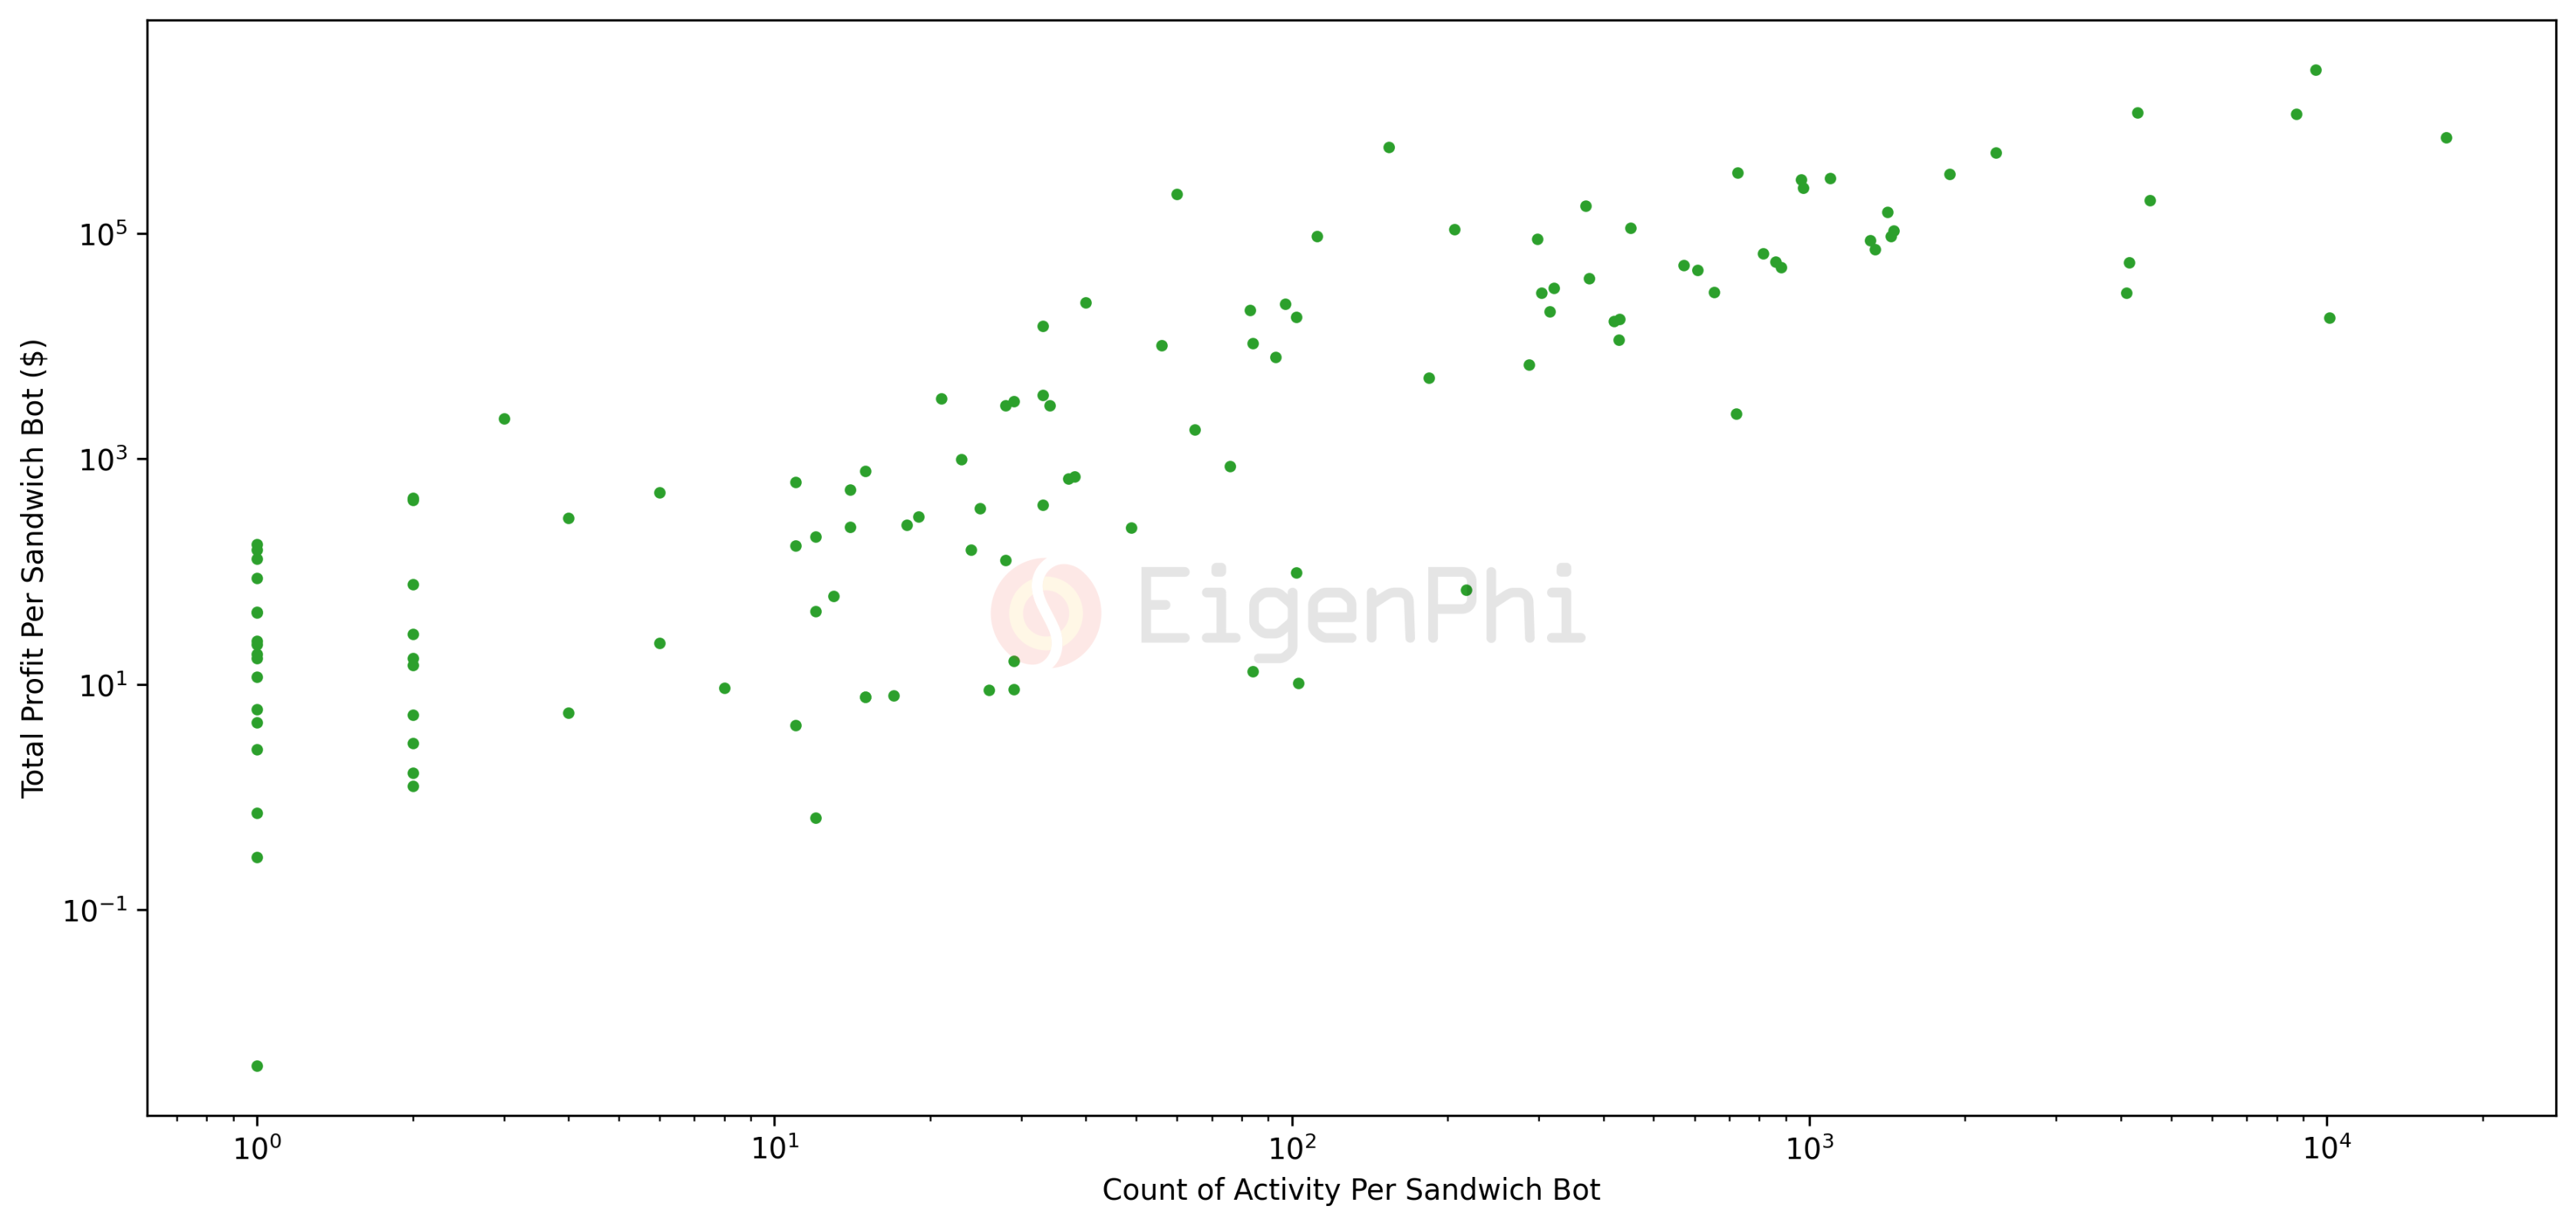
The following panels show the addresses of the top 20 sandwich contracts sorted by total profit or total activity frequency, respectively. The relationship between total profit and total activity count shows that most profitable bots are more capable of successfully submitting more than 100 trades this year.
Transaction users are caught in the middle
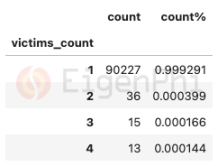
In most cases, only one transacting user is caught in a sandwich event. But sometimes, the sandwich bot can preemptively run exchange trades of up to 4 trading users at a time within our observation range.
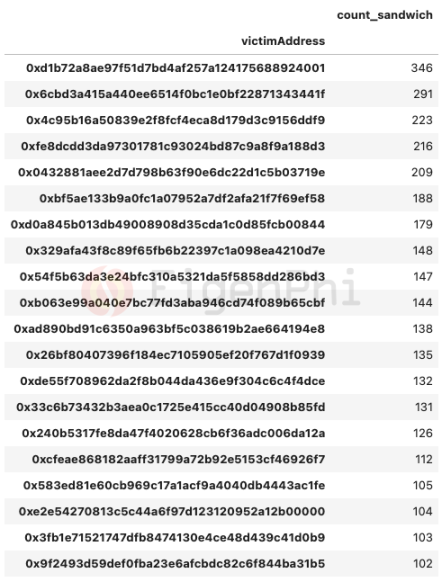
From the top 20 sandwich victims data below, the most distressed exchange users have been involved in more than 300 sandwich transactions this year.
from available in ourwebsitewebsite
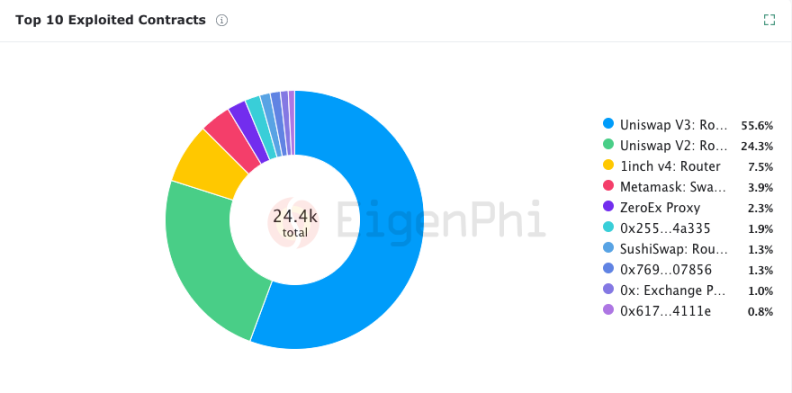
Looking at the top 10 exploited contracts in real time, we see that Uniswap liquidity pools are mostly engaged in sandwich activity compared to other venues. This is partly due to the huge transaction volume of these Uniswap pools, which is an advantage for sandwich bots.
Segmentation of Profitability
We also put the distribution of profitability parameters below for the reference of interested parties.
JIT robot
JIT Robot Leaderboard (Top 20)
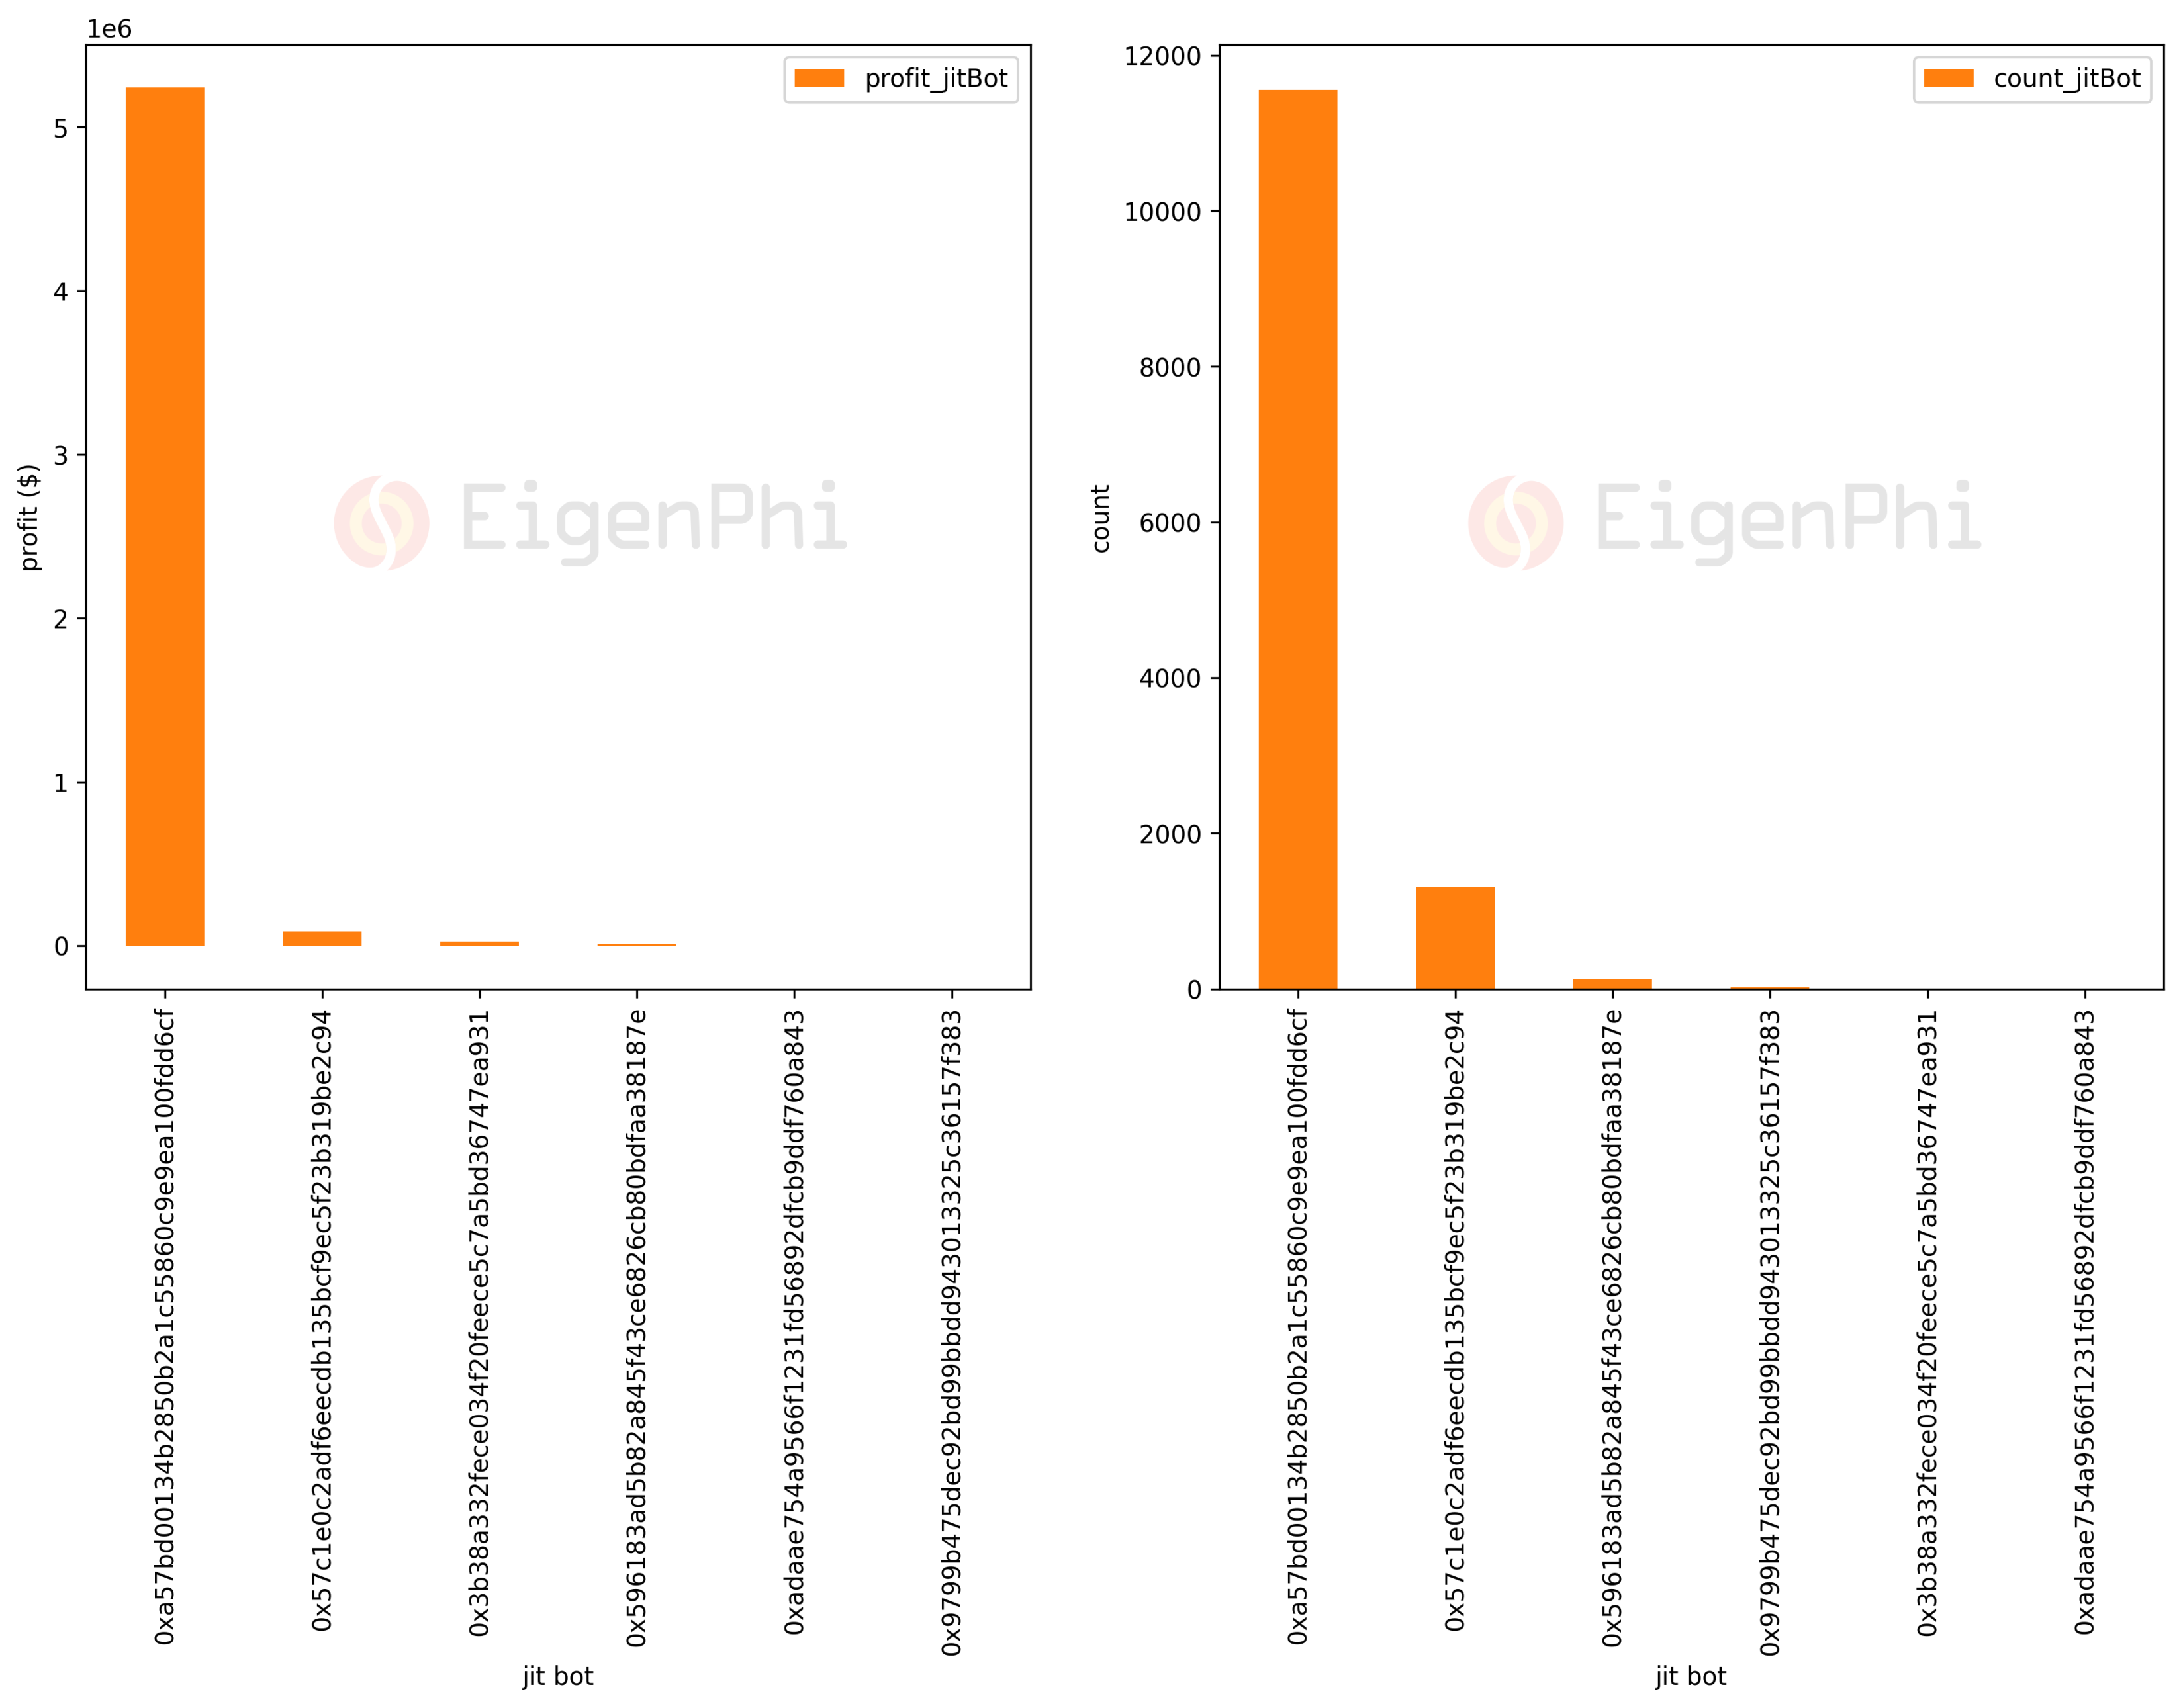
We only observed 6 JIT bots by detecting unique "addresses" in the trades in which the JIT bots added liquidity. Two of them are not yet profitable.
Transaction users benefit from JIT
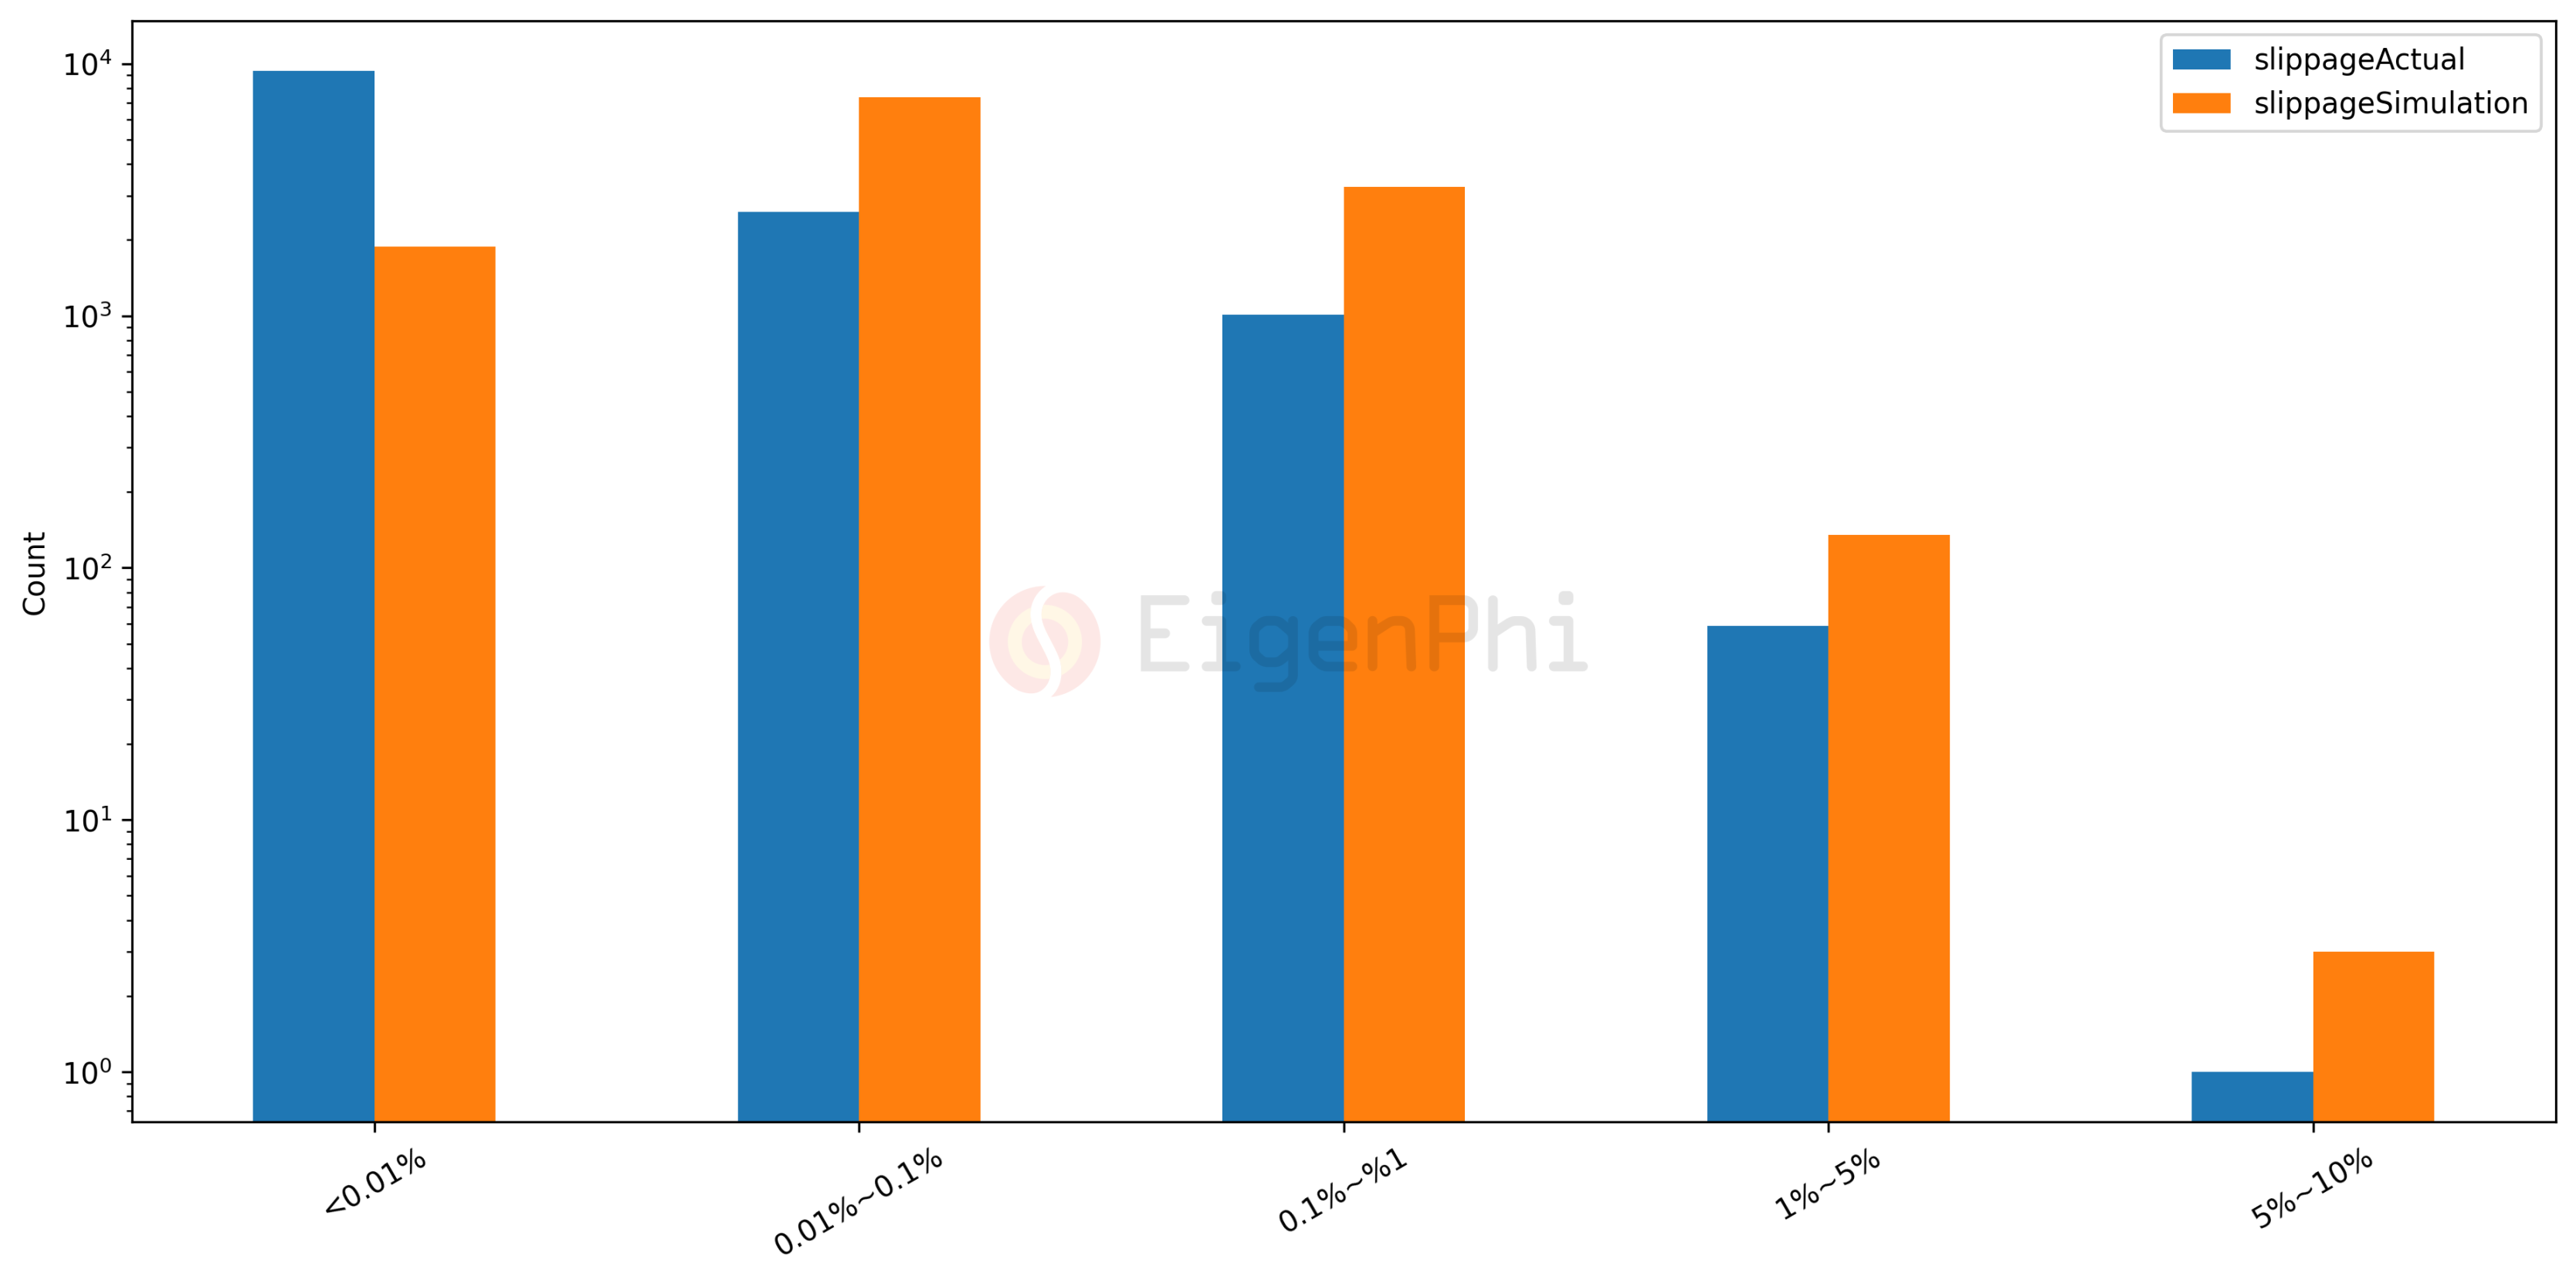
JIT robots can provide a large amount of liquidity for target trading users, giving them the advantage of smaller slippage losses. From the top 20 beneficiary data below, many transacting users are using this new feature frequently and enjoying its benefits. We calibrate returns by simulating at each observation the slippage a trading user might experience without JIT bot activity. As can be seen in the histograms of simulated slippage and actual slippage shown below, there is a clear shift from larger slippage rates to smaller slippage rates. During calculations, we also found negative slippage values in a few cases. Looking at the reasons manually, we found that in some JIT bot trades that add liquidity, for some reason, they do reverse swap trades, resulting in a better price for the next swap user.
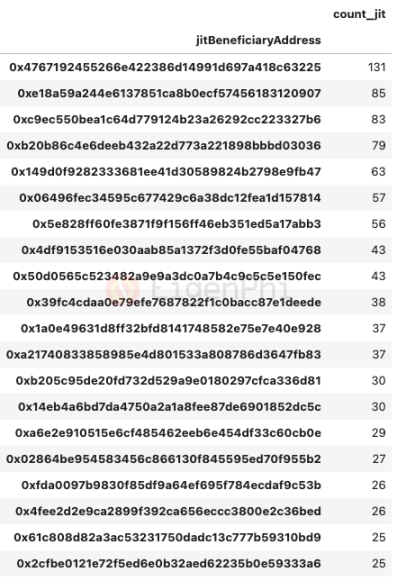
From the list of top 20 beneficiaries below, we see that quite a few swap users are already enjoying this new feature frequently.
We also put the distribution of profitability parameters below for the reference of interested parties.
in conclusion
in conclusion
From the above analysis, it can be seen that robots have become an important part of the AMM community that cannot be ignored. Understanding the transactional relationships between MEV robots and other entities can help stakeholders better understand the long-term impact of MEV on AMM.
In this report, we describe the above relationship from different perspectives, and draw some interesting conclusions based on reliable data sources and data analysis:
Income – Looking at the scale of income extracted by bots, we see arbitrage bots extracting at least $85M from market price asymmetries involving Uniswap V3 liquidity pools. Sandwich Bots took at least $47 million from swap users in the form of slippage losses. JIT bots pulled $6M from Uniswap V3 swap fee revenue. Total revenue from robots accounts for 25% of LP revenue. However, there is no apparent conflict of interest between Arbitrage Bot, Sandwich Bot, and LP. Their income has been more likely to follow market fluctuations in recent months. The monthly income of JIT bots is an order of magnitude smaller than that of the other two types, and has not yet shown a clear trend.
Frequency - Arbitrage bots are more likely to find trading opportunities than other bots. Arbitrage bot activity has increased significantly since May of this year, while sandwich bot observation frequency has remained stable. Trading opportunities are positively correlated with the strength of market price fluctuations. Trading opportunities for JIT bots have been on the rise in recent months.
Profitability - MEV robots make average profits most days and have a few lucky days where they make a lot of money. The profit and loss of a single observation conform to the fat-tailed distribution. The maximum profit a sandwich bot can make is an order of magnitude smaller than that of an arbitrage bot, due to fewer trading opportunities, higher costs, and greater competition among bots. JIT robots are still in their early stages.
Cost - The average transaction cost for bots has been trending down in recent months. The cost of sandwich robots is higher than that of arbitrage robots, and the proportion of revenue allocated to miners has increased significantly, approaching 90% in October, while arbitrage robots have fallen below 30%. Overall, more than half of the extracted value went into the pockets of miners.
Pools - More than 80% of Sandwich Robot's profits come from the top 10 pools by volume. However, only 20% of sandwich activity takes place in these pools. Some pools were also not involved in sandwich activity during the time frame we observed. JIT bots seem to focus more on the top 10 pools by volume, where 84% of profits come from and 56% of JIT activity occurs here. Liquidity pools with fee levels equal to 0.0005 or 0.0001 are more likely to be drawn by arbitrage bots. Liquidity pools with a fee level of 0.0005 are mainly affected by sandwich activity and JIT activity. The fat-tailed distribution of the parameters grouped by pool also shows that the participation of a minority of pools is much higher than the average.
Participants - Unique exchange users who can benefit from JIT activities seem to be increasing. Slippage data from real swaps and simulations also validates this. There are other agreements that also provide strategic liquidity, offering bots to LPs looking for more yield. Their strategy is mainly to allocate liquidity within a narrow range, and adjust the scale interval according to quantitative indicators such as Bollinger Bands to track market prices. Compared to these strategies, JIT robots are trying to solve the same problem in an innovative and more capital efficient way. It is worth considering that relevant parties such as AMM protocol designers directly provide similar functions, which can connect swap users and LPs in a new way while improving user experience and increasing LP revenue.
Bots - We also list the top 20 bot contract addresses sorted by total profit and activity count separately. The relationship between total profit and total activity count is positively related to the upper limit of profit that the robot can extract the most. Regarding how arbitrage bots handle taxed tokens, most profitable arbitrage transactions do not involve taxed tokens. But it is not ruled out that there are some particularly good robots who can find wealth in tax tokens. In most cases, only one exchange user is caught in a sandwich event. But in some cases, Sandwich Bot can run exchange transactions of up to 4 exchange users at a time within our observation range. This year's most painful swap users participated in more than 300 sandwich trades.
Trading Patterns - Looking at the structure of arbitrage transactions, we found that spatial arbitrage involving one Uniswap V3 pool and another venue was the most common pattern. The following two common patterns are triangular arbitrage involving one or two Uniswap V3 liquidity pools. There are also many arbitrage opportunities in the Uniswap V3 liquidity pool alone. And a single arbitrage transaction involving more than 100 venues can also be profitable.
method
data source
The above analysis is based on raw block data obtained from the full Ethereum node we built. The data range covered is from block numbers 13916166 (inclusive) to 15871479 (inclusive). We decode the raw data to get the fine-grained data fields we need.
In order to compare certain parameters with the overall market situation and the macro parameters of Uniswap V3, we employed the following third-party data:History of ETH from coinmarketcap。
Closing priceDaily metadata for Uniswap V3 from dune@messari/Messari:。
Uniswap Macro Financial Statementshttps://www.uniswap.shippooor.xyz/The metadata for Uniswap V3 comes from
. (Chain: Ethereum, Dataset: Liquidity Pool)
How do we identify bots?
We view transactions as collections of asset transfers, and we use a set of rules to see if MEV activity has occurred by evaluating the outcomes of these transfers. The rule of thumb is that there is more than one transfer (or swap) in a trade and the trader will end up with a surplus.
To identify different types of MEV activity, we collect observations that obey our heuristic rules in the current phase, and we continue by comparing the sample results with those of MEV-inspect on a daily basis based on detected false negatives or false positives. enhance our algorithm.
In this report, we identify three types of MEV activity involving Uniswap V3 pools. The total number of Uniswap V3 liquidity pool addresses we cover is 8837, including addresses from failed factory transactions, compared to 8767 liquidity pools listed in third-party data sources. The total number of arbitrage, sandwich, and JIT observations is 663889, 90291, and 13020, respectively.
How do we calculate profit and cost?
Original link


