The development status of the digital cross-chain bridge: cross-chain assets are still dominated by stablecoins, and the number of NFT cross-chains has increased by 6540%
On November 4, the multi-chain routing protocol pNetwork re-deployed the pGALA contract on the BNB Chain due to a misconfiguration of the cross-chain bridge. A security incident occurred during the operation. The security agency later analyzed that the reason was that the plaintext of the private key was leaked on GitHub. This is just the tip of the iceberg of cross-chain bridge security incidents. According to the cross-chain bridge attack report released earlier by Chainalysis, as of early August, after the Nomad Bridge was hacked, $2 billion in cryptocurrencies had been traded on 13 different cross-chain bridges. stolen in hacking attacks, most of which were stolen this year. In addition, the amount stolen from cross-chain bridges this year has already accounted for about 69% of the total amount stolen in 2022.
The frequent occurrence of cross-chain bridge security incidents actually reflects the rapid development of cross-chain bridges from the side. When there are more funds on the cross-chain bridge, hackers will gain more profits from attacks and the possibility of attacks will be higher. In fact, since the second quarter of last year, the cross-chain bridge has attracted the attention of the market, because its emergence and development have adapted to the inevitable needs of the development of upper-level ecological multi-chains such as DeFi. So today, what new changes have occurred in the development of cross-chain bridges? What are the current capital scale and user scale of each cross-chain bridge? After analyzing the chain data of multiple cross-chain bridges, PAData found that:
1) In the second half of the year, the average daily number of transactions on the cross-chain bridge on Ethereum has risen steadily to 1.27%, which is comparable to that at the beginning of the year. At the same time, its importance in the Ethereum network is gradually increasing.
2) The cumulative loss caused by 15 attacks this year is at least about 1.898 billion US dollars, mainly due to contract loopholes.
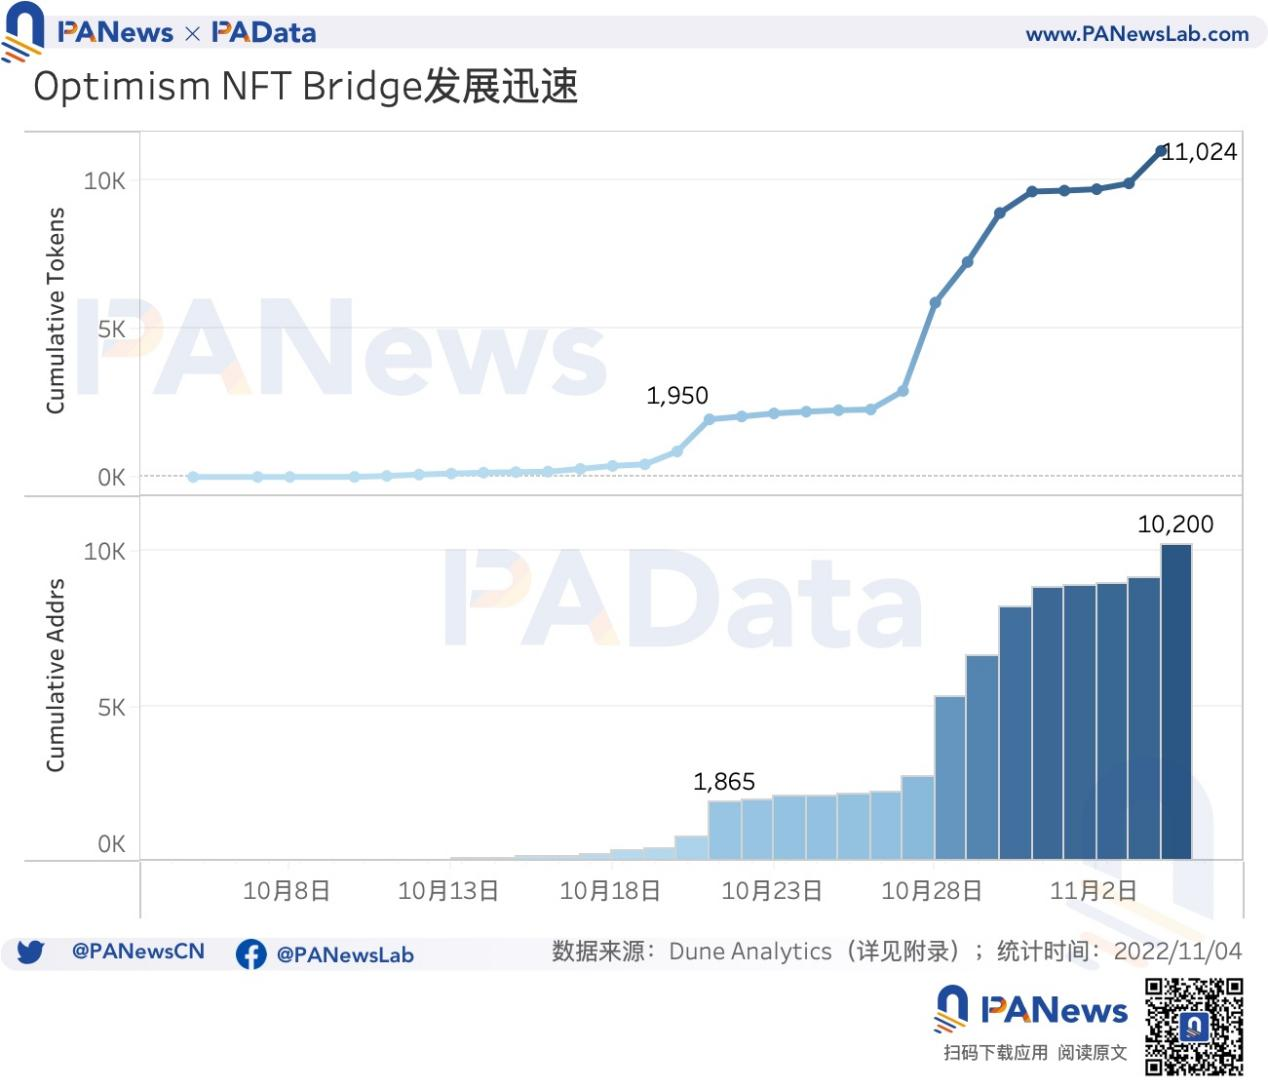
3) Multichain, cBridge, Chainswap, Harmony, EVODeFi, Optimism and many other bridges have already provided NFT cross-chain functions. Among them, OptimismNFT Bridge has currently bridged more than 11,000 NFTs, an increase of about 6540% in the last month.
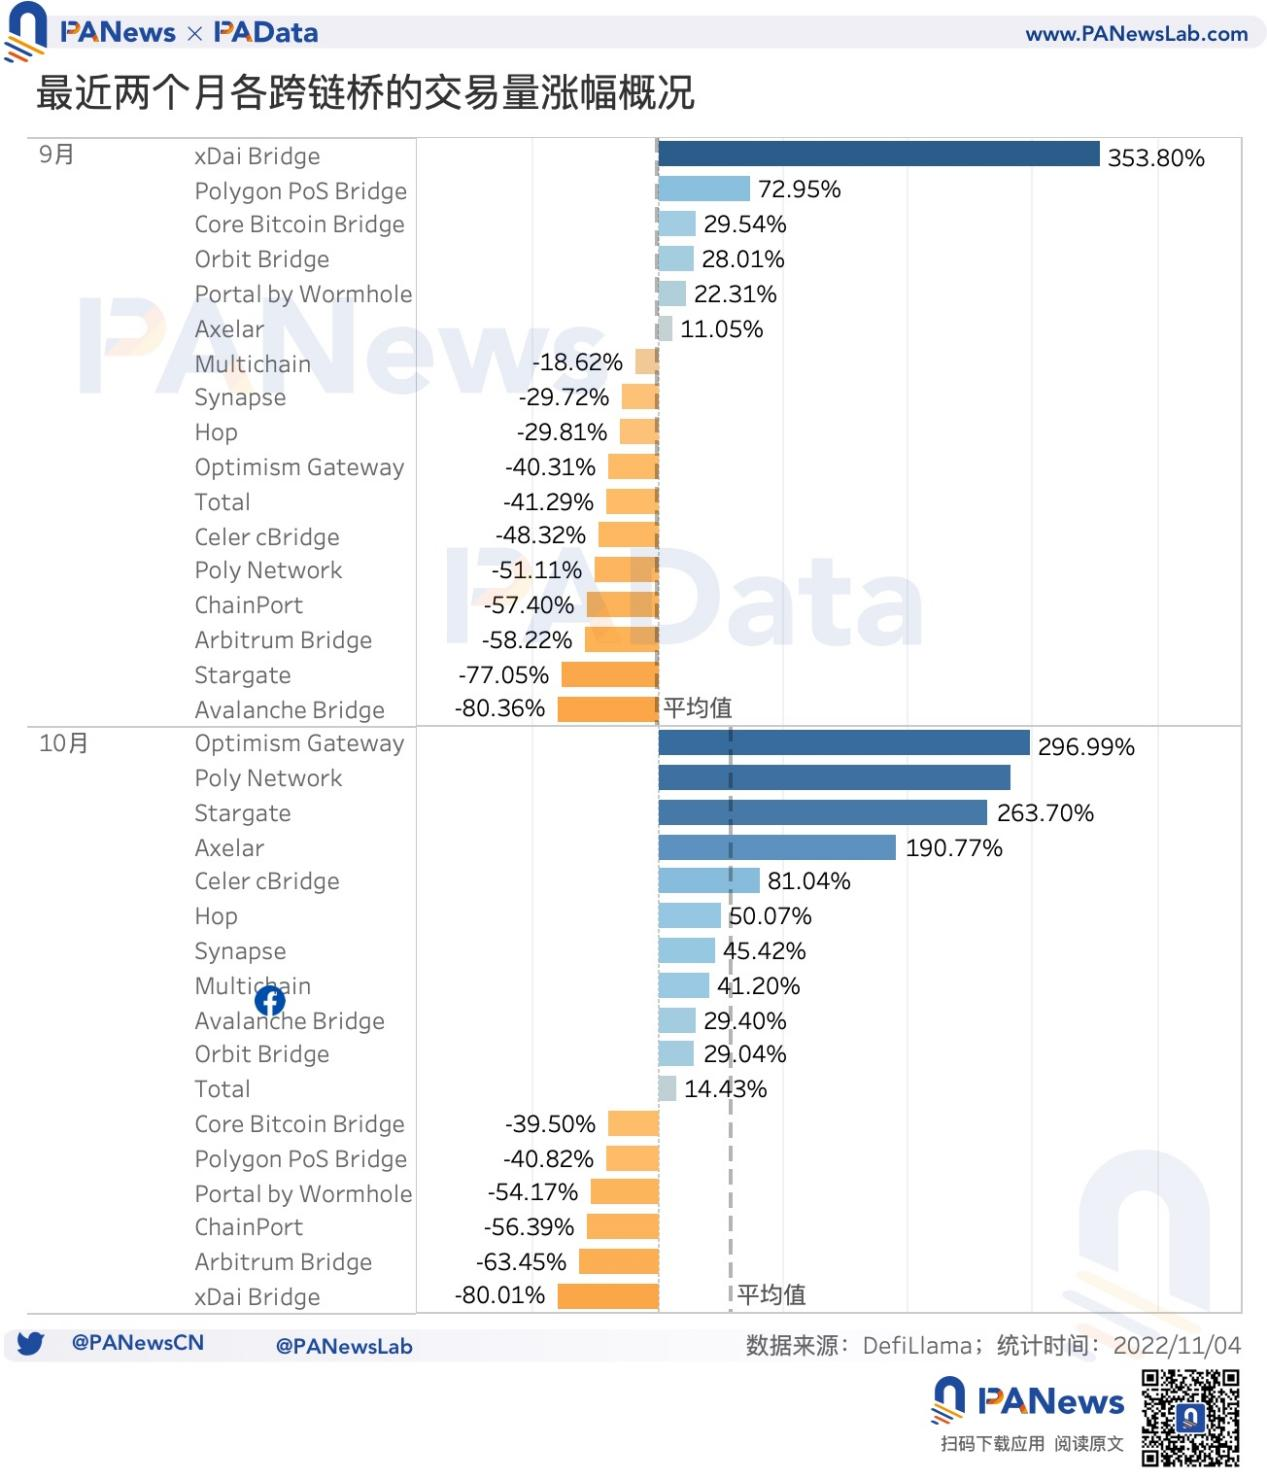
4) The transaction volume of cross-chain bridges increased by 14.43%. PolygonPoS Bridge, Multichain, Stargate, AvalancheBridge, OptimismGateway and ArbitrumBridge have an average daily transaction volume of more than 10 million US dollars.
5) In the second half of the year, the total lock-up amount of the seven cross-chain bridges increased by an average of 2.44%, among which Axelar and Stargate (Ethereum) increased the most, reaching 57.66% and 30.73% respectively. In addition, Wormhole (Ethereum) has also increased by nearly 10%.
6) The cumulative addresses of the four cross-chain bridges increased by an average of 64.77% in the second half of the year, among which the cumulative addresses of Arbitrum and Optimism increased by about 90% in the second half of the year.
first level title
In January and October, the number of transactions on the Ethereum side of the cross-chain bridge exceeded 350,000, and the number of NFT cross-chains increased by 6540%
This year, with multiple Ethereum Layer 2 public chains issuing governance tokens and starting ecological construction, cross-chain bridge activities on Ethereum have been widely activated. pick up.
According to statistics from glassnode, in October, the highest daily average ratio of cross-chain bridge transactions to the total number of Ethereum transactions reached 2.31%, which is second only to the highest single-day ratio of 4.17% created during the Arbitrum Odyssey event in June this year. In addition, judging from the daily average proportion of cross-chain bridge transactions, it has steadily risen from 0.72% to 1.27% from July to November, and the recent proportion of cross-chain bridge transactions has been comparable to that at the beginning of the year.

In terms of the absolute value of the number of transactions, the total number of cross-chain bridge transactions in October was approximately 355,100, a 32.85% increase from July, but still lower than any month in the first half of the year.
Comparing the two, it is not difficult to find that the activity of the cross-chain bridge has not only increased in the second half of the year, but also its importance in the Ethereum network has gradually increased compared to other transaction activities. This is even more evident from the percentage change. First of all, from a static point of view, the number of transactions corresponding to the proportion of 1% of cross-chain bridge transactions has decreased, that is, compared with the beginning of the year, fewer transactions can now achieve a similar proportion of transactions . In January of this year, 368,500 cross-chain bridge transactions corresponded to 1% of the average daily transactions in Ethereum, and by October, 335,800 transactions could correspond to the same ratio.
Secondly, from a dynamic point of view, for every 1% change in the number of cross-chain bridge transactions month-on-month, the average daily proportion of the number of transactions changes more month-on-month. The month-on-month change can leverage a higher proportion month-on-month change. In February this year, a month-on-month change of 1% in the number of transactions only corresponded to a month-on-month change in the average daily proportion of transactions of 0.5%. By October, this corresponding ratio increased to 1.01%. The corresponding ratio once exceeded 3%.

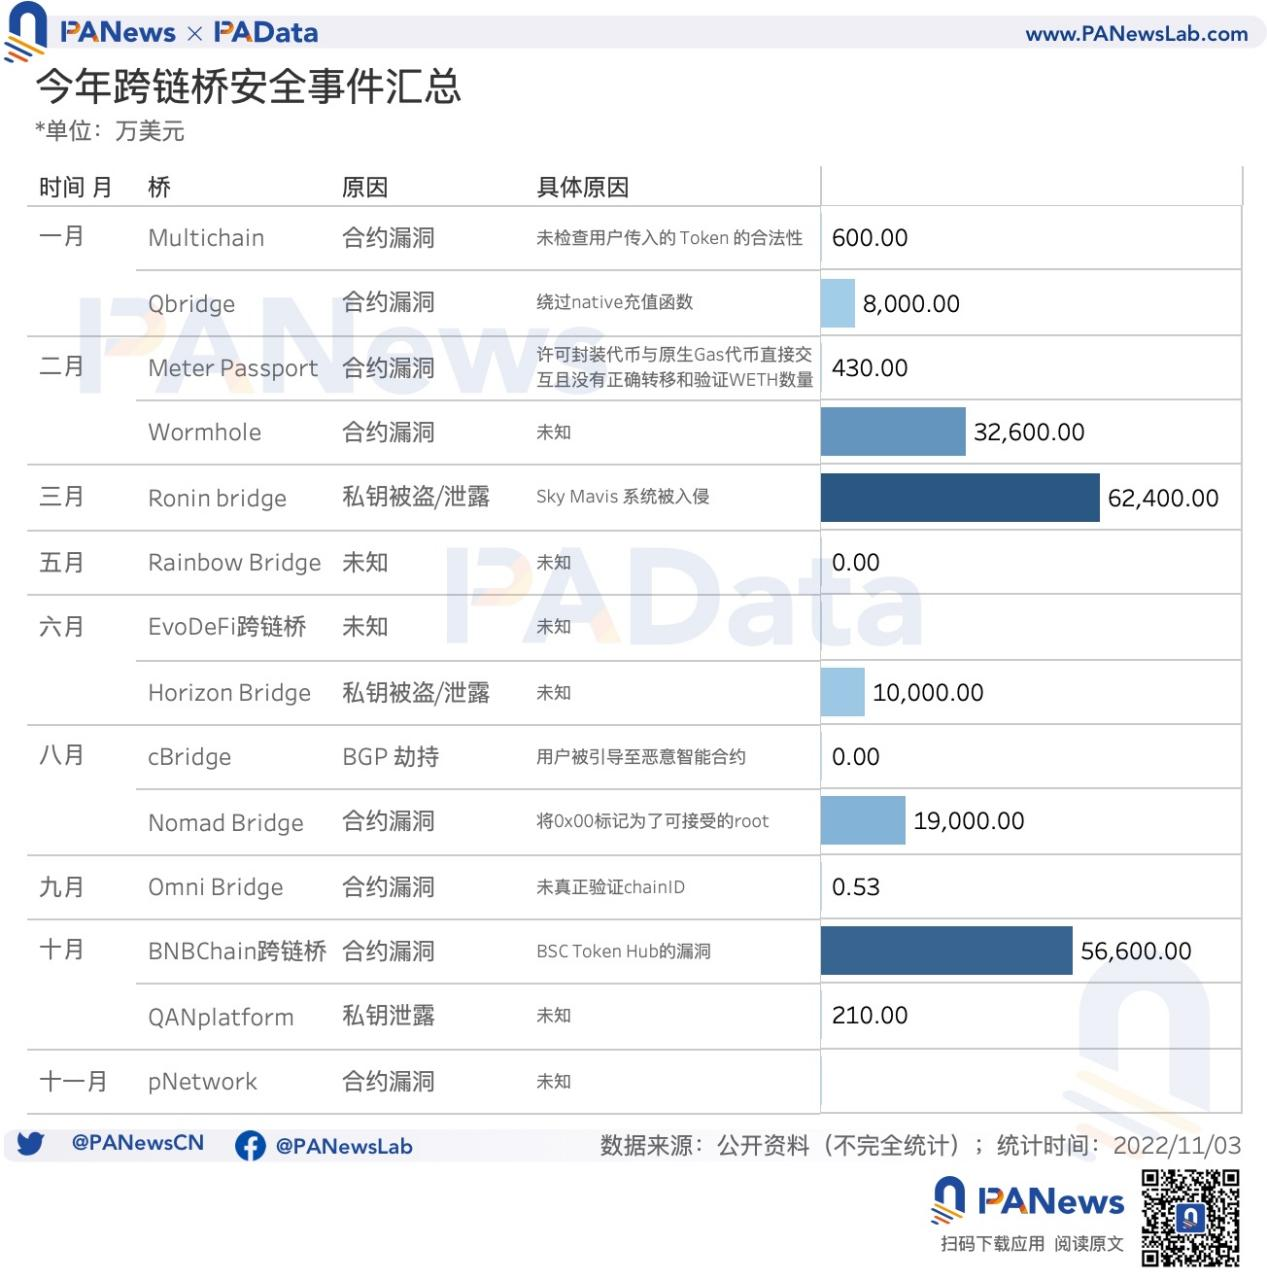
This year, the attacks on cross-chain bridges and the amount of losses caused by them are also eye-catching. According to the official Twitter of the project and information from security agencies such as SlowMist, PeckShield, Chainalysis, Numen Cyber, BlockSec, Beosin, Fairyproof, etc., there have been 15 cross-chain bridge-related attacks this year, involving 14 cross-chain bridges, of which Omni Bridge caused 2 cases because the contract did not actually verify the chainID when crossing the chain.
The cumulative losses caused by these attacks are about $1.898 billion. Among them, Rainbow Bridge and cBridge have no financial losses, and the losses of EvoDeFi cross-chain bridge and pNetwork are unknown. In addition, the highest losses are Ronin bridge, BNBChain cross-chain bridge and Wormhole, which are as high as approximately US$624 million, US$566 million and $326 million.
From the perspective of the reasons, according to public information, most of the cross-chain bridge attacks are caused by contract loopholes, and some are caused by the theft/disclosure of private keys. Overall, the security of cross-chain bridges still needs to be improved.
The third new change in the development of cross-chain bridges this year is the emergence of NFT cross-chain bridges, which also meets the needs of NFT development. According to public information, at present, Multichain, cBridge, Chainswap, Harmony, EVODeFi, Optimism and many other bridges have provided NFT cross-chain functions. Taking OptimismNFT Bridge as an example, it can be seen that the number of NFTs that have been bridged has exceeded 11,000, and the increase in the last month is about 6540%. The cumulative number of user addresses has reached 10,200, and the increase in the last month has reached 105,025%. It can be expected that the emergence of NFT cross-chain bridges will have positive significance for expanding NFT multi-chain circulation.
02. In the second half of the year, the locked positions of Axelar and Stargate increased by more than 30%, and the deposit addresses of the four major cross-chain bridges of Ethereum increased by an average of 222%
What is the current development status of the cross-chain bridge? PAData conducts horizontal comparisons from three aspects: daily transaction volume, total locked positions or total ETH deposits, and number of addresses or deposit addresses.
The daily transaction volume of the cross-chain bridge refers to the total amount of daily deposits and redemptions, that is, the daily transaction flow. According to DefiLlama's statistics, PolygonPoS Bridge, Multichain, Stargate, AvalancheBridge, OptimismGateway, and ArbitrumBridge had an average daily transaction volume of more than $10 million in October. Among them, PolygonPoS Bridge and Multichain are the highest, reaching US$32.82 million and US$21.52 million respectively, but the former has dropped to an average of US$19.47 million per day since November, while the latter has risen to US$29.48 million, the highest transaction volume this month Cross chain bridge. In addition to other cross-chain bridges, such as Axelar, Hop, Synapse, xDai, etc., the average daily transaction volume is mostly less than 5 million US dollars. Overall, in October, the transaction volume of cross-chain bridges increased by 14.43%, but the transaction volume of different cross-chain bridges varies greatly.
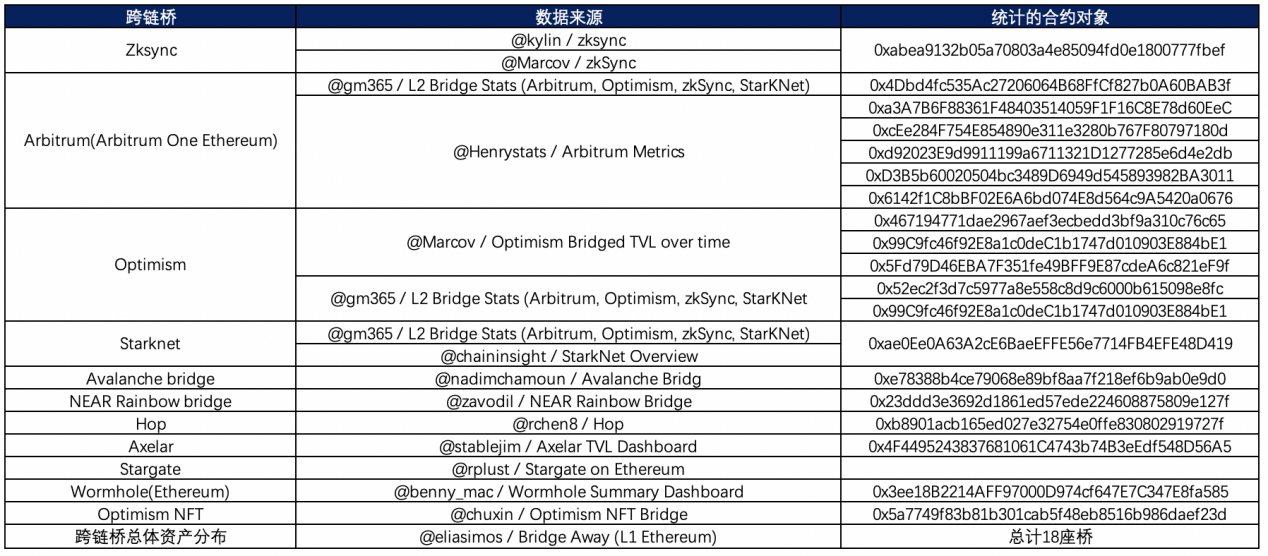
In order to further observe the changes in the capital scale of the cross-chain bridge. In order to achieve the structural alignment of the data analysis as much as possible, PAData selected 10 cross-chain bridges to observe the changes in their locked positions (the total balance in the cross-chain bridge contracts) or ETH deposits. Here, the data source refers to multiple open source dashboards on DuneAnalytics, the specific data source selection refers to Appendix [1], and the selection standard refers to Data Description [2].
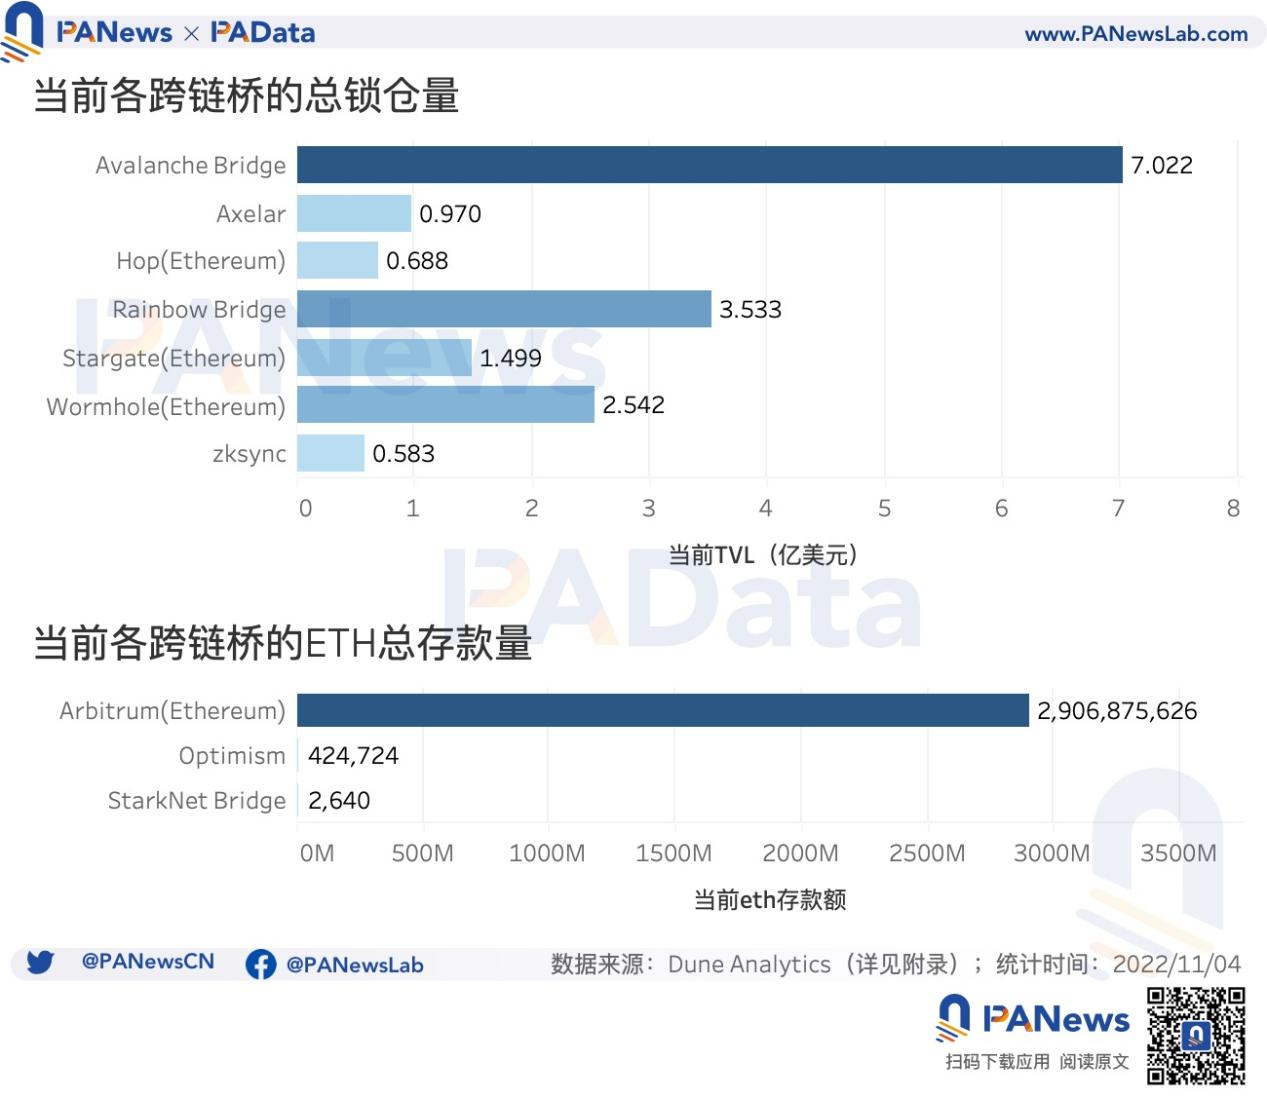
As of November 4th, the cross-chain bridge with the highest observed lockup volume is AvalanceBridge, which is about 702 million US dollars. It was followed by RainbowBridge at $353 million. Among other cross-chain bridges, there are Wormhole (Ethereum) and Stargate (Ethereum) with locked positions of more than $100 million. zksync, which is about to launch mainnet 2.0, currently has only about $58 million in locked positions. It can be seen that the cross-chain bridges that have been launched earlier, and the non-Ethereum public chain ecology of the bridge has a certain development have a larger scale of funds.
In addition, there are several Ethereum Layer 2 cross-chain bridges that have received much attention. There is no lock-up data that can be observed horizontally, but the size of their funds can be understood from the side of their historical accumulated deposits. As of November 4th, Arbitrum (ArbitrumOne) has the highest accumulated ETH deposits, with approximately 1.9366 million ETH. If estimated at a price of $1,500, it is equivalent to a total historical deposit of 2.905 billion. The total deposits of Optimism also reached 424,700 ETH, and StarkNet is about 2640 ETH. But it needs to be emphasized that the three go online in sequence. Arbitrum has the longest statistical time range, and StarkNet’s statistical time range only started from the end of April this year. Secondly, the total amount of ETH deposits does not include other ERC20 deposits, nor does it include the amount of redemption. The total lock-up amount will theoretically be much lower than the amount of ETH deposits.
According to the earlier data on the lock-up volume of each cross-chain bridge summarized by @eliasimos / Bridge Away (L1 Ethereum) on DuneAnalytics earlier (the contract addresses of some bridges have changed, see the appendix for the specific addresses in this article), then as of 11 On March 3rd, Polygon Bridges currently had the highest lock-up amount at approximately $3.143 billion, followed by Arbitrum Bridges and Optimism Bridges at approximately $1.508 billion and $1.227 billion, respectively. Others with locked positions exceeding USD 100 million include Ronin Bridge, Rainbow Bridge, Fantom Anyswap Bridge, and xDAI Bridges. Anyswap has long been renamed Multichain. According to Multichain’s official website, its current lock-up amount is around $1.78 billion. Listed here for some reference.
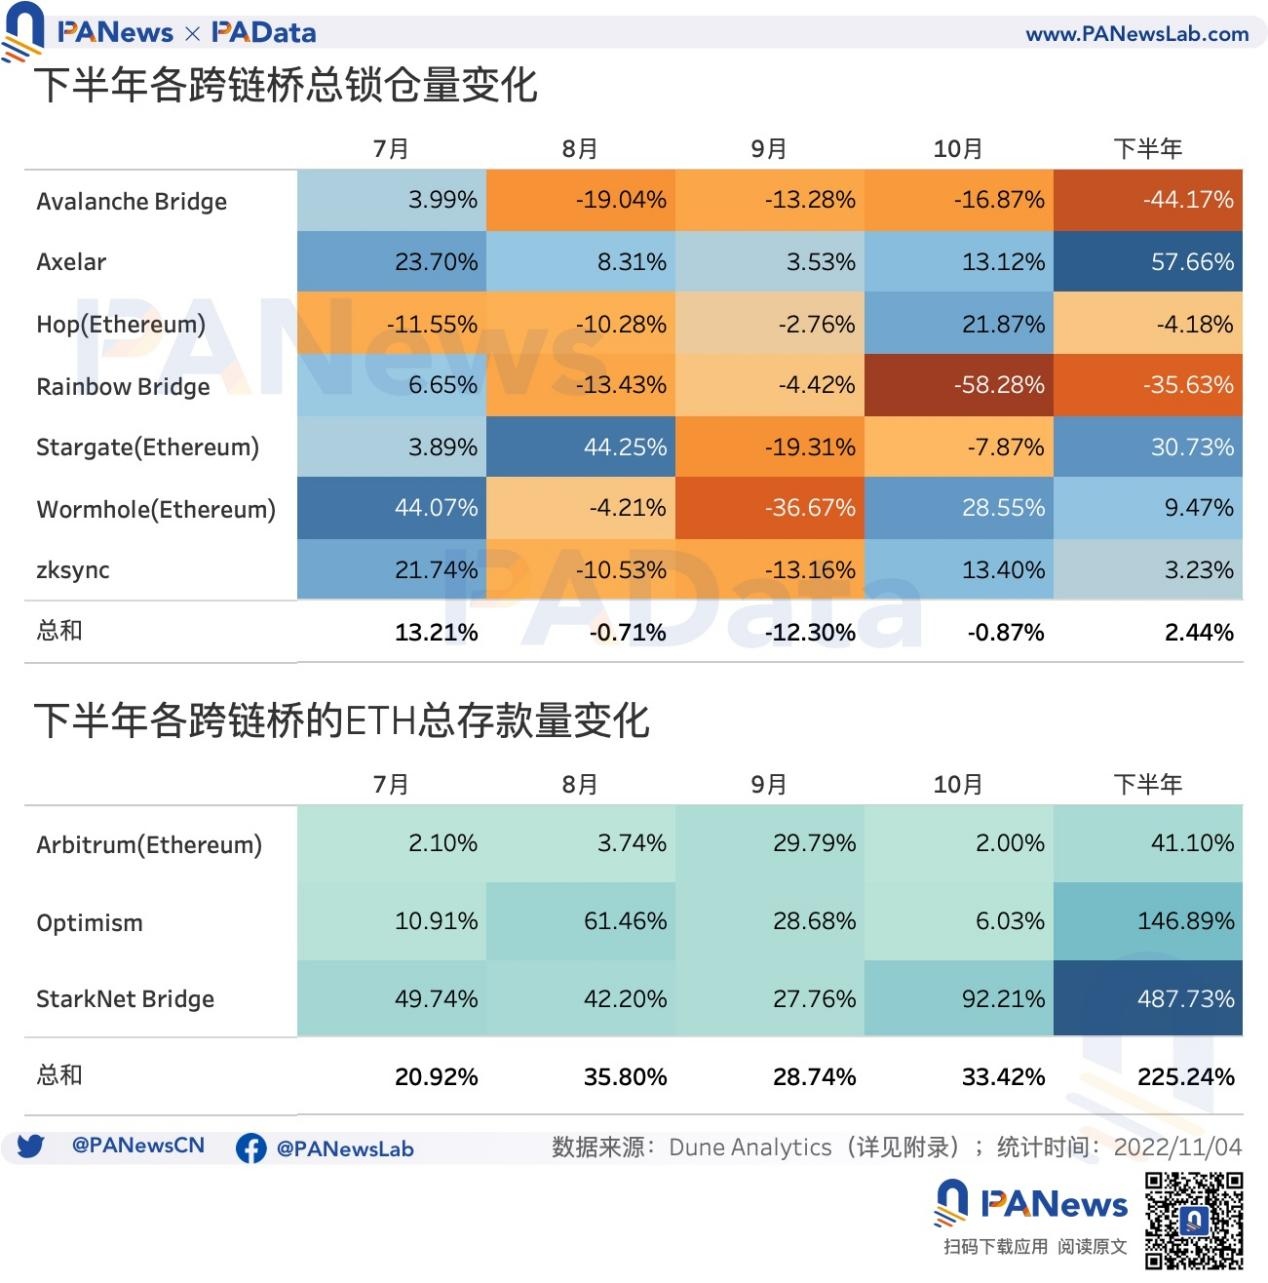
Judging from the growth of capital scale, the total lock-up amount of the seven cross-chain bridges increased by an average of 2.44% in the second half of the year. Among them, Axelar and Stargate (Ethereum) increased the most, reaching 57.66% and 30.73% respectively. In addition, Wormhole (Ethereum) has also increased by nearly 10%. During the same period, the total ETH deposits of the other three cross-chain bridges increased by an average of 225%, of which StarkNet had the highest increase, reaching 487%. It should be pointed out that the change of the lock-up amount takes into account the influence of the currency price, while the total amount of ETH deposits does not include the influence of the currency price.
From the perspective of user scale, within the scope of this observation, as of November 4, the cross-chain bridge with the largest number of accumulated addresses is Arbitrum, reaching 1.525 million. The cumulative addresses of Optimism and zksync have also reached a certain scale, about 850,000 and 679,000 respectively.
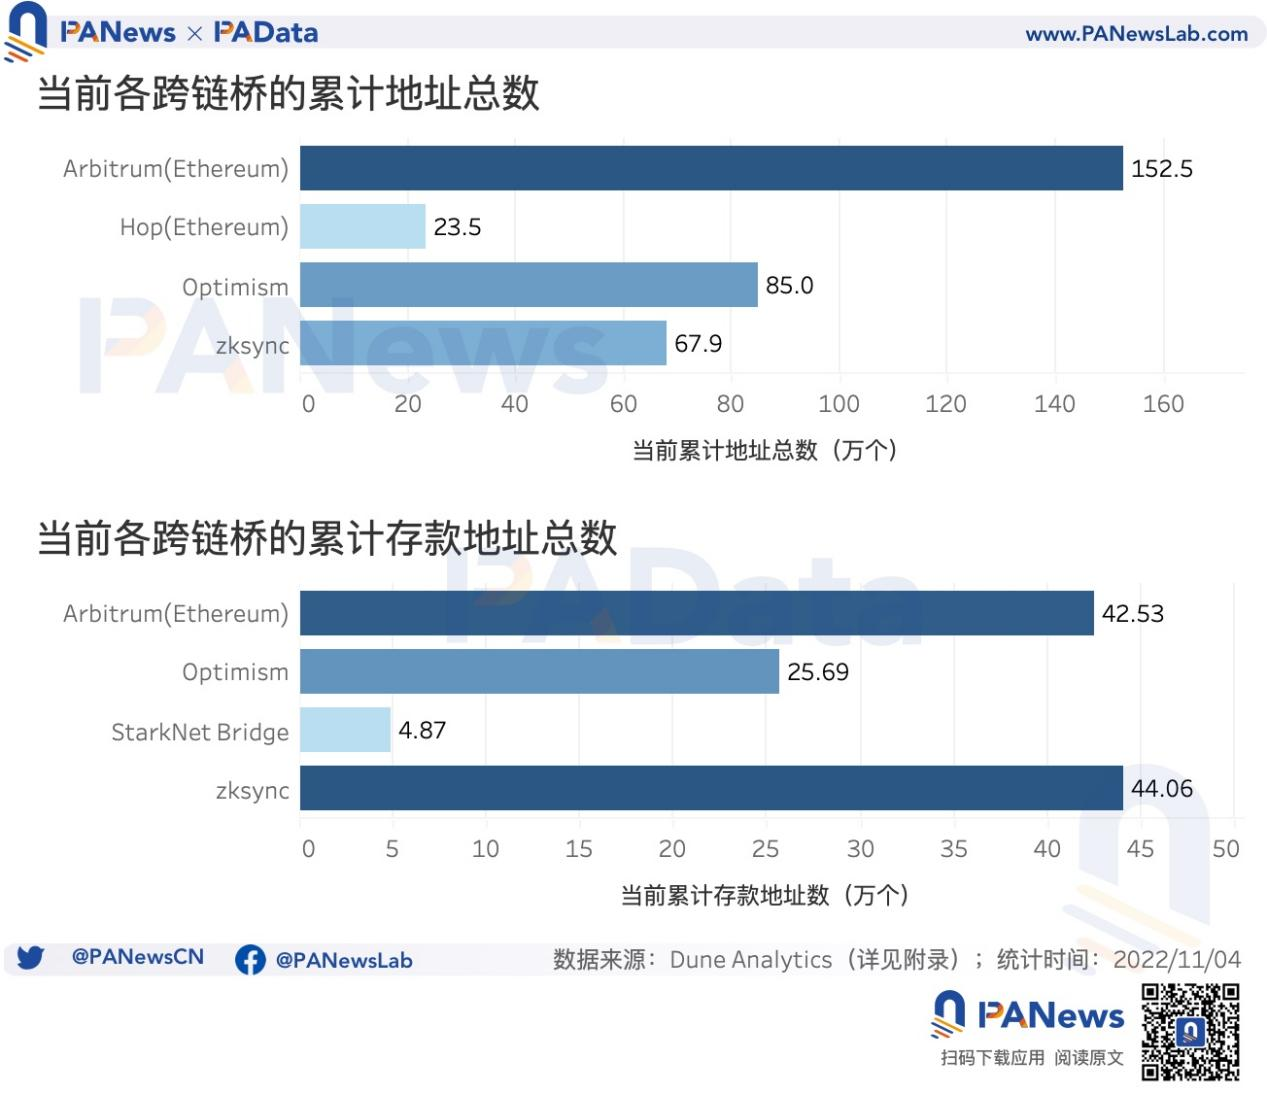
During the same period, zksync and Arbitrum had the largest number of accumulative deposit addresses, both exceeding 400,000, followed by Optimism with about 256,900, and StarkNet with the least number of less than 50,000. Here, the number of accumulated deposit addresses is less than the number of accumulated addresses because people may use the funds transferred in L2 to activate their wallets, and these addresses will not be included in the statistics of deposit addresses. In other words, the deposit addresses here are mainly counted from Ethereum The address of cross-chain deposit ETH.
Judging from the growth of user scale, the average cumulative address increase of the four cross-chain bridges in the second half of the year was about 64.77%. Among them, the cumulative address growth of Arbitrum and Optimism in the second half of the year was relatively high, both increasing by about 90%. The cumulative ETH deposit addresses of the four cross-chain bridges in the second half of the year increased by an average of 222.24%, among which StarkNet had the highest growth rate, reaching 595%. Secondly, the growth rate of Optimism is also higher, reaching 206%.

03. Cross-chain assets are still dominated by stablecoins, and most assets can only cross-chain through specific bridges
Judging from the current lock-up assets, there are still not many types of bridging assets. According to the statistics of Arbitrum lock-up assets by @Henrystats / Arbitrum Metrics on DuneAnalytics, a total of 228 assets (ever) appeared on the bridge, which is not complete this time. In observation, the bridge with the most bridge assets. Secondly, according to the official application list of OptimismBridge, the number of bridging assets is relatively large, reaching 73, of which 22 are OP default assets (OP DefaultTokenList), which means that the bridge provides users with more frequently traded assets. In addition, according to the open source data of DuneAnalytics (see the appendix for statistical contracts), there are about 57 types of bridging assets counted by zksync, about 21 types by RainbowBridge, about 18 types by Synapse, and about 14 types by Axelar. If you don’t consider whether there is currently a lock-up amount, then according to Multichain’s official website data, it has supported up to 3,004 cross-chain assets and 70 cross-chain blockchains. But regarding the data in this regard, there is currently no structurally aligned data that can be observed laterally.
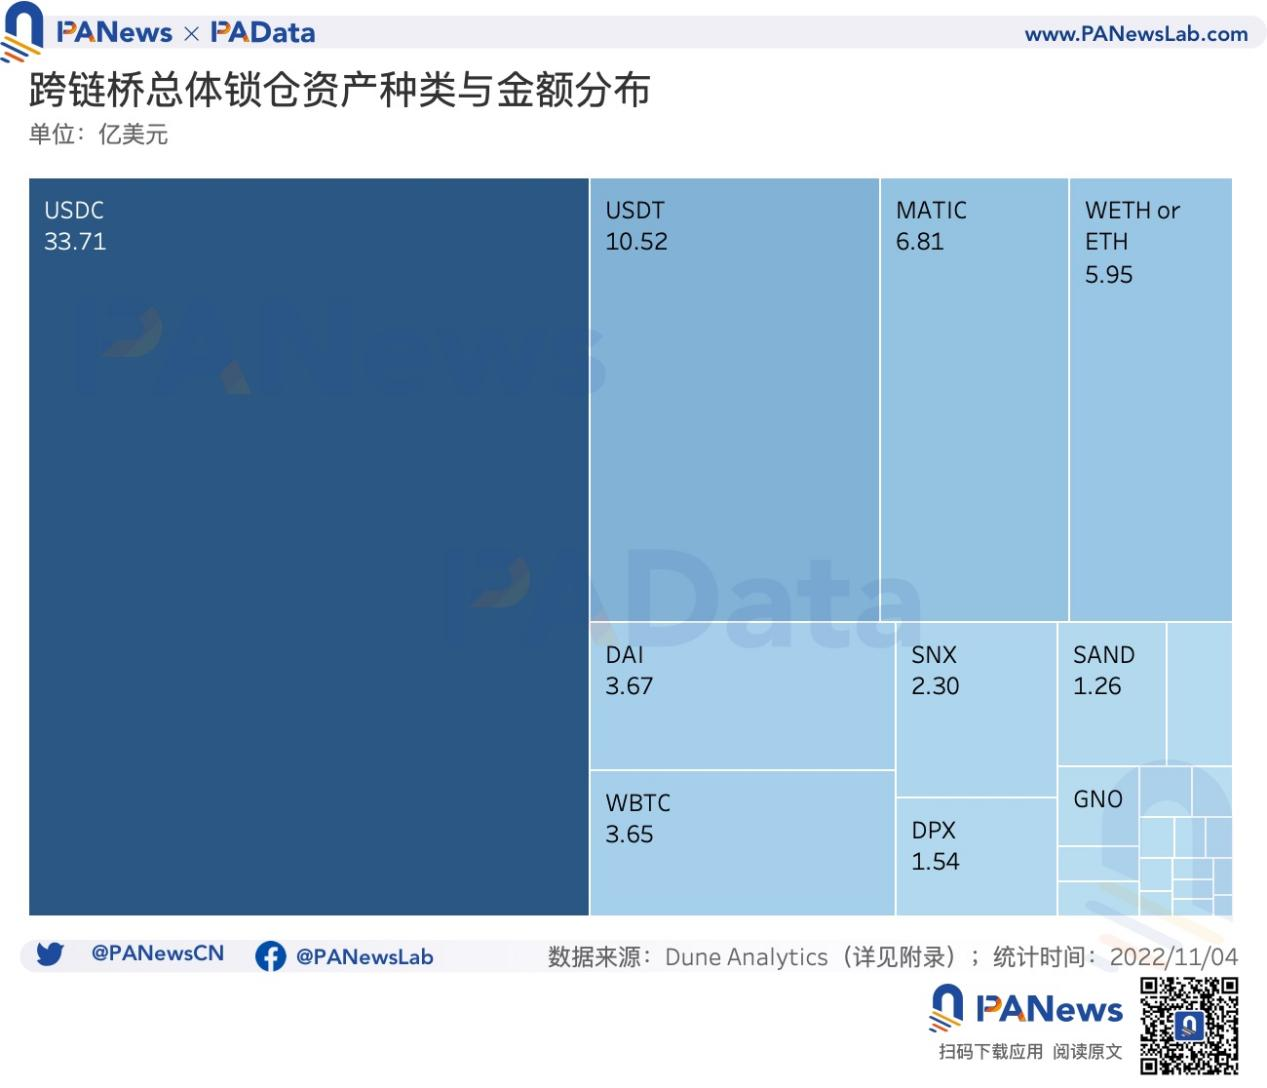
Judging from the earlier data of cross-chain bridge locked assets aggregated by @eliasimos / Bridge Away (L1 Ethereum) on DuneAnalytics, overall, stablecoins are still the most locked-up assets on cross-chain bridges, that is, stablecoins The cross-chain demand is the most extensive. Secondly, there are some native assets of bridge chains, such as MATIC, and encapsulation assets of mainstream assets, such as WBTC and WETH. However, some application protocols have relatively few tokens, and only a small amount of DeFi assets such as SNX, SAND, LINK, AAVE, CRV, and PERP have a high lock-up amount.
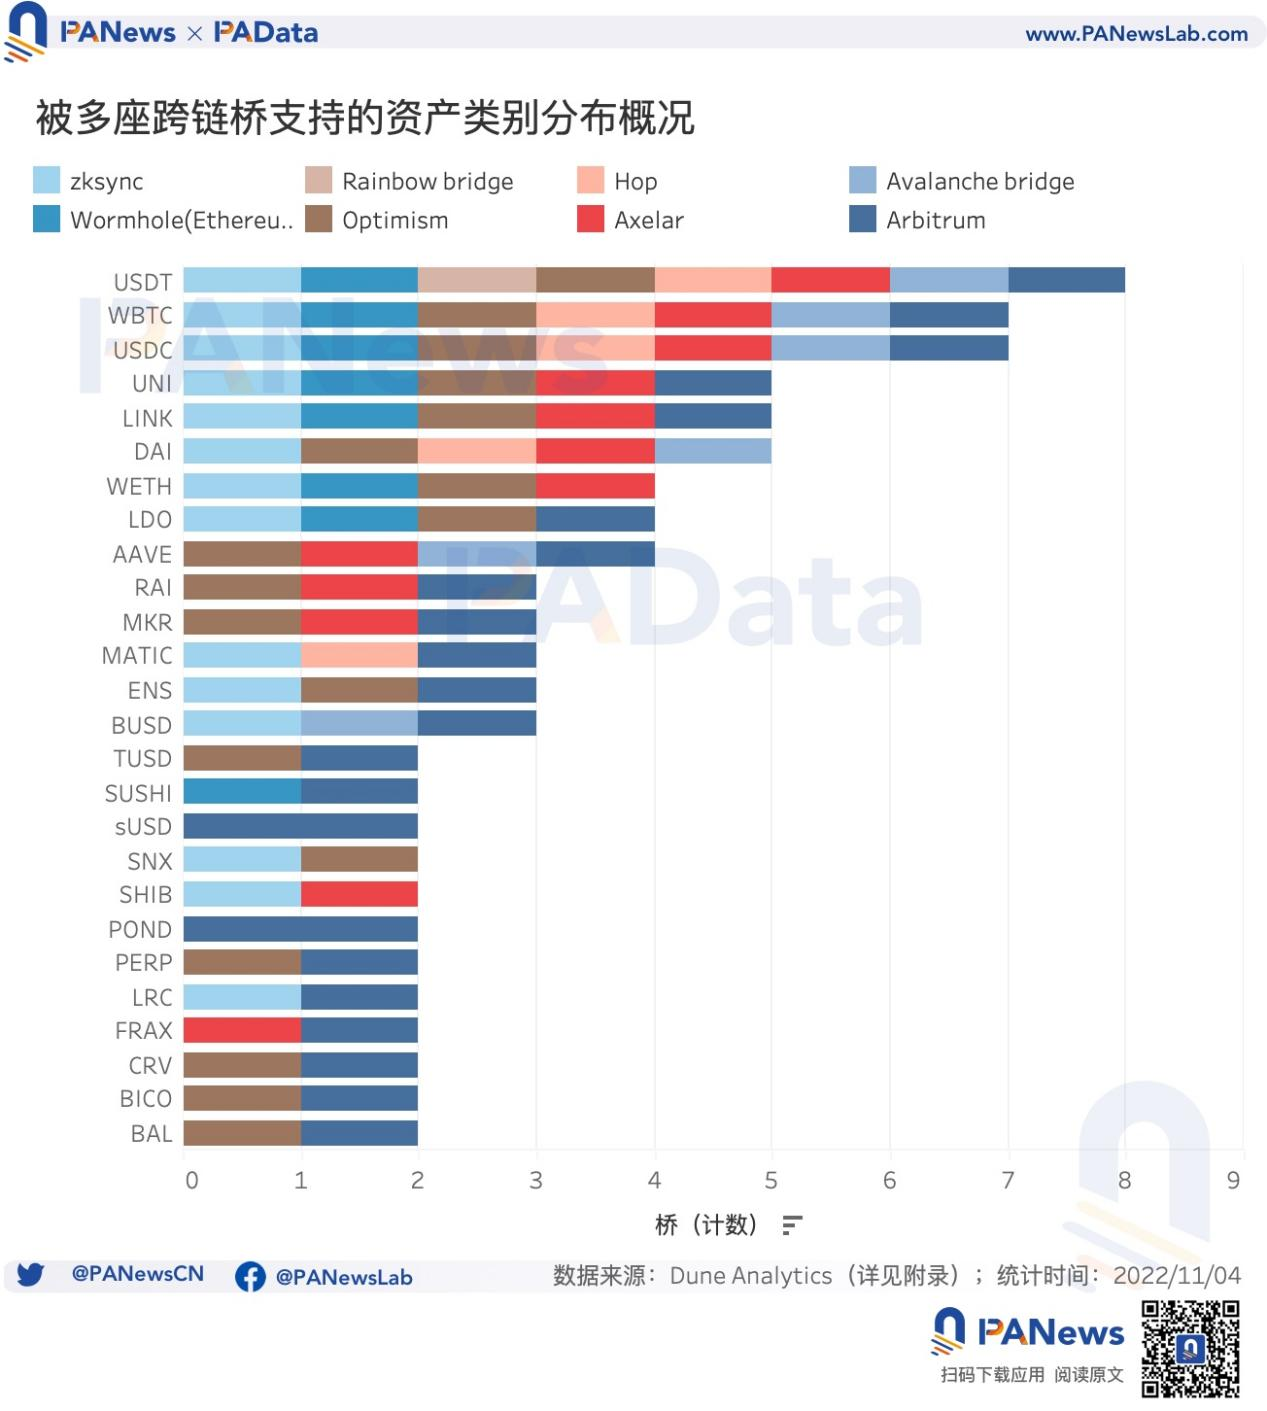
Judging from the number of licenses for cross-chain bridges of different assets, stablecoins and mainstream currency-encapsulated assets are also supported by more cross-chain bridges. Judging from the current assets with a large amount of locked positions in different cross-chain bridges, for example, within the scope of this observation, USDT, USDC, DAI and other stablecoins are all supported by more than 5 cross-chain bridges, and these assets have a relatively large cross-chain amount. In addition, stable coins such as BUSD, TUSD, and sUSD are also supported by at least two cross-chain bridges. In addition, the specific protocol assets that are widely supported across chains are mainly concentrated in the leading DeFi projects, but the number of assets is not large, including UNI, LINK, LDO, MKR, SUSHI, CRV, etc.
There are generally not many types of cross-chain assets, mainly stablecoins, which also shows that the long-tail attributes of bridging assets are not strong, and some non-mainstream assets choose exchanges and other channels to cross-chain. In addition, with the multi-chain layout of the upper-layer ecological protocol, it is also worth thinking about how extensive the application value and scope of the cross-chain bridge is. A case that can be observed is AvalanceBridge. When the assets originally bridged from Ethereum now have more local and safer counterparts on Avalanche, the dependence of assets on AvalanceBridge is reduced, which also explains its lock. Decrease in total inventory.
the data shows:
[1] According to the rules of data processing, the total value locked (TVL) refers to the value of the balance of ETH/WETH and ERC-20 tokens multiplied by their USD price (daily average).
[2] New bridges are appearing all the time, not every bridge will be included. This statistics is incomplete, please refer to the appendix for the contract addresses included in the reference data. For this statistics, cross-comparison of contract addresses and values is possible as much as possible. If the data from different data sources is different, first refer to the official website, and then refer to the newer contract.
[3] For details, refer to: Chainalysis, Vulnerabilities in Cross-chain Bridge Protocols Emerge as Top Security Risk, https://blog.chainalysis.com/reports/cross-chain-bridge-hacks-2022/.
appendix:
appendix:
[1] The open source data on DuneAnalytics referred to in this statistics includes: