120 Charts: Research and Judgment on Q4 Web3 and Digital Assets in 2022
Original author:Joel John
Original author:
Original compilation: Felix
There's been a lot of FUD lately about Web3 and digital assets. Bear market shocks.
Below is a compilation of around 120 diagrams that put into context where we are.
stable currency
bitcoin
Ethereum
stable currency
decentralized finance
DAO
NFT
decentralized finance
Metaverse and games
Emerging Topics - Bridges, Scalability, and Consumer Social
Mobile APP usage and redemption behavior
some notes
Some of my interpretations may be wrong. i'm still learning
I have mentioned the data source used below
If you're building something cool, HMU. My email is joel@decentralized.co
Glassnode
Nansen
Parsec
Cryptoquant
Santiment
Intotheblock
TokenTerminal
Dune
Cryptoslam
WeMeta
MetaMetriks
L2Beat
data source used
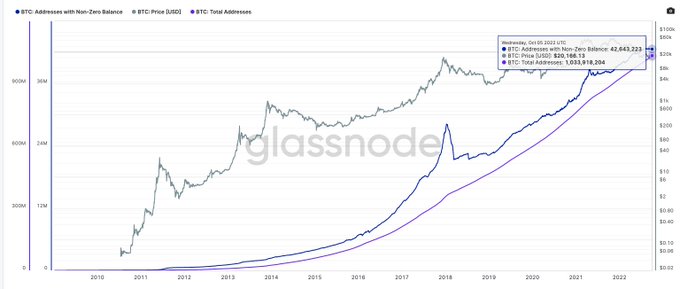
We start with bitcoin. As of July 2022, 1 billion Bitcoin wallets have been created. Of these, approximately 42 million had non-zero balances. It took Bitcoin about 4 years to see its first 1 million non-zero balance wallets. The last million took six months.
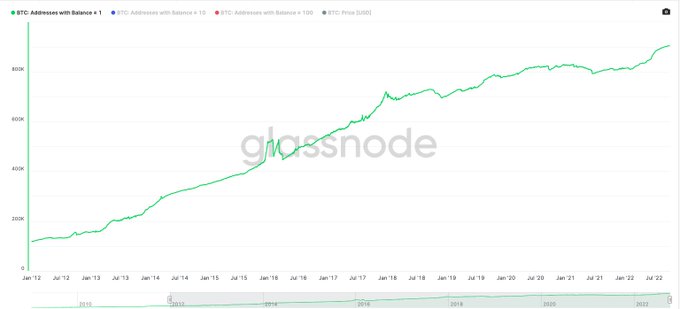
This number could easily be dismissed as a "zombie wallet". Wallets holding small amounts of bitcoin in random transactions in 2011 could add up. Wallets holding more than 1 bitcoin set a new ATH despite it costing 100x more to acquire one bitcoin, about 5 years ago.
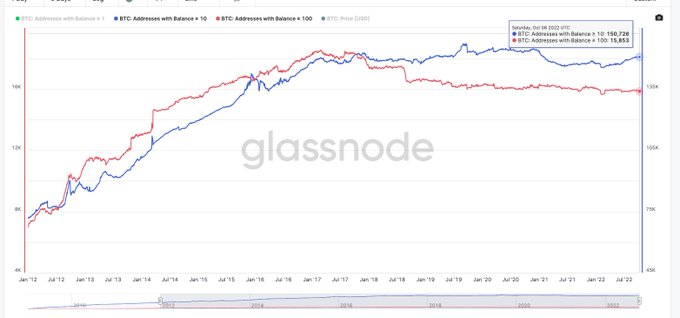
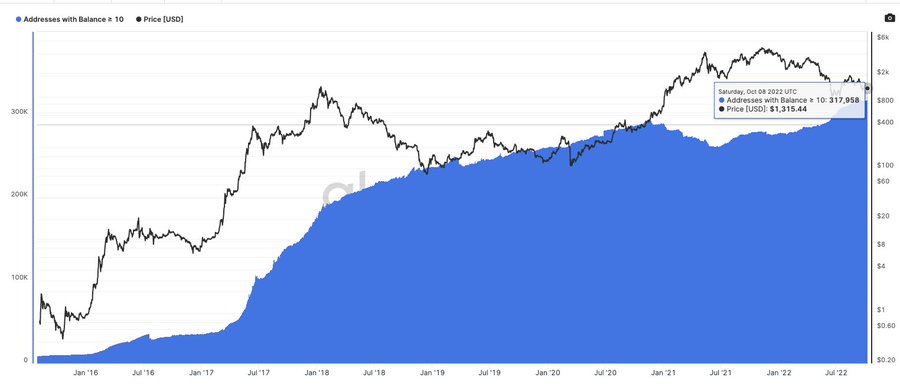
Since the price increase in June 2017, some larger wallets have withdrawn funds. Wallets holding more than 100 BTC peaked at 18k wallets in June 2017, while wallets holding more than 10 BTC hit 150k around September 2019, and since then they have more or less less and less flattened.
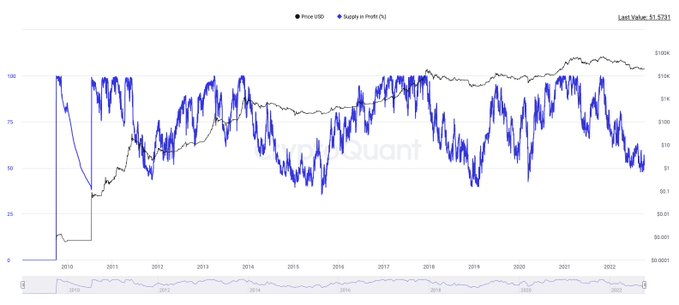
The Profit Supply Percentage takes the bitcoin price and the current price when the token was last moved to see if the token is profitable. At ATH - all UTXOs are profitable, currently, about 54% of utxos are in the green state. Historically, the indicator has bottomed out around 40%.
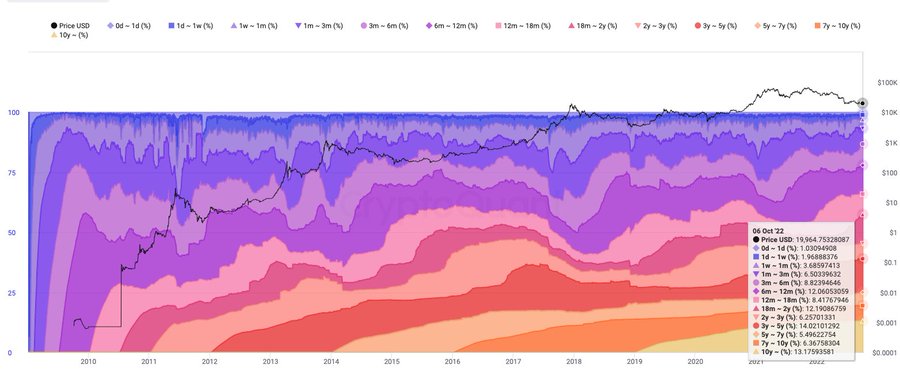
Age groups look at the percentage of web properties that have moved over time. The assumption is that moving some older coins will result in lower prices because they are cheaper, about 40% of coins haven't been moved in 3 years or more (including Satoshi's coins).
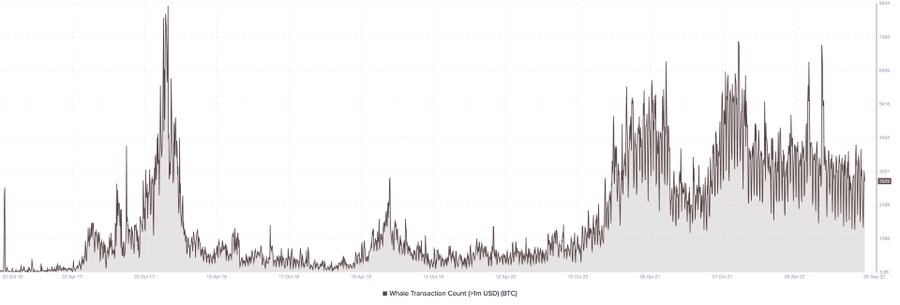
One way to measure Bitcoin usage is to count the number of transactions worth more than $1 million. While this depends on the price of Bitcoin, a floor is being established here. About 3,000 transactions worth more than $1 million appear on Bitcoin every day.
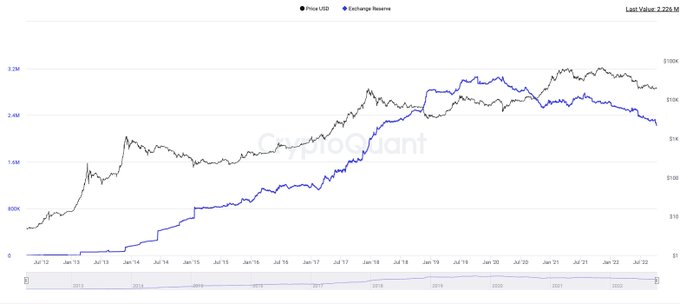
Nearly 10% of the Bitcoin supply currently relies on exchanges (approximately 2.26 million coins) At its peak this number was close to 3 million Bitcoins. Over the past year, about a million people have more or less flowed to cold storage/prime brokers.
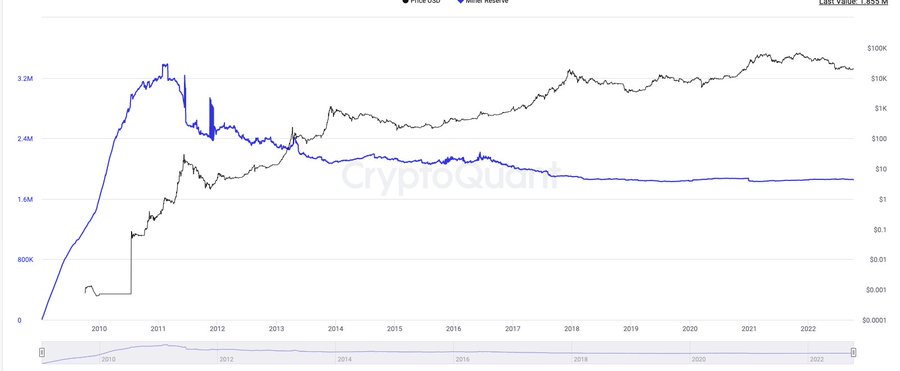
Miners are a critical part of the supply chain for new coins to enter the market. It was determined that the wallets held by them held slightly more than 1.9 million bitcoins (9%) of the supply. They appear to be strong holders - likely due to hedging through off-chain instruments such as options.
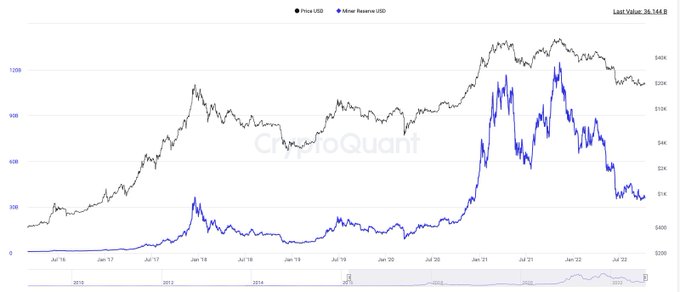
At its peak, miners held nearly 168 billion worth of bitcoins. That figure is now about $33 billion. As stated earlier, it would be unfair to imply that they lost all of these gains. A significant portion of this is likely to be hedged.
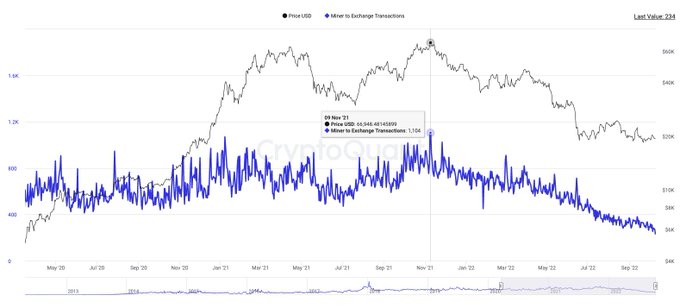
Correlation not causation etc. - but it's worth observing that last year, wallets owned by miners made the most transactions to exchanges. Since then, miner-to-exchange transactions have been on the decline.
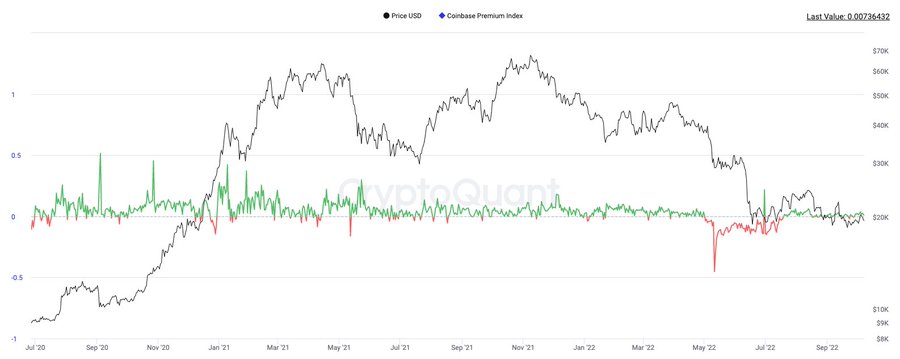
The Coinbase Premium Index looks at the difference between the price on Coinbase pro (for btc in USD) and the price on binance (for btc in USD) It is a measure of the interest of US investors to buy Btc. A little flat lately - but worth noting the May 2022 discount.
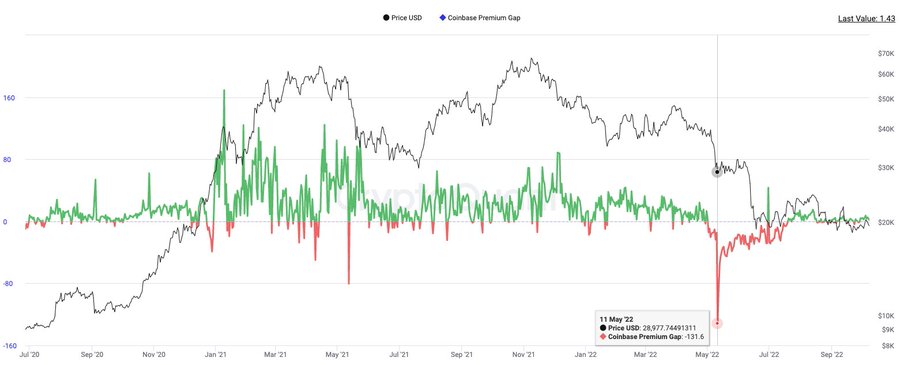
Thanks to Do Kwon, this premium gap has dropped from around $160 when Elon was talking about Bitcoin in January 2021 to a low of $140 currently - and it remains choppy, like the rest of the market.
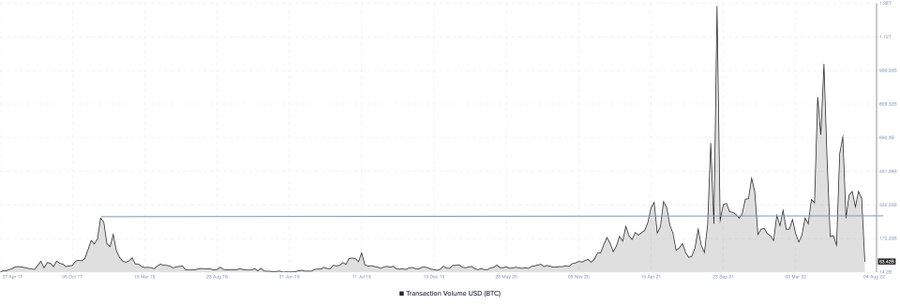
On average, about 350 billion bitcoins are transferred via bitcoin every week. In terms of size, this is about 5 times the annual inbound remittances from India, a figure that varies according to the price of Btc, but is still above the 200 billion USD range in 2017.
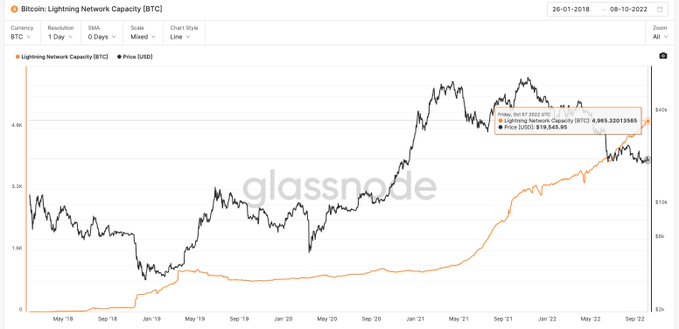
I'll end Bitcoin with WrappedBitcoin. Currently - there are about 50 times more coins on wbtc than the capacity of the lightning network.
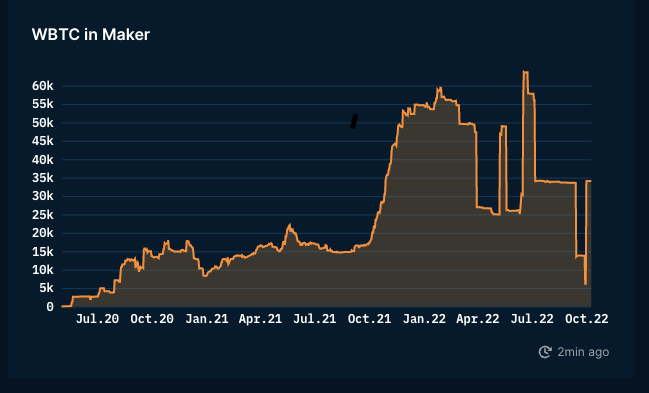
About 250,000 bitcoins of that — about 60,000 bitcoins in MakerDAO's heyday. Now that number is closer to 40k. DeFi yields are naturally the key driver of this mix between Ethereum and Bitcoin.
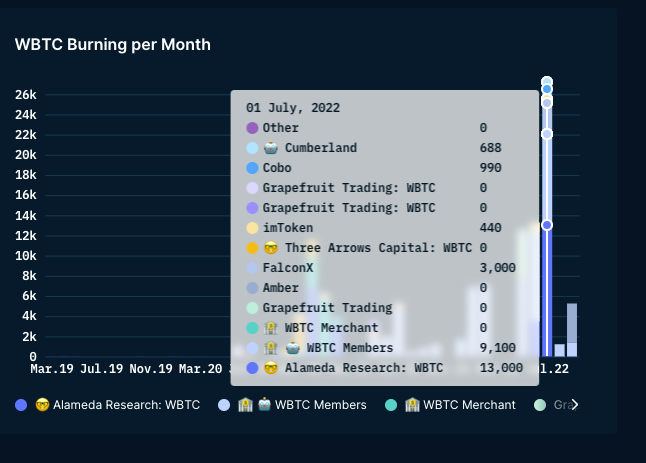
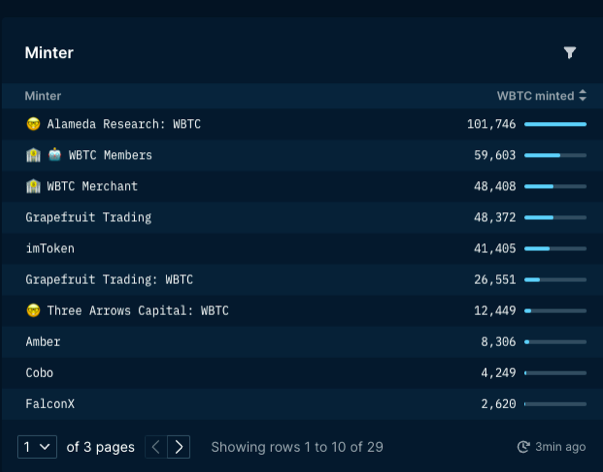
Players like Alameda, Grapefruit and 3 Arrows (uh) - have historically been critical to its adoption. Part of the fire in June was due to the market correcting itself and stress testing everyone's balance sheets in May.
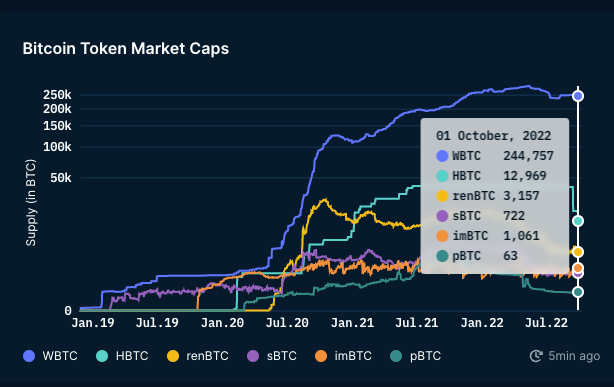
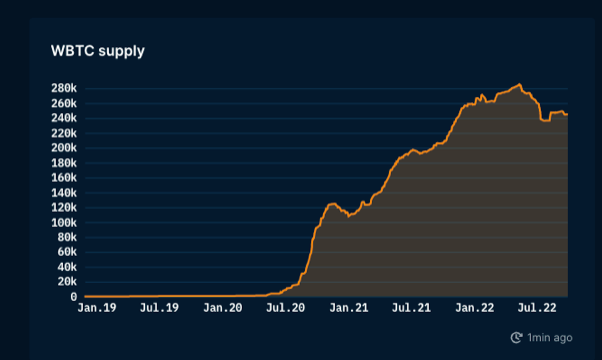
In terms of market share, nothing can compare to WBTC. The second largest player owns 5% of the btc-on-eth supply. Given their distribution and reach, I think a similar offering from Binance could have huge traction.
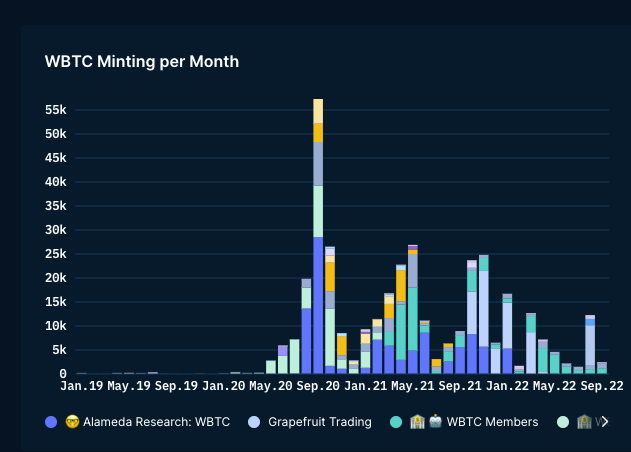
Having said that - it does appear that interest in Bitcoin wrapping variants is on the decline. At its peak, we saw close to 55k wbtc being minted every month. In August, that number dropped by about 80%.
Next, we examine what happened to Ethereum. If we take deployed smart contracts as a measure of developer interest - it could be argued that activity has trended toward 2019 levels. However, that doesn't account for the fact that other chains might be grabbing the developer's attention.
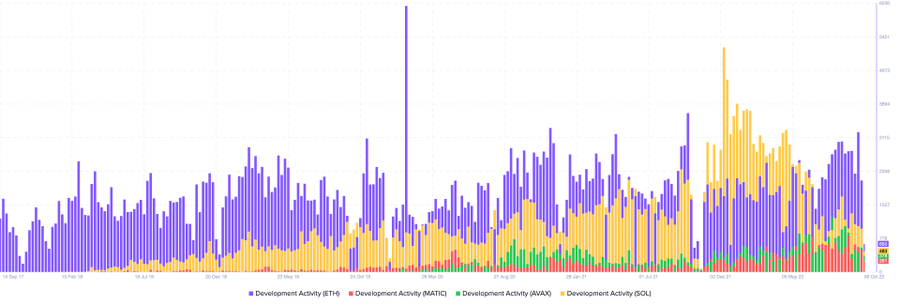
Santiment has a developer activity index that takes several GitHub repositories and their activity to give an indicative measure. Here's how Solana, Matic, Avalanche are catching up to Ethereum. Note: the data is very crude and doesn't make much sense/gaps in itself.
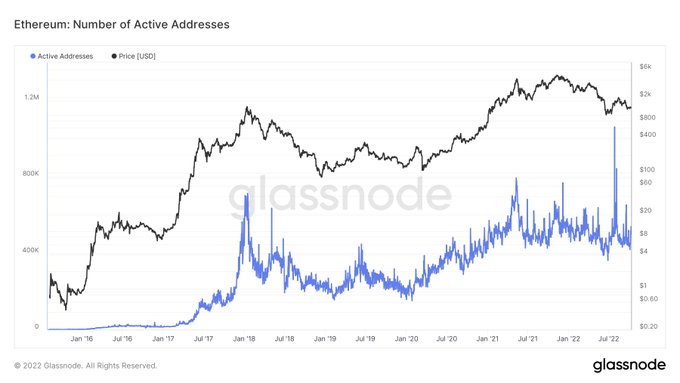
Developers develop in multiple places, but what happened to Ethereum? We start with the basics. Active wallets are a great place to start. I find it interesting that despite a year of bear market - Ethereum wallets haven't significantly pulled back to new lows.
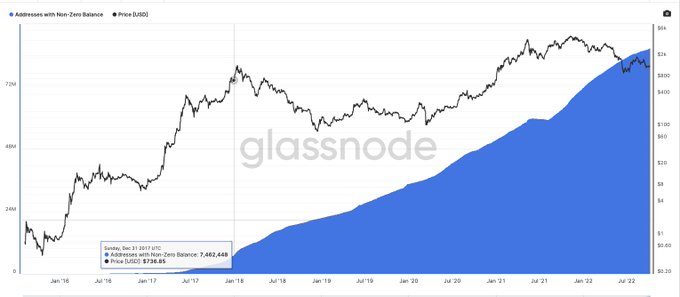
A 2x increase in daily active addresses isn't much - but impressive. Since the last ATH, the number of non-zero wallets on Ethereum has increased from about 8 million to 86 million. Granted, people use multiple wallets - a decent indicator of network activity.
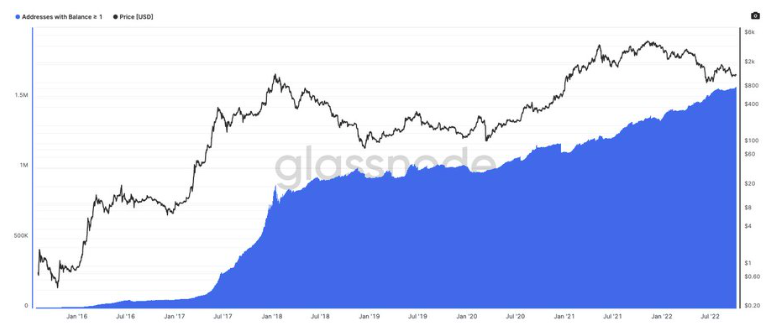
People will always argue that these are zombie wallets - so we explored every wallet over 1 ETH and 10 ETH. Both indicators are at record highs. There are approximately 1.58 million wallets holding more than 1 ETH today - compared to 882,000 in January 2018.
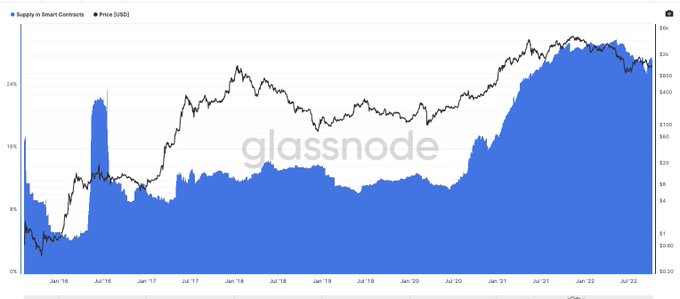
The measure of whether people trust the network is the percentage of supply in the smart contract. If you can use it to generate yield, you do. In ETH, 27% of its supply comes from smart contracts. The bear market didn't affect that number either.
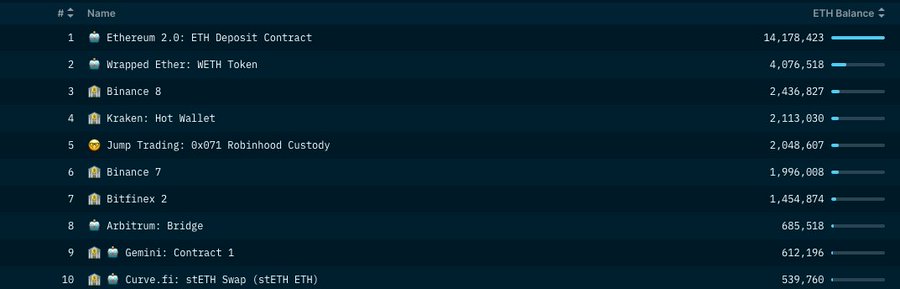
Four of the top ten wallets holding Ethereum are smart contracts or variants thereof — and it remains one of the few assets where CeFi is gradually losing share of smart contracts. So it's safe to say - people are using Ethereum - and increasingly using its smart contracts.
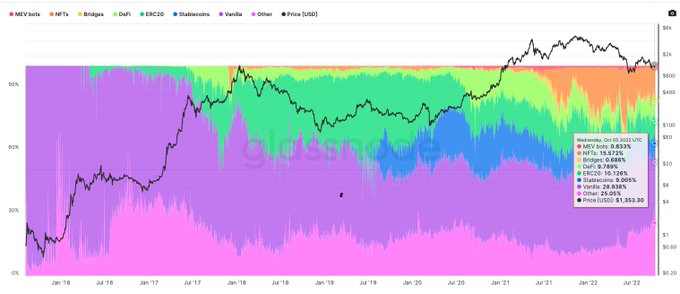
This chart breaks down the types of transactions on the network. In 2018, when it hit its ATH - about 60% of transactions on the network simply sent ETH from a to b. That number has now dropped to 30%. - 15% for NFTs - about 9% for stablecoins - 10% for DeFi.
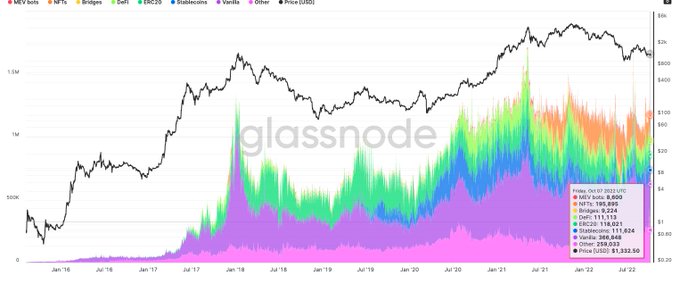
Use cases like NFTs, DeFi, and stablecoin transfers actually far outnumber the number of transactions related to erc-20 tokens in a single day. (Yes, you can speculate with these apps too).
Use cases such as NFTs, DeFi, and stablecoin transfers far exceed the number of transactions related to ERC-20 tokens on a given day. (yes, you can speculate with these apps too)
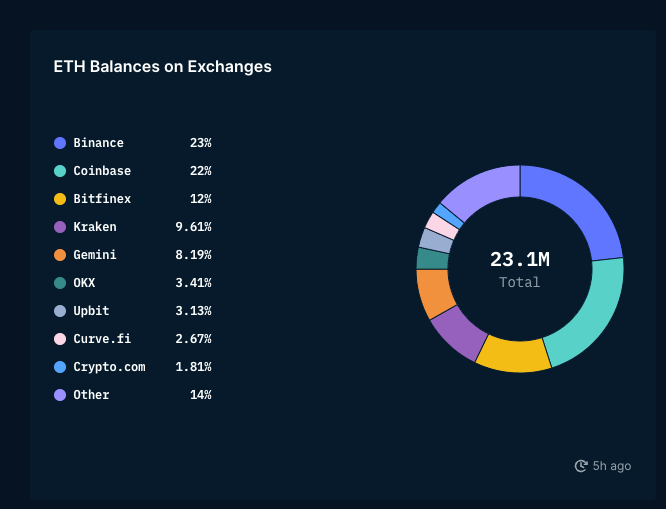
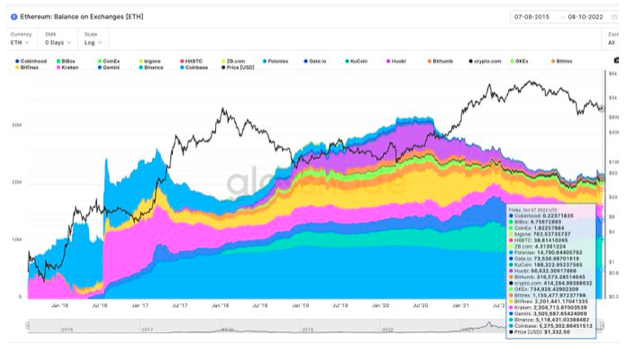
Most of the balance is held by Binance and Coinbase, which together control about 44% of the ETH balance held on the exchange. The second chart here shows how Coinbase stagnated in market share while Binance caught up (don't know why Nansen's chart doesn't include FTX).
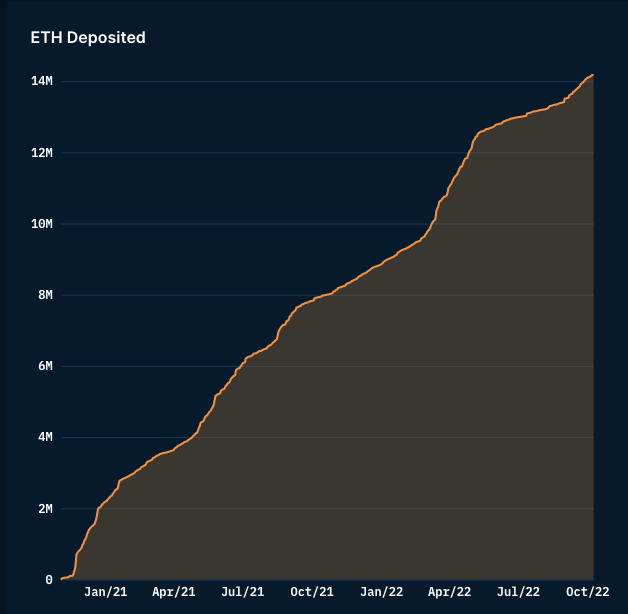
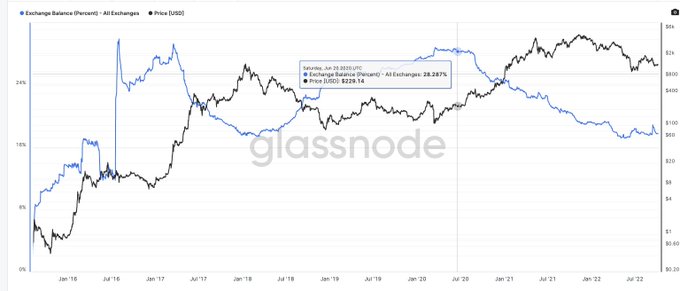
Ok - so ETH is leaving exchanges, but why? The main contributor to this trend is DeFi. We'll dig into that later. Since January 2021, approximately 14 million ETH has been staked on ETH2.
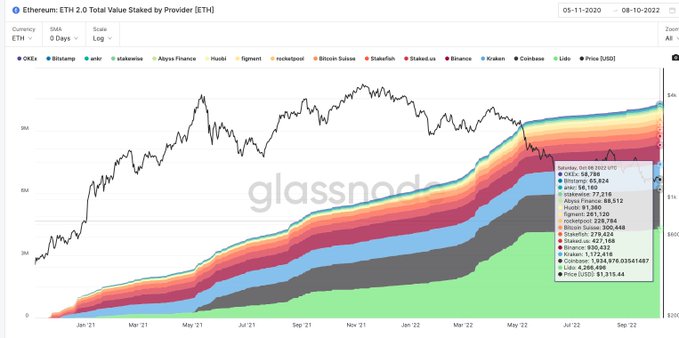
There's been a lot of discussion about this - but it's interesting that Lido far outpaces established exchange alternatives Lido with ~4m eth staked via it in terms of total value staked vs. 3m staked via binance+coinbase .
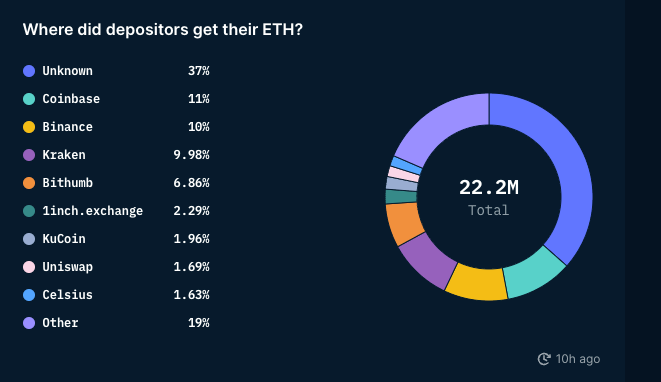
The reason I say exchange deposits for staking is this graph from Nansen - about 40% of staked ETH can be traced back to centralized entities.
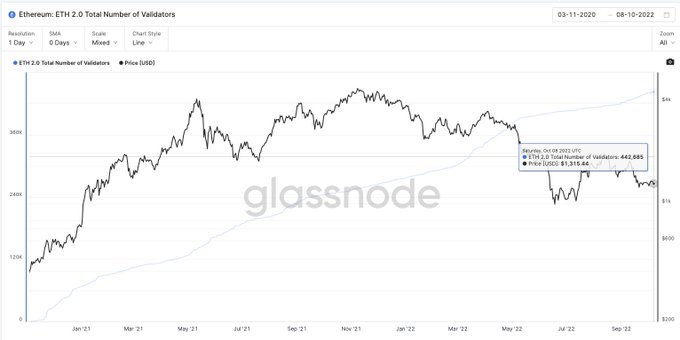
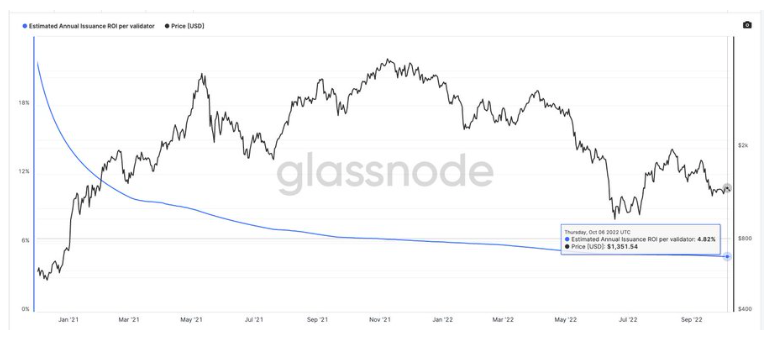
At the time of writing - there are over 442k validators on the network. So part of the appeal for ETH holders is that they can see future theoretical yields of about 4.5% on ETH staking.
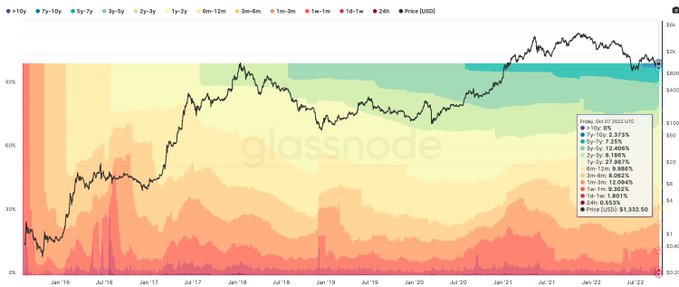
Nearly 30% of ETH supply has been dormant for two years or more. I'm ignoring hodlwaves over 1 year here because ETH2 staking affects this metric. This is a large portion of the supply willing to withstand multiple cycles.
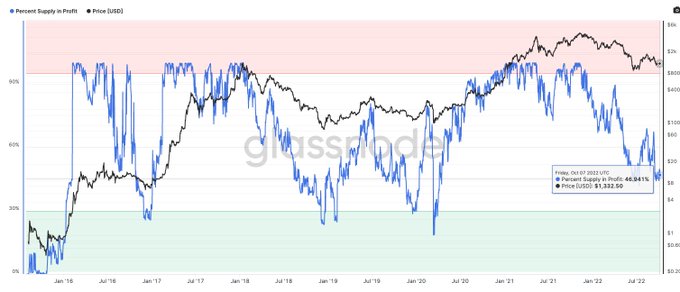
Part of the reason for this willingness is that much of the network is in relative profit. $1290 - Close to 46% of ETH holders are still in the green. During the March 2020 crash, the indicator hit an all-time low of around 18%.
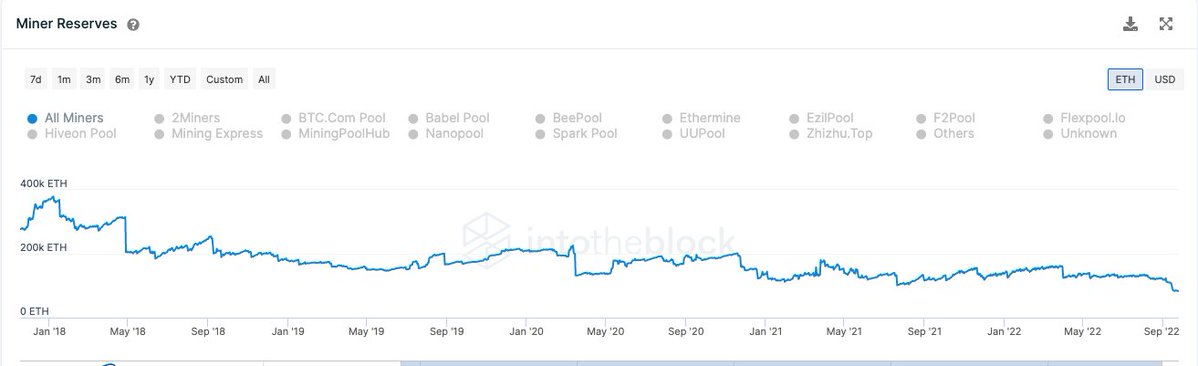
One of the interesting consequences is that miners hold less ETH. It's possible that they took their AUM and staked it - but since January 2018, ETH's miner reserves have increased from about 400k to 83k as of this writing.
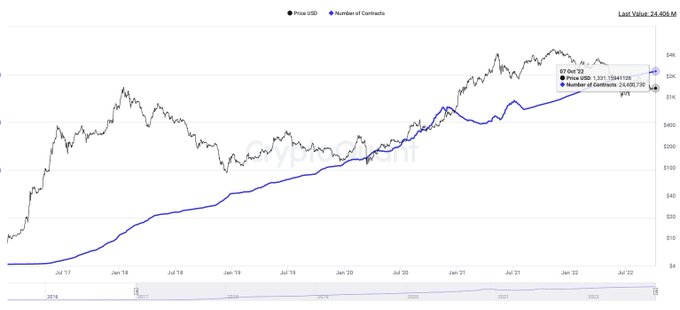
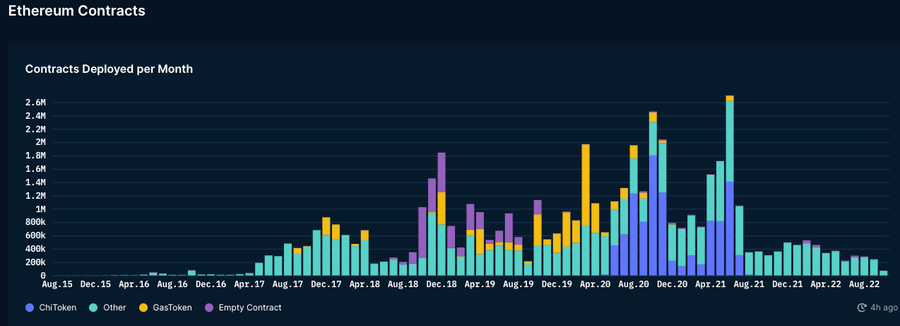
One way to measure how much ETH has grown is to look at the number of smart contracts deployed. As of this writing, there are approximately 24 million smart contracts on the network. About eight times the 3 million during the 2017 rally.
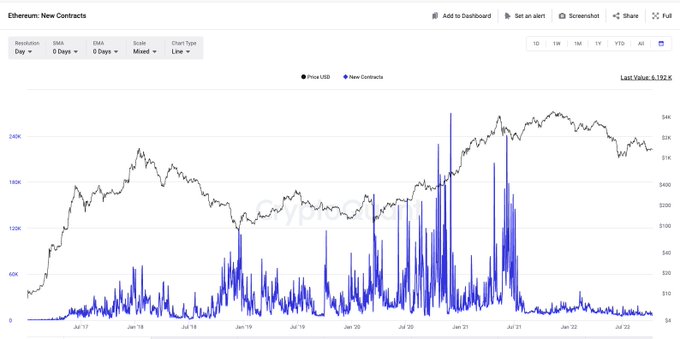
Despite the huge lead, interest in deploying new smart contracts on Ethereum is waning. So the numbers are more or less back to where they were in 2019. The developer's mind-share may be captured by other emerging layers1.
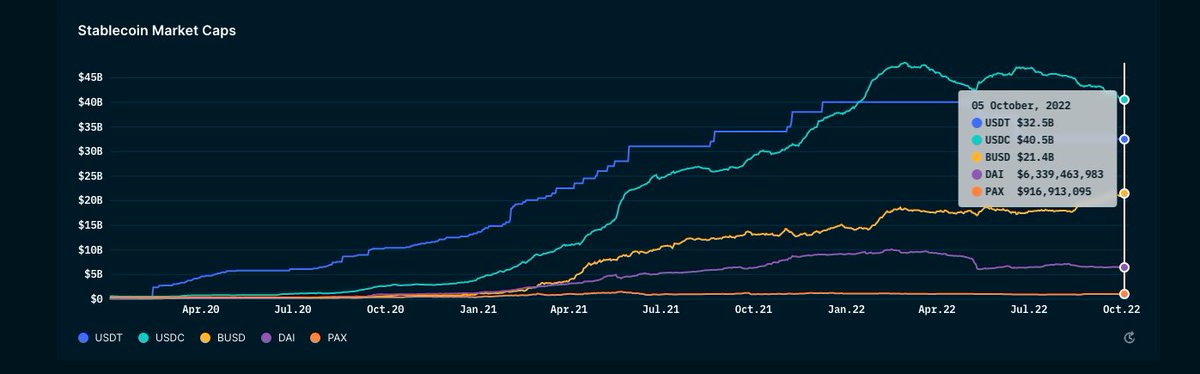
Stablecoins have one of the most beautiful growth trajectories of all cryptocurrencies. A few years later, their combined market capitalization has exceeded $100 billion. 2022 is the year when USDC finally surpasses USDT in terms of market supply.
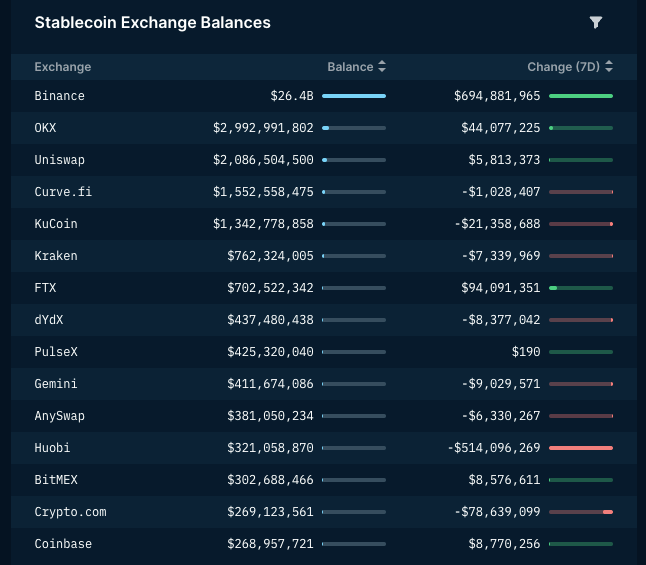
Of that roughly $100 billion, Binance alone has a $26 billion balance sheet. Although, if - that number is partially pushed up by the 20 billion BUSD they hold. From a purely tether point of view - Binance owns 20x more USDT than its North American peers (ftx, Kraken).
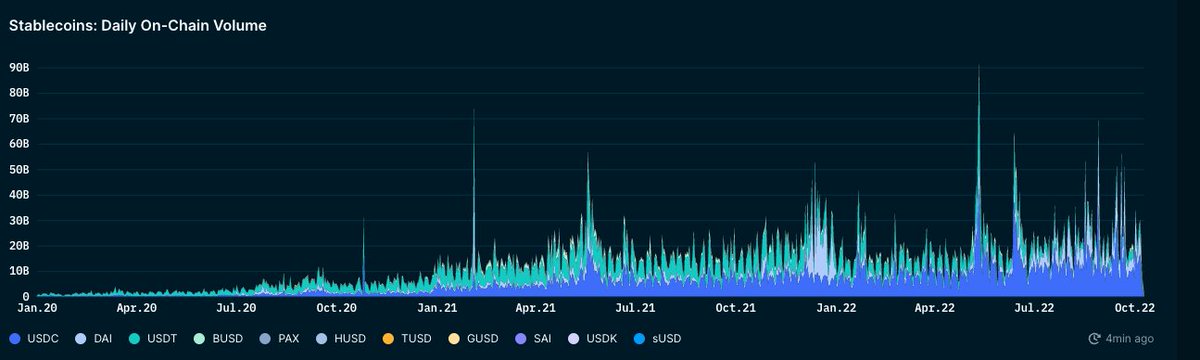
There may be gaps in this data as it may not involve some L2 and non-EVM chains - but in terms of transaction volume, despite the bear market, stablecoins have grown ~22x over the past two years. From about 600 million per day to about 14 billion today.
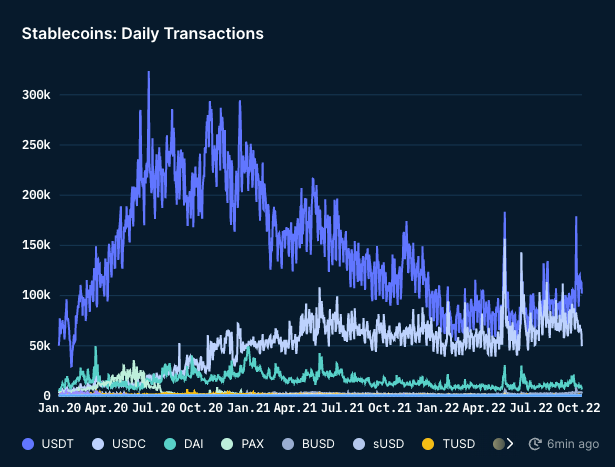
June 2020 (DeFi Summer? ) - Today, the cumulative transaction volume of the stablecoin tx is about 500,000 per day, close to 200,000. What could happen is 1. Whales using stables as holder assets during bear markets 2. Larger stablecoin transactions with fewer wallets.
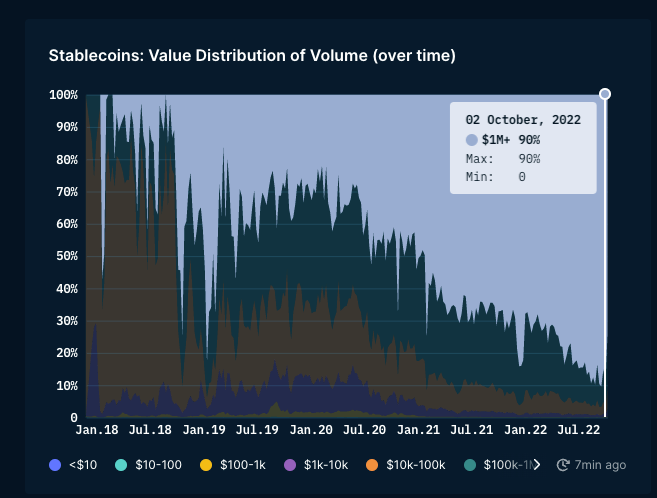
The reason I suggest this is that transactions worth over 1M account for approximately 90% of mobile transaction volume today, despite being less than 0.5% of transaction volume. This is in sync with what we typically see in the traditional economy - so no surprise.
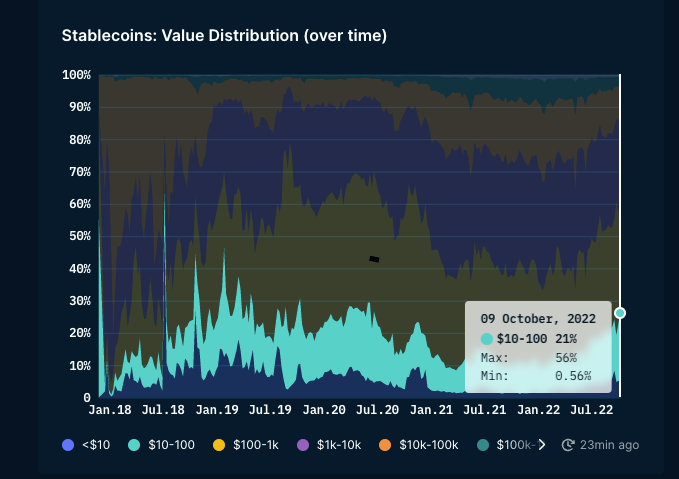
One interesting thing I noticed about this data is that transactions under $100 account for a quarter of all transactions via stablecoins. People still use these networks to send for small fees, although the fee is around 1-2.
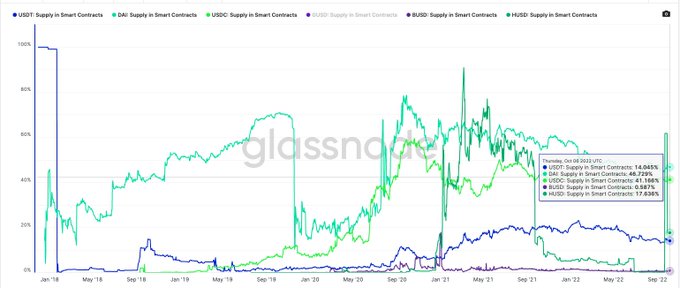
Due to lack of coverage of non-eth chains, this number may drop somewhat - but 1. BUSD is the least used stablecoin on smart contracts 2. 17% of USDT's supply comes from smart contracts 3. Nearly half of DAI and USDC are both on the smart contract.
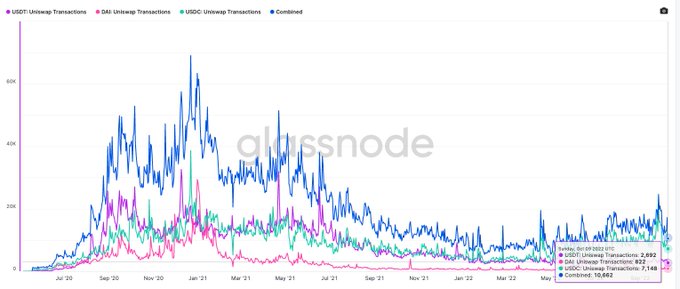
I'm curious how many of these stable assets are traded on Uniswap. At its heyday - the volume of stablecoin transactions via uniswap was around 60,000. Close to 10k today which is a significant drop (concurrently with decreasing volume/activity).
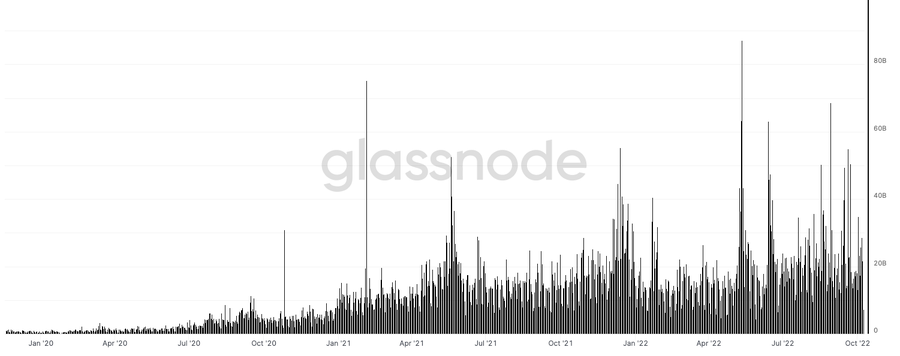
Until January 2020, we saw about $1 billion moving on-chain via stablecoins in a single day. That number is now up about 25x on a random day. In the chaos of May 2022 - about $87 billion worth of stablecoins moved between wallets. (conservatively)
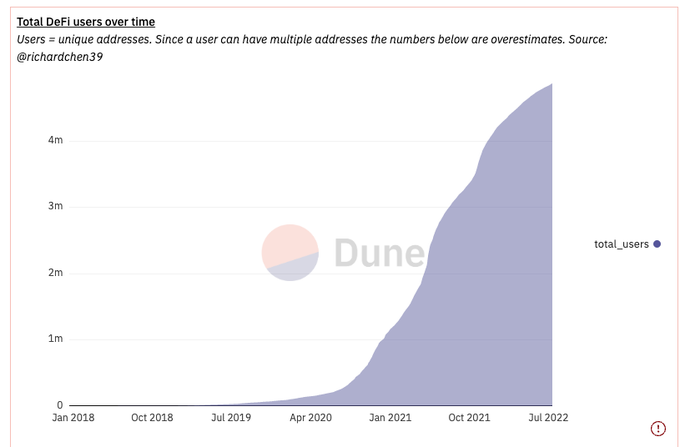
This leads me to the next part - DeFi. This chart by Richard Chen shows the exponential growth rate of DeFi. From about 4k users in January 2019 to 4.7 million today. With around 10 million users, DeFi accounts for less than 0.3% of the network's user base.
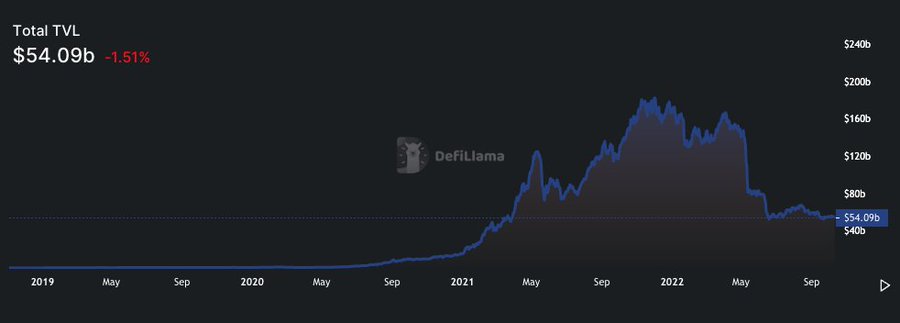
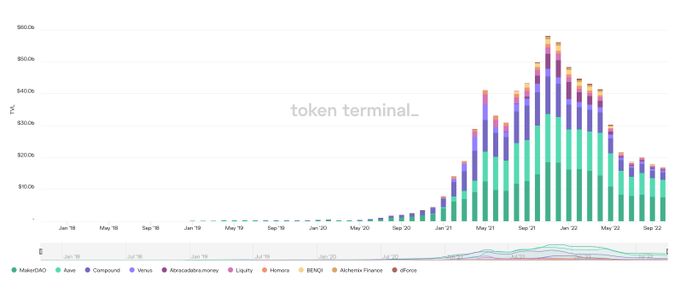
Whenever the media reports on DeFi - it rushes to explain how DeFi TVL collapsed without taking into account the drop in the underlying asset price. DeFi didn't reach its first billion TV until May 2020 and from there we're still 50x.
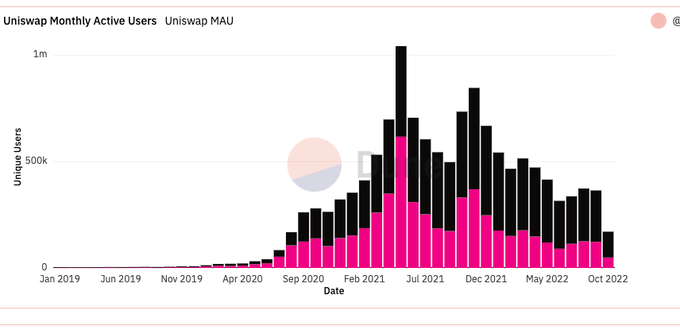
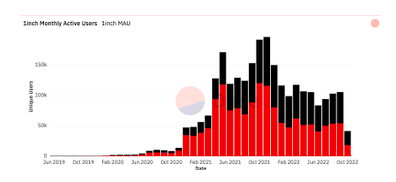
Likewise, there is a general rush to clarify how MAU on DeFi broke down. From my observations, in the absence of token rewards, there will be pullbacks, especially in volume. But the users themselves didn't disappear.
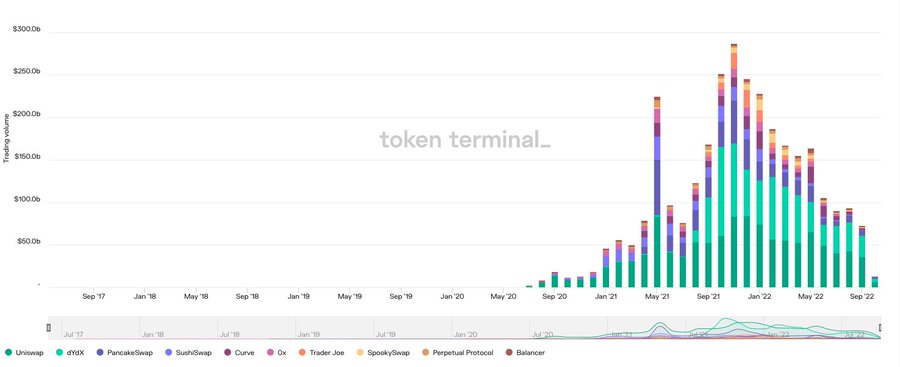
That's not to say volumes haven't taken a hit - our volume on Defi platforms has dropped from a peak of $250 billion to about $100 billion. But interestingly - $100 billion is still an average of 20 million per month in 2019 5,000 times the trading volume in USD.
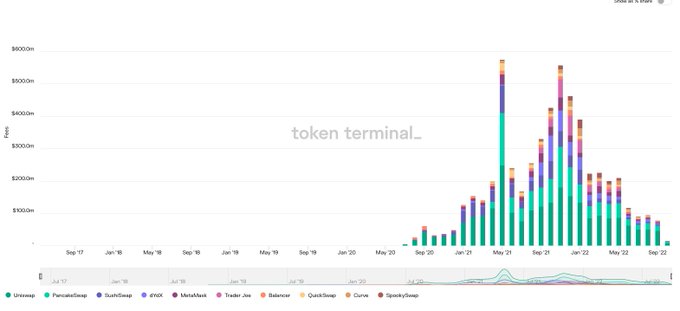
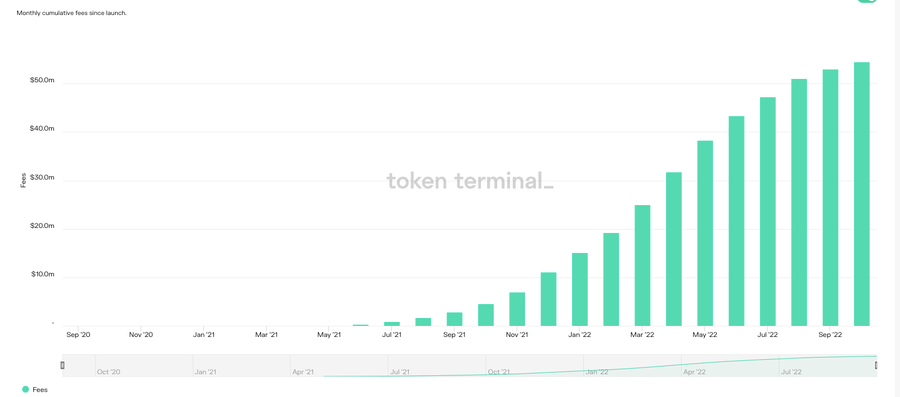
Lower transaction volume + lack of token incentives = lower fees generated. In its heyday, the famous dex platform generated about $600 million in fees; our fees are now down to about $80 million.
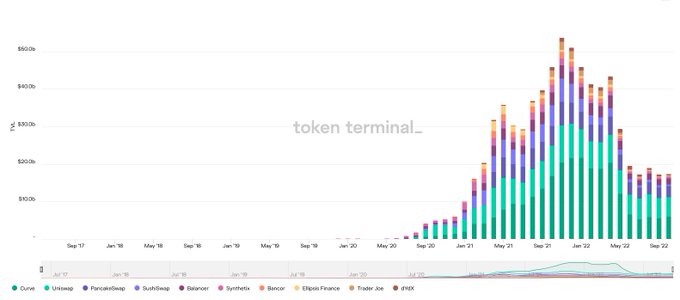
TVL on these platforms has dropped from $50 billion to about $20 billion -- but in terms of activity declines, it appears we've hit a bottom. Those who are still LPing and trading are sticky users and will likely continue to do so.
The drop in TVL also applies to lending apps -- down about 50% -- due in part to the May crash. At its peak, the lending app processed about 58 billion - now it's about 18 billion.
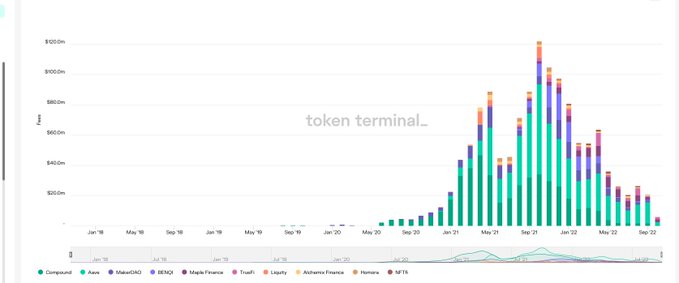
Lack of volatility + lending demand hit lending app fees - cumulative monthly fees for these platforms fell from about 120 million to about 20 million.
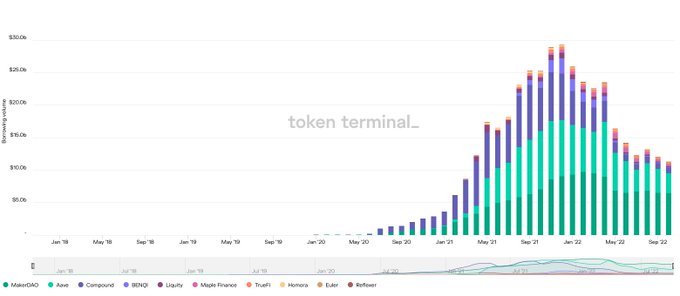
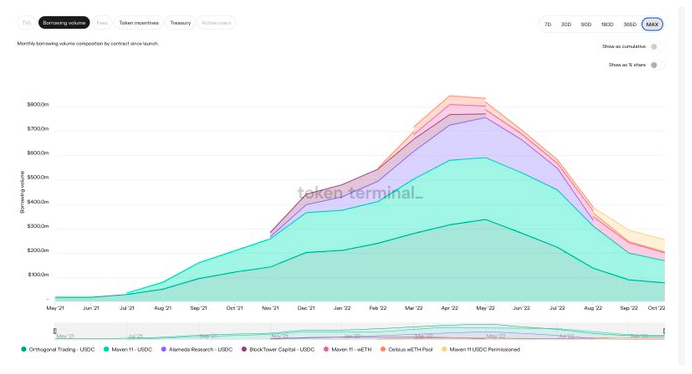
Borrowing demand has increased from about 30 billion to 13 billion - it's safe to say that yield + platform fees have been in secular decline. I did find it interesting, though, that for the past few months, this price has had an upfront fee.
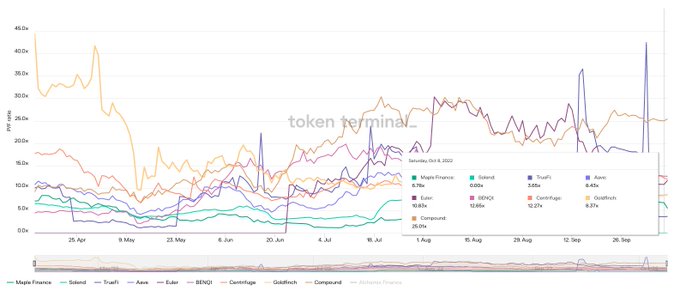
Players like Maple and Goldfinch are still at tradfi bank multiples in terms of price/expense ratios. Obviously, players like aave and Compound have a premium associated with them - but the price is more or less in sync with expected fees.
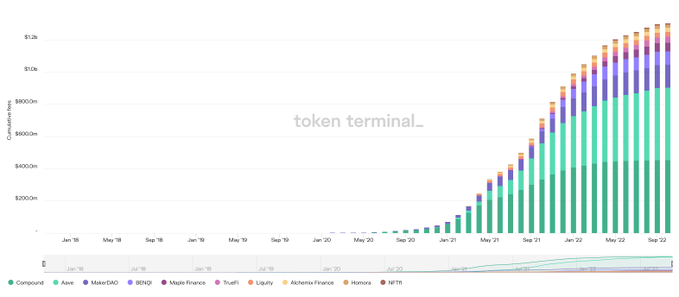
Lending apps alone have generated $1.2 billion in fees over the past two years -- and that's a cumulative graph, so forgive the crime graph. We are still descending.
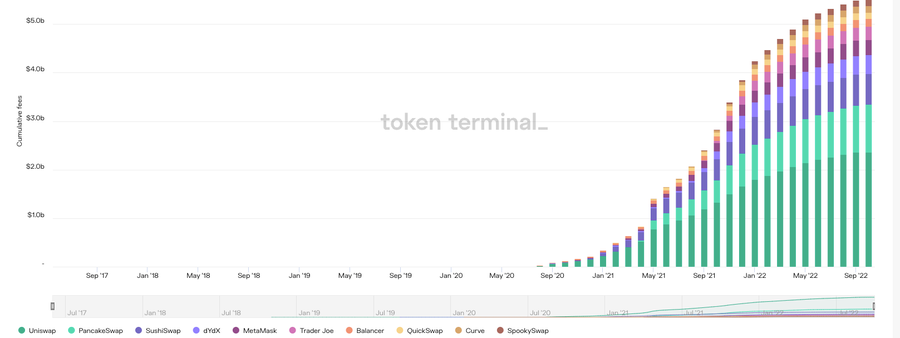
Again - exchanges have collected ~$5B in fees over the last 2 years Fees here are likely a mix of platform revenue + token incentives - so in the future, we may see a bit of stagnation here unless there is a massive increase in platform activity .
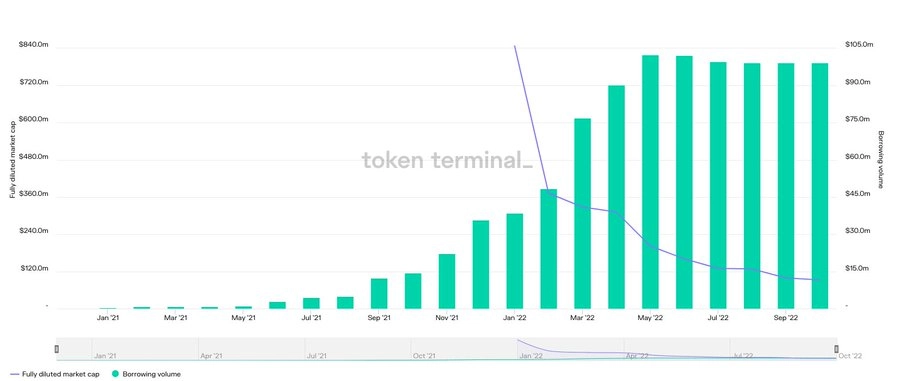
Despite poor market conditions, some markets are still growing. Take GoldFinch for example - their borrowing volumes have remained strong despite the downward trend.
Maple Finance's loan desk collected $40 million in fees last year. Once upon a time, cefi lending channels have struggled to maintain relevance and customer base.
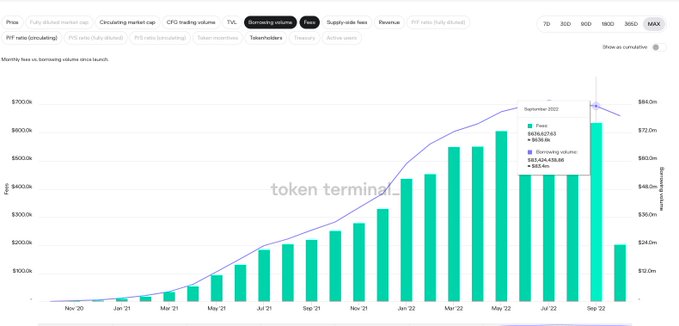
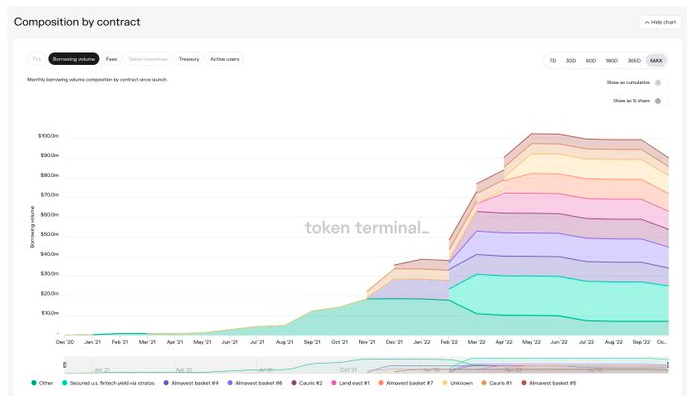
In fact, mortgage underlending may be one of the healthiest sectors in this market cycle. The graph below is for Centrifuge - their fees and borrow volume are ATH.
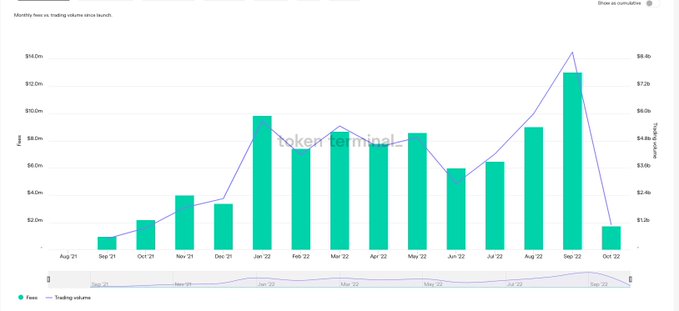
GMX (comparable to dydx) has a similar trend. Last month, the exchange traded around 8.6 billion, which is a new ATH. Expenses for the month exceeded $13 million. It’s safe to say that the DeFi segment is still healthy and strong.
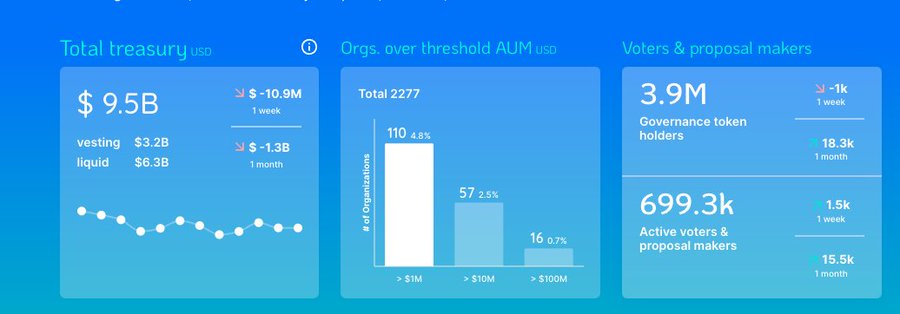
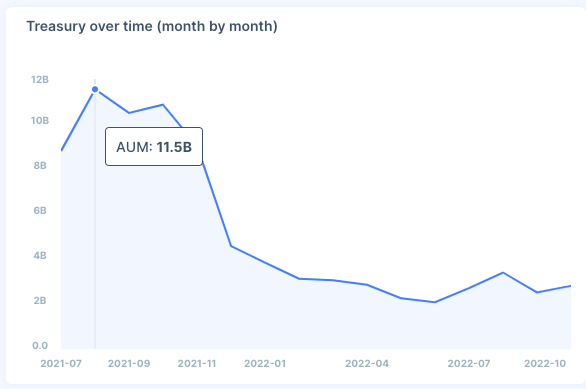
Okay - about DAOs DAOs on Ethereum alone processed about $9 billion, down from $12 billion a year ago. Diagram below - via @DeepDAO_io. There are 16 DAOs managing over $100 million in funds. Some 700,000 of the 4 million DAO-related token holders have voted so far.
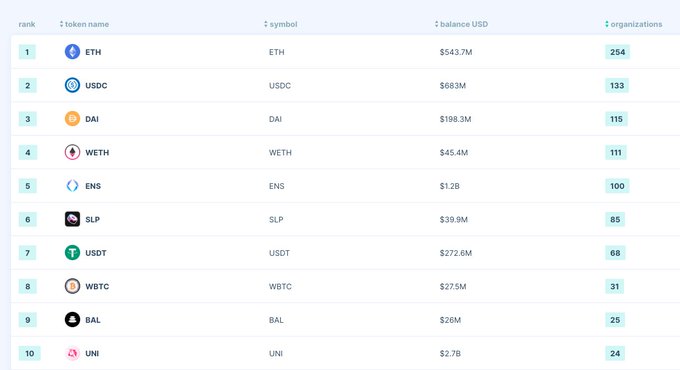
In terms of DAOs holding them, ETH remains the most popular asset, followed by USDC. 254 DAOs in ETH hold approximately $543 million. For USDC - it is $683 million, almost double that of DAI.
Uniswap's vaults handled about $12 billion at its peak. Over the past six months, it has approached $2 billion. Even today, most of them are held at UNI. Of the 350,000 DAO token holders - 47,200 voted in the last month (slightly more than ~1.5% of active voters).
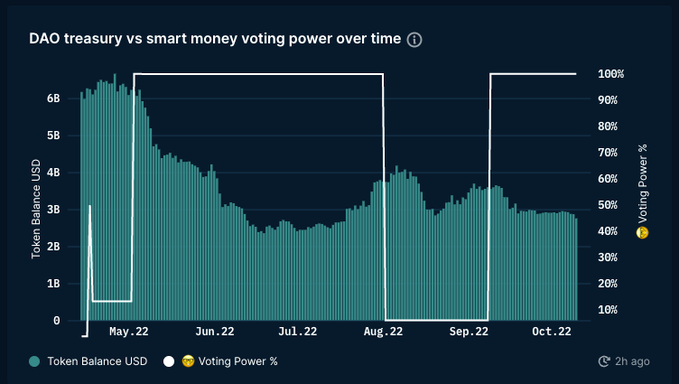
Similarly, BitDAO's funding has shrunk from 6 billion to about 2.7 billion in the past six months. Of the 20k DAO token holders, only 40 voted in the last month.
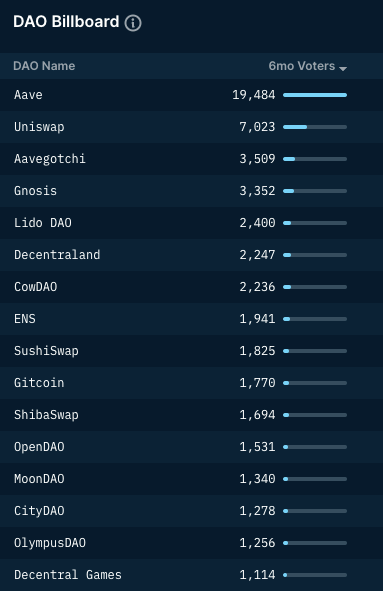
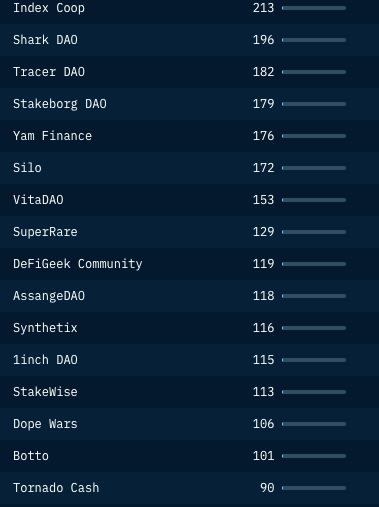
Only 1 DAO has more than 10,000 voters in the past six months. While governance - interesting as a concept, DAOs aren't as involved as you might think. Tornado cash has 90 DAO voters in 6 months.
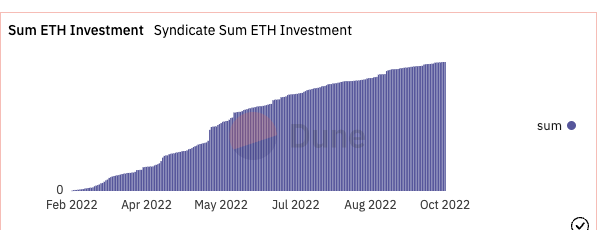
That's not to say DAOs are dying as a concept. Players like @SyndicateDAO continue to make it easier for individuals to build DAOs According to the dashboard on Dune (user: gm365) - around 3800 ETH deployed through Syndicate's 6.7k club so far.
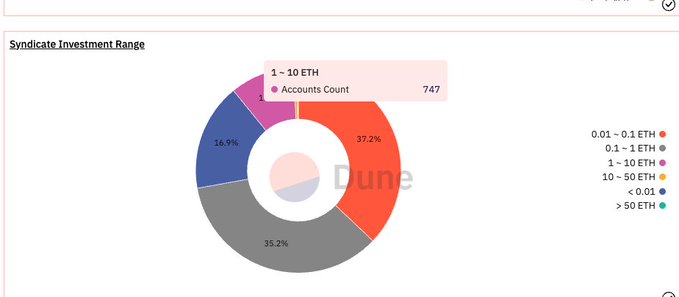
If you thought the DAO was all about whales - consider that value investing under 1 ETH accounts for about 70% of investors entering through Syndicate DAO today. These platforms are critical infrastructure for the “democratization” of capital-oriented collaboration.
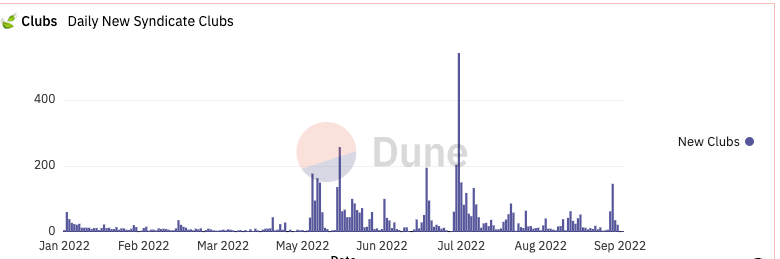
One measure of DAO interest is the number of newly launched "investment clubs." Syndicate DAO went on to help launch more than 100 DAOs at a single-day peak in September. With the return of retail interest, we'll probably see around 1,000+ clubs in a single day.
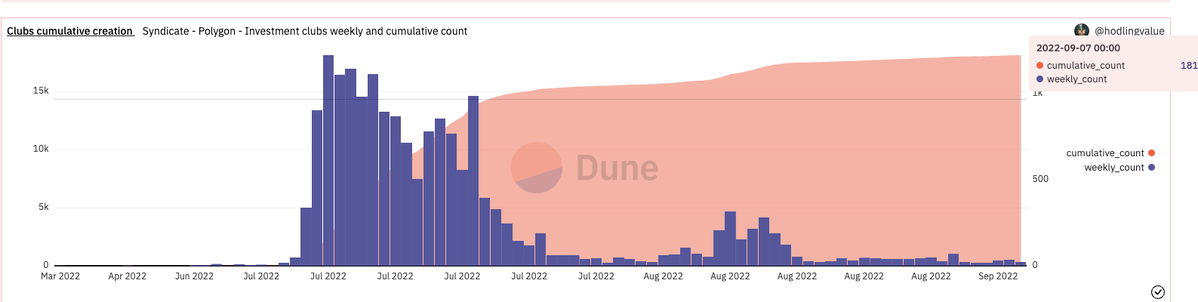
I also believe in cost reduction - by using players like Polygon will speed up the formation of DAOs. For context - Syndicate has triple the cumulative DAO of products on Polygon (18,600 club).
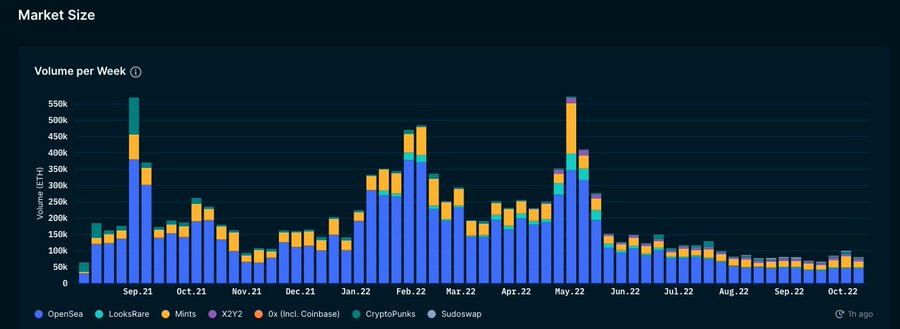
Now - about NFTs. There's been a lot of talk about the massive drop in volume around them this year. People ignore two things 1. NFT price falls relatively (if tx amount stays the same, it will lead to less transaction volume) 2. Risk appetite declines.
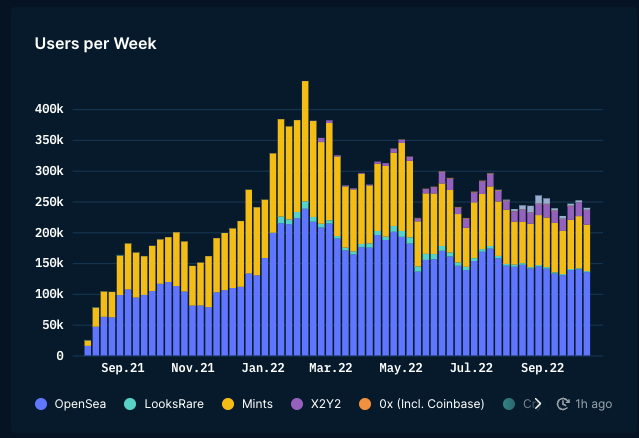
If you look at the market from an active user standpoint - the decline is not as big as you might think. We peaked at about 400,000 - now about 275,000 weekly active users A fair criticism is how small the market is.
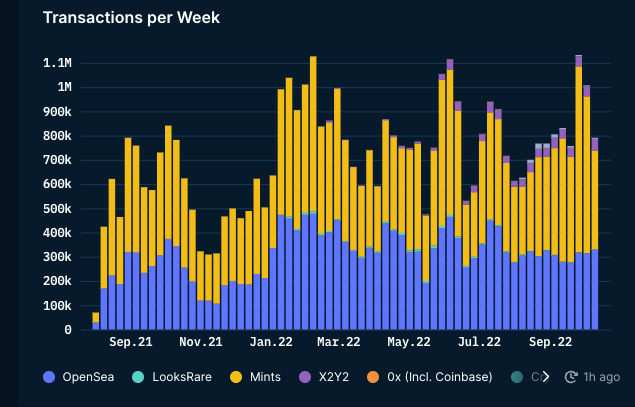
On average, these users conduct transactions on-chain (on ETH) twice a week. So it's safe to say the remaining user base is highly sticky and active. Also - contrary to what has been said repeatedly - deal activity has not declined.
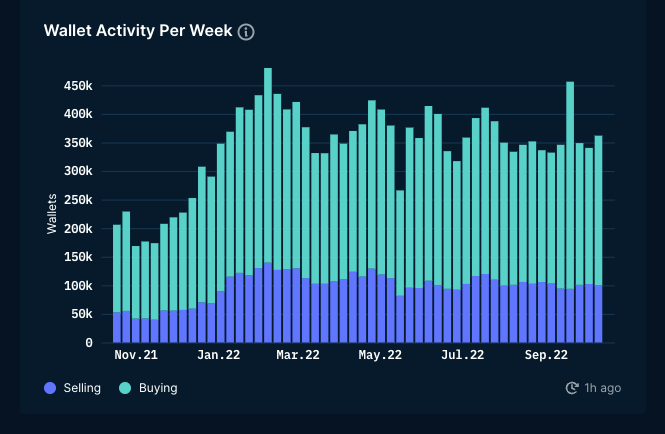
These users may be eager to sell and exit? Not real. The bulk of those wallets continue to buy -- at about the same frequency as they did at the beginning of the year. Compared to last year - we now have more users transacting.
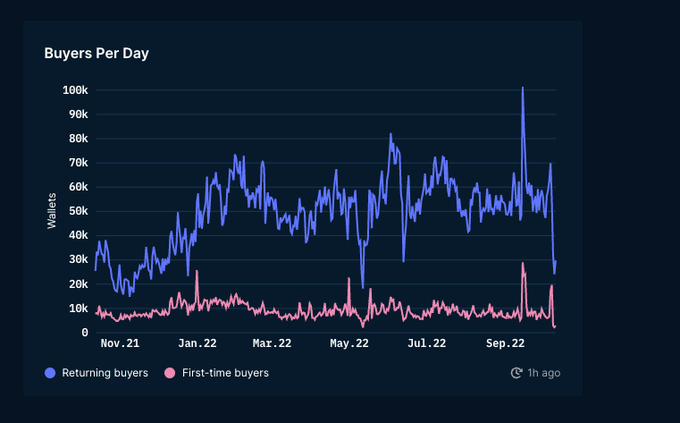
One possible criticism of the data here is that these are just zombie wallets. However, if you look at this graph to explore the nature of wallet returns 1. Yes, there is a flat line for new users 2. There is no drop in existing numbers. - If anything, it hit a new ATH in February.
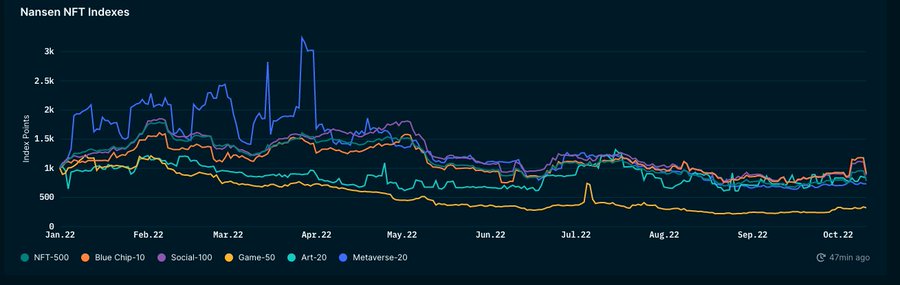
That's not to say NFTs are in good shape. From a price perspective, NFT traders have been hit by (i) falling ETH prices and (ii) lowering the price of NFTs denominated in ETH An index maintained by Nansen shows the state of NFT price prominence over the year.
Some thoughts on what I'm seeing on the index 1. NFTs linked to profile pictures are doing well 2. NFTs related to games are a disaster (atm) 3. NFTs linked to visits are ~7% of market volume.
OK - so prices are down. How much less activity?
This is where the data gets interesting.
Every news outlet loves to take data from November 2021 (the peak) and show how everything has crumbled since then. So here are some scaled down charts.
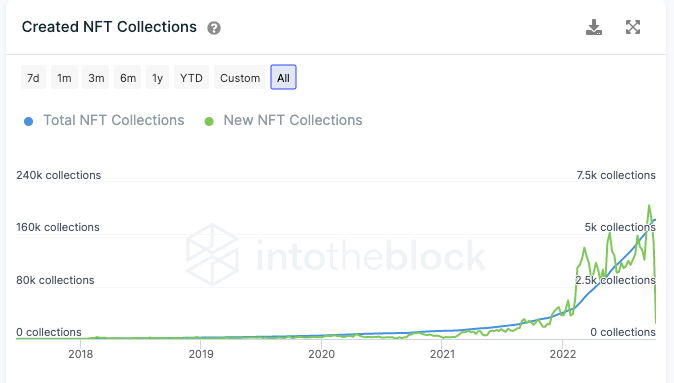
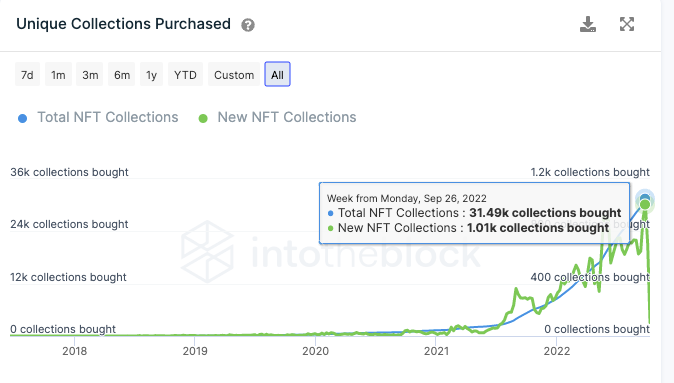
First - create the NFT collection. 2020 - The total collection of NFT is about 5k. Today, we see as many collections of NFTs as possible being released every day.
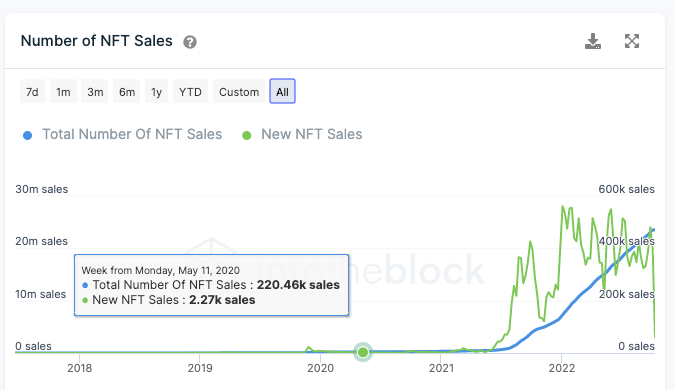
The number of NFT sales has increased roughly 200 times over the same period. From about 2k sales per day in January to 400k today. To date, 23 million NFT sales have occurred.
Sales are mostly concentrated in the top series (BAYC, cryptopunks, etc.) - but that doesn't mean the smaller series don't have sales.
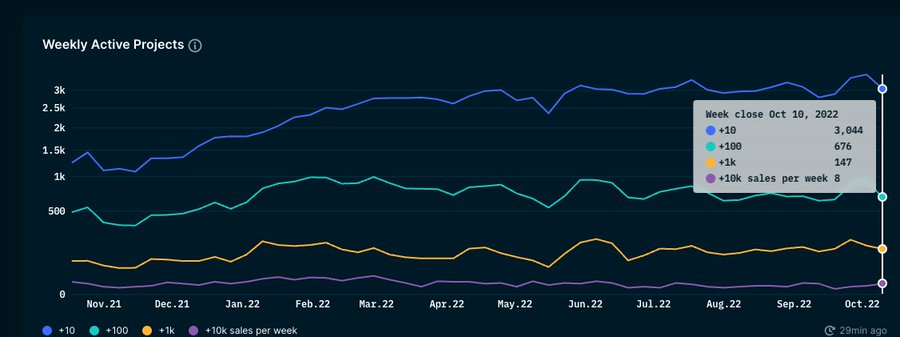
In fact, Nansen shows that smaller projects with fewer sales have been on the rise. number. The collection, which sells only about 10 items a week, has grown from about 1,300 to more than 3,600 since last year.
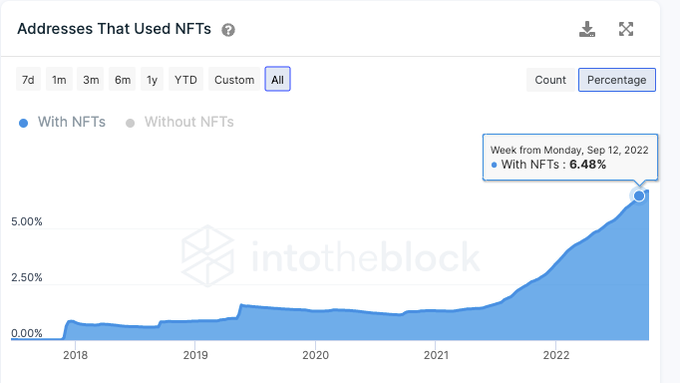
Despite the downward trend in activity, NFT-related wallets now account for around 6% of all active ETH wallets. Whether we like it or not, this is the way retail is going.
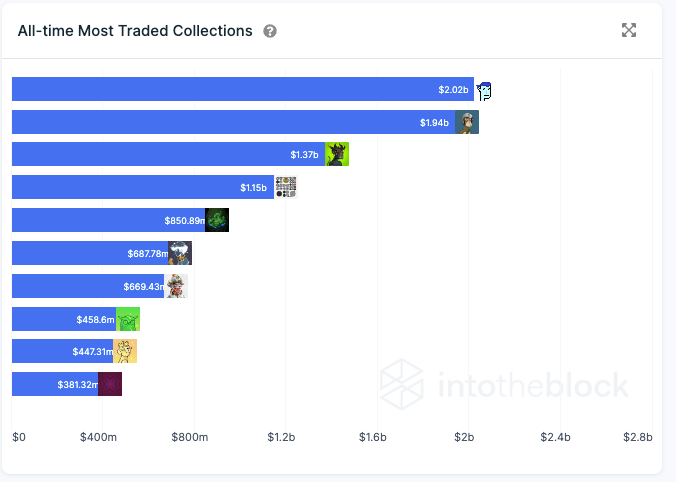
High-priced NFTs have more or less become their own asset class. Bored Apes and Cryptopunks have trading volumes close to $2 billion each.
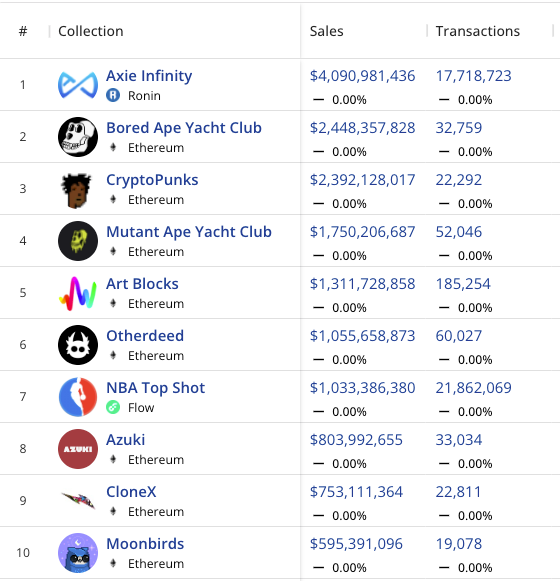
Despite the decline this year, Axie Infinity still leads the pack in terms of NFT sales. To date, Sky Mavis creations have completed approximately 17 million transactions in their individual games. Only beaten by the NBA's No. 1 man in 21 million trades.
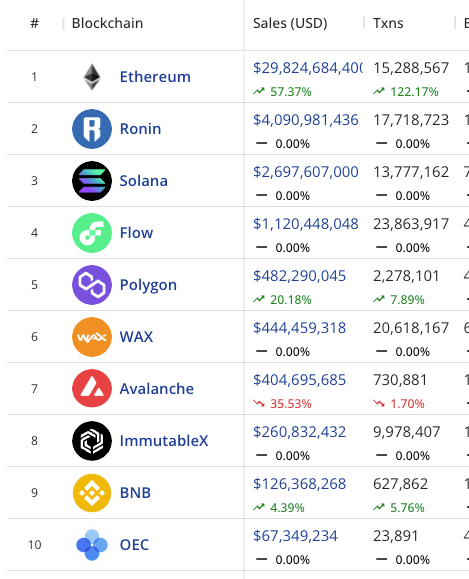
I find it interesting that only two NFTs account for about 20% of Etheruem's trading volume (Punk and BAYC). Low-cost chains like Solana, Polygon and Avalanche are catching up -- but it may take another cycle for them to scale.
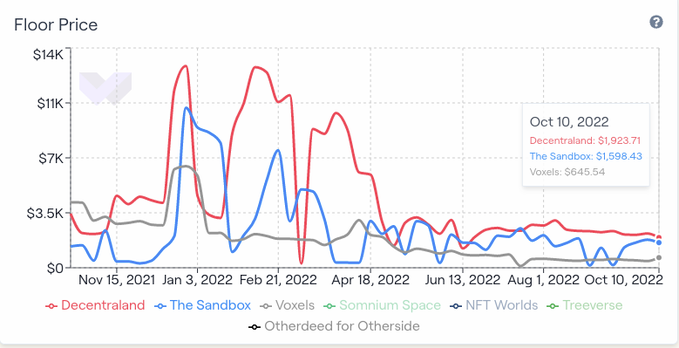
One area of breakdown is the cost of land in virtual worlds. Land base prices on both the Sandbox and Decentraland platforms have dropped by about 80%. It's not just land prices that are falling.
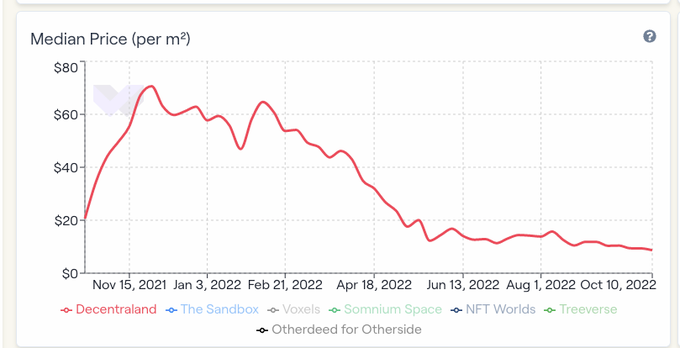
The overall demand for real estate in virtual worlds may drop significantly. The median price per square meter of land on Decentaland has dropped from $70 to about $12 - (, which correlates to the drop in btc and eth prices)
![]()
What worries me (and this statistic may be wrong) is that in the two largest virtual world land projects, only about 100 people bought "virtual world real estate" in a single day. There are more VCs investing in Metaverse projects than users.
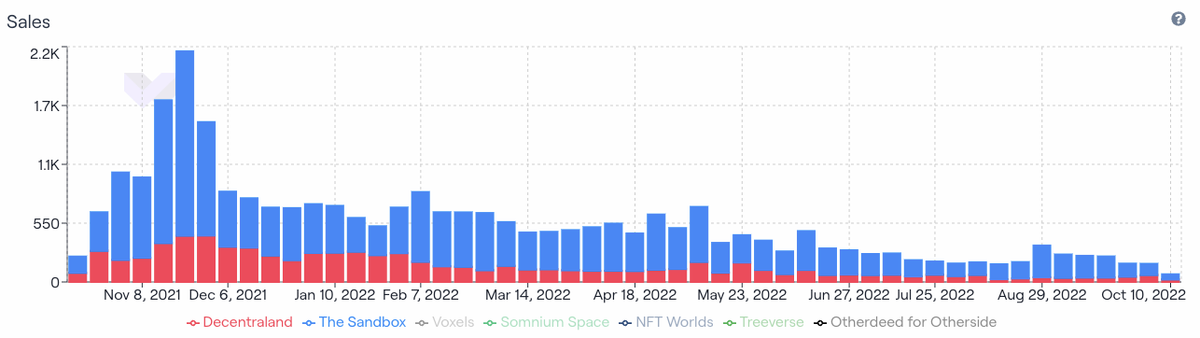
The number of plots for sale is also down. Signs of reduced mobility for existing landowners in these virtual world projects. In the first week of December, Decentraland and Sandbox saw about 2,200 sales. Now that number has dropped to several hundred/week.
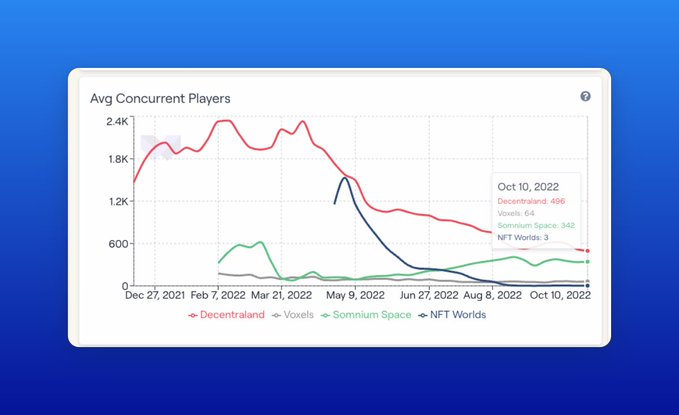
While we bash Meta and fortnite for how "bad" Metaverse is - it's worth considering that some of the most notable Metaverses we have have average concurrent user bases of around 2000 users. We need a better bridge...to the Metaverse.
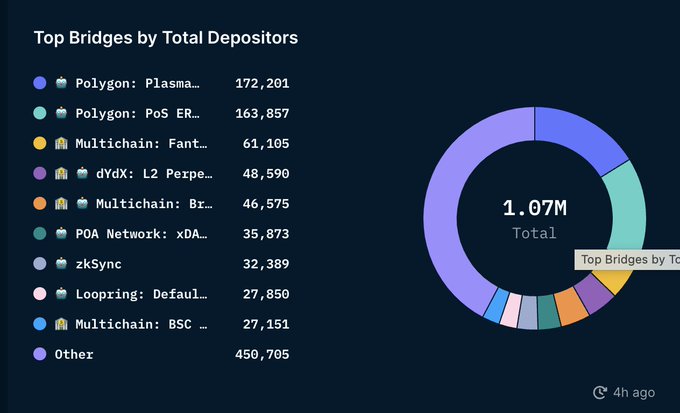
Speaking of bridges... over 1 million wallets now interact with some form of bridge. Conservative estimate - this is 10% of all wallets interacting with DeFi. Still in its early stages, but growing fast.
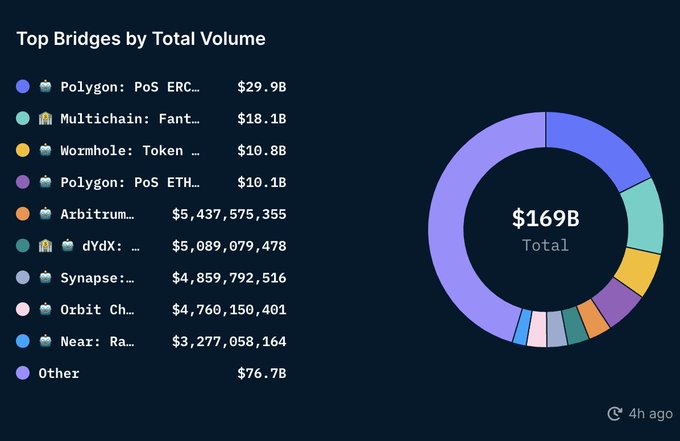
Polygon's bridges alone manage an inflow of approximately $29 billion. It's also impressive to see multiple non-chain-specific bridges surpassing $1 billion in transaction volume. Aggregators may contribute to this digital scaling.
Overall, though, the TVL of bridges has declined—from more than 50 billion to about 15 billion today. This could be in sync with falling asset prices, fears of hacking, and lack of token incentives.
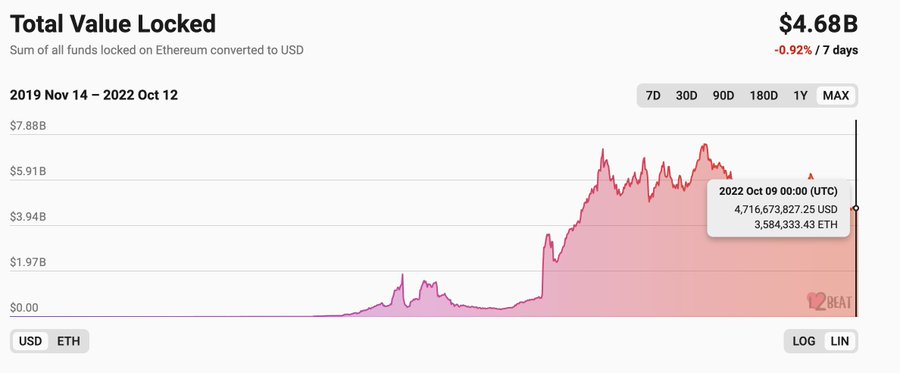
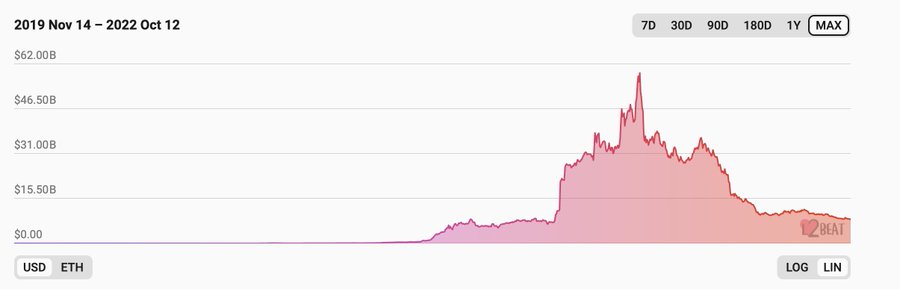
In the case of Tier 2, the situation is completely different. Despite the pain of the past six months, their TVL has only increased from about 7.5 billion to 4.7 billion. Part of what may be fueling this is the anticipated airdrop.
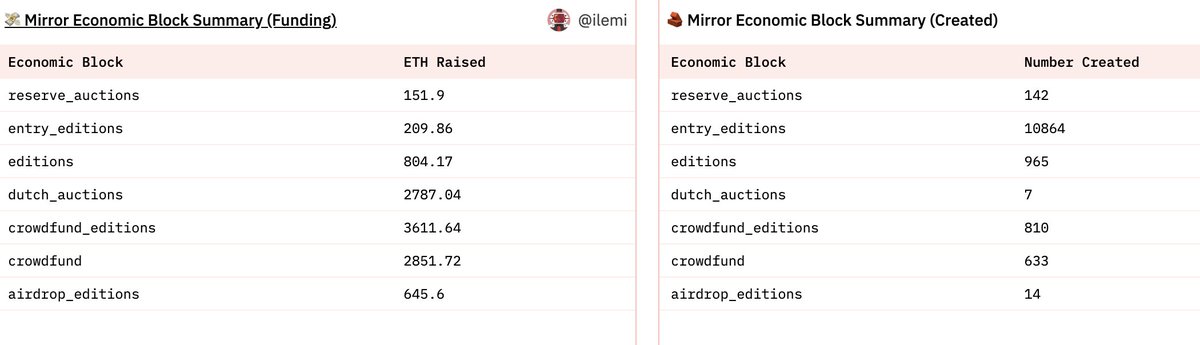
Still, they've been powering a growing number of consumer applications. @viamirror is one of the best examples. The platform has raised nearly 10,000 ETH. It is becoming the platform of choice for creators looking to monetize their work.
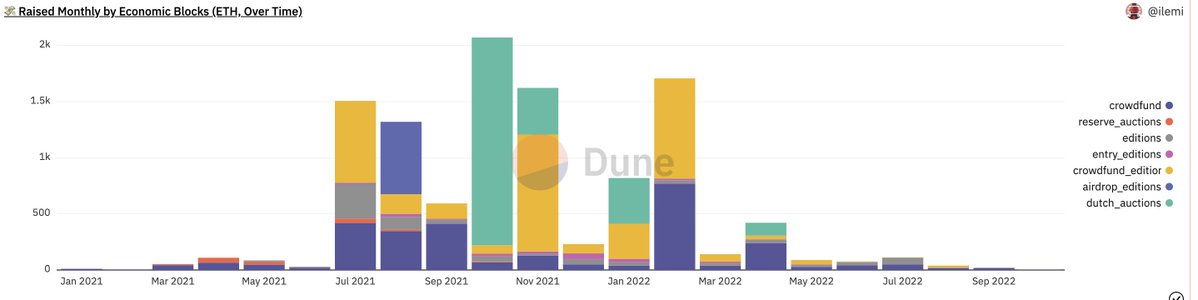
The bear market has affected people's generosity -- net monthly raises have been falling. But it's interesting to notice their growth. One way to think about it is - Mirror may be distributed to creators more times in 1 year than Medium is distributed in 10 years.
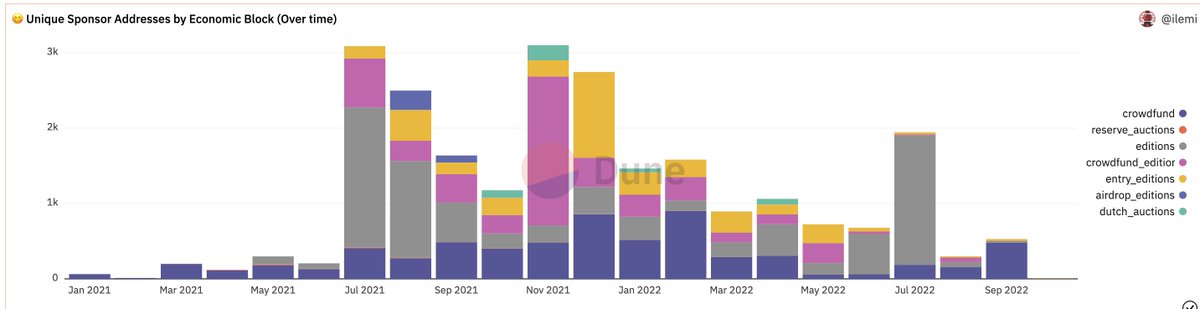
Mirror is still a niche market. At its peak - they had 3000 wallets sponsoring ideas. Now it's down to ~500. But it's safe to say they pioneered a different model with relative success.
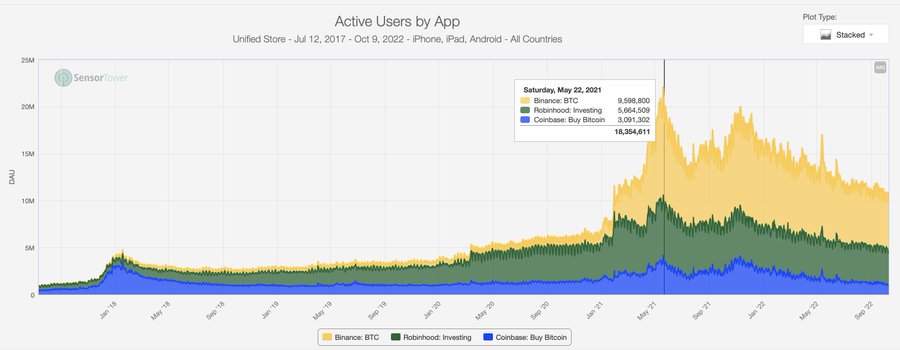
Finally, I summarize some data on mobile apps - and how they compare to traditional variants. The chart below shows the DAU of coinbase, Binance and Robinhood. At its peak, Binance had almost twice as many DAUs as Robinhood (despite being a global app)
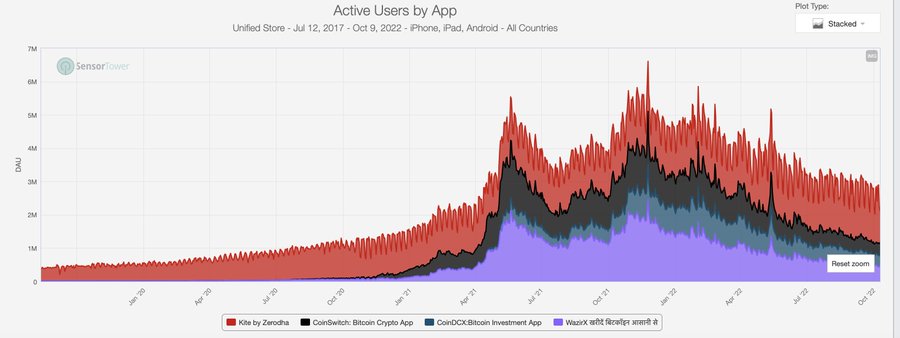
I wonder if this trend will persist in regional markets like India - Zerodha is the #1 stock trading app here. You can see how interest in crypto slowly creeps in to the point where crypto apps have more DAU than established players.
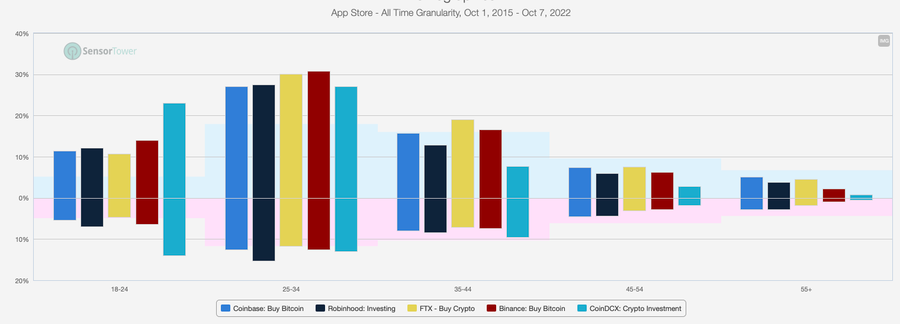
The demographics of these apps are broadly similar. The largest user base for these digital investing apps is almost always 25-34 years old. Coinbase has a very large gen-z user base. (top = male user group, bottom = female user group)
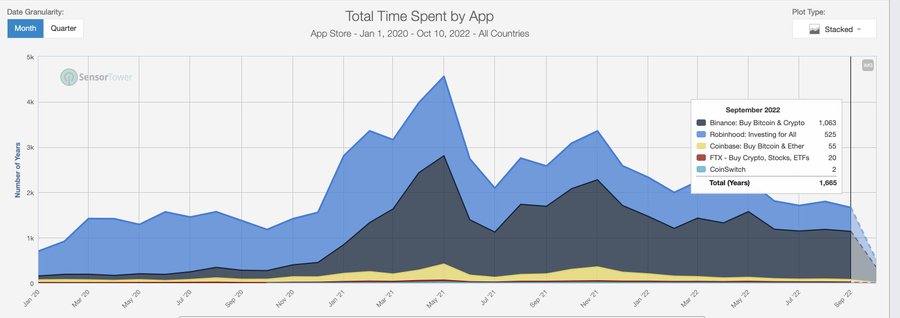
The price drop hasn't really translated into a big drop in the time spent on these apps. At its peak — Binance spent close to 1800 hours per month on the app. That number has now dropped to about 1063. People still love tokens.
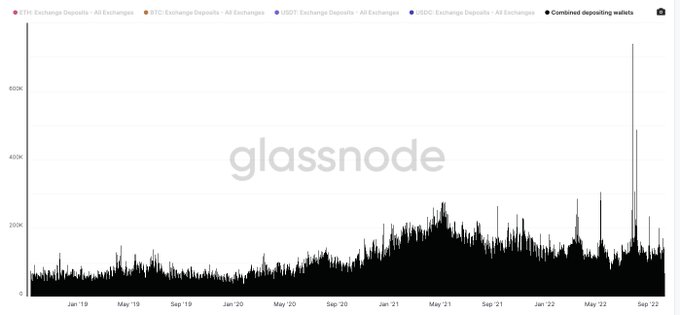
Ending with this chart - it shows the cumulative exchange of usdt, usdc, eth and btc into wallets. In 2019 - it's trending around 60k on a given day. Today, that number is closer to 180k. I use this metric as a rough gauge of market growth.
overview
overview
yes the numbers are down
However, many aspects have increased by 10-50 times compared with the previous cycle
Journalists need to stop taking charts for measurements from the last top, zooming out
Original link