
Re-examining the continuous token model: "to Rug" or "Not to Rug"?
Original author: jb0x
Original translation: Tia
This article contains valuable insights, especially for anarcho-capitalist idealists, those who use macroeconomics to design protocols, or those who use wallet voting to ease the grip of institutional capitalism on our beloved internet. those people. To give you an idea of what you are doing now:
Continuous Token Model Bonding Curves: A Revisited Price Stabilization Mechanism
image description

Post-production from [redacted]
I write for the masses, to find collaborators, to reach beyond the embryonic petri dish and into the depths of the web. So this article will not be written like a traditional article. It's for reading, even for entertainment. Because God knows, if there's no one to read what's here, I can't find the love in my heart to finish it. I wish this was more presentational, intertwined with some spam (maybe overkill), but could bring some life to depressing science.
Naturally, this relaxed form tends to be longer than academic prose text. So I've marked a small path that cuts down some parts you don't think are necessary. There are bound to be mistakes. If there is a place that can help explain, please contact me.
Market Dynamics
price instability
Token issuance is now associated with price stability. The team tends to manifest value in the existing tokens issued in thin air, and deposits bits and pieces of dreams in electronic sheep without any support. The most popular strategy is that the team uses token issuance to start the community and incentivize the creation of liquidity pools, all around a token. It is common for token launch programs to double the liquid supply over the course of a few months to the benefit of holders and stakers. However, if there is not a large enough supply to offset these releases, the growth in token supply will exceed the growth in protocol utility (demand).
The end result is the depreciation of the currency.
The trend during the crypto bull market has become clear: retail investors. Don't do the math, at least not too far from the yield mining APR table. Those who do are the minority, but even with a math pill embedded in projects, boom times rarely consider "fundamentals". The prevailing strategy is just this: don the WAGMI flag on the upside of a bull market.
However, some categories of tokens require more attention than others, especially under the DeFi umbrella. In particular, for a permissionless stablecoin protocol, the mechanism design for anchoring token prices under floating demand needs to be more complicated. Protocol investors should have a strong grasp of token economics before taking the leap. Protocol designers should be even more so.
But obviously, that's not the case.
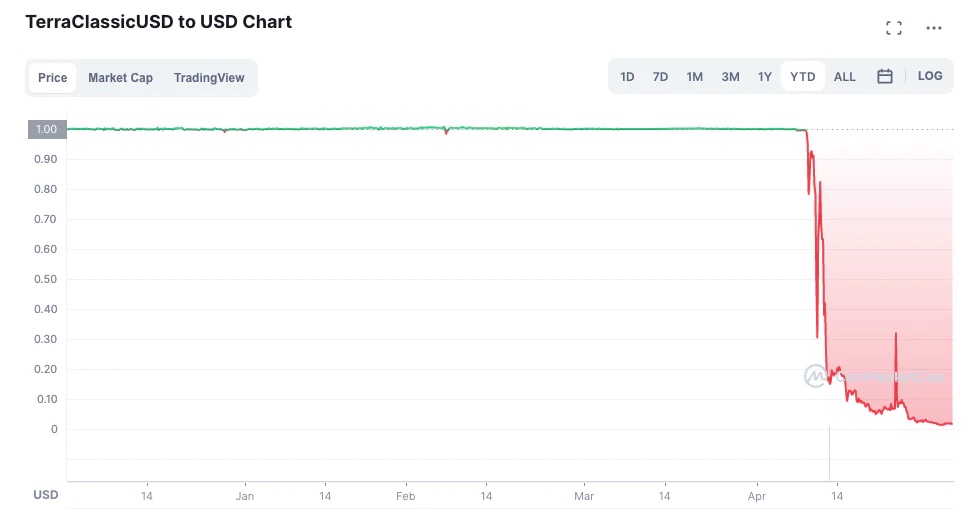
Given that Terra-centric products have generated about$40 billionimage description
LFG's only reliable peg is investors
Here we see one of our supposedly seasoned founders reconciling the collective bank account. What does this say to the rest of us? We mechanically fail, and so do founders and investors. The result is widespread short-term mispricing of speculative assets, with historical prices becoming a meme in itself. While meme investing can mint millionaires to beat the printers, they blow themselves up when the music stops. The market dynamics of a bear market knocked everything back into place, casting one financial tragedy after another.
bear market behavior
Skip this section if you are familiar with current macroeconomics
We live in very interesting times. look around. Technology is advancing at breakneck speed: genomics, energy production, natural language models, text to generative art, satellite imagery, financial markets independent of centralized authorities. But at the same time: a widening domestic wealth gap, the end of the long-term debt cycle, an impending global recession, supply chain shortages, potential stagflation, and the end of the era of globalization. And most importantly, the global military pillar threat of reintroducing nuclear weapons tactics on the battlefield.
image description
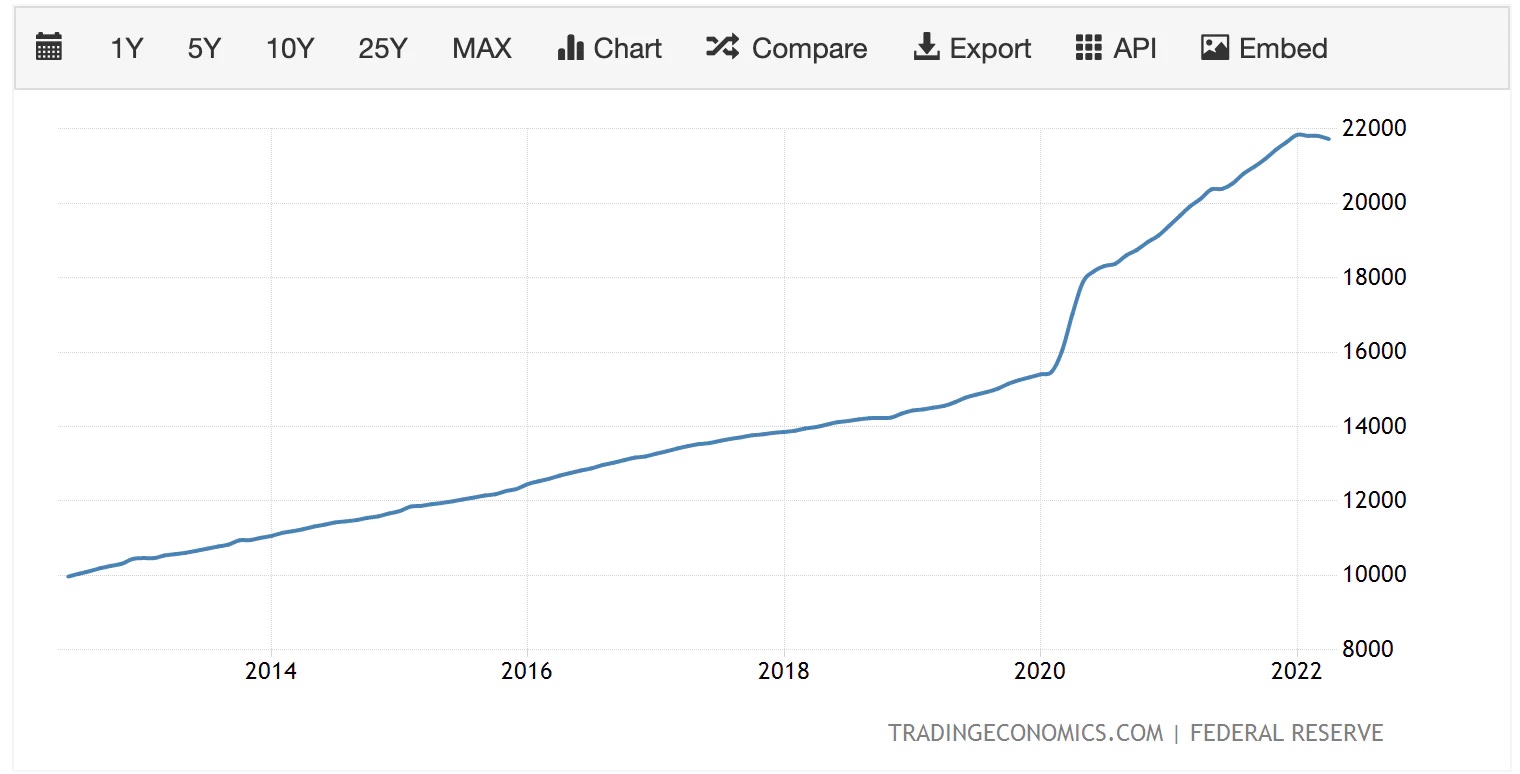
US 10-Year M2 Money Supply
Huge amounts of money poured into this giant securities market in the form of quantitative easing (ie, the Fed's buying spree). Going back to the beginning of the pandemic, the federal government poured $700 billion into treasury and real estate securities, or $120 billion a month, leaving its balance sheet nearly $5 trillion higher at the start of the year than it started. These markets, the beloved playground of hedge funds with guaranteed annualized returns, once artificially inflated, will squeeze investors out of prices, because in this market they will no longer be able to deliver the "promised returns" guaranteed to their clients.
You can extrapolate this effect like a fat person staring into a hot tub. He sat wobbly, raising the water level around him. Then he sank deeper and the water began to fall to one side. Water (money) needs to find a new home. It then leaves for smaller next-door tubs (e.g., the stock market) to find alpha, and even flows to venture capital, private equity, and cryptocurrencies. Pair with fully distributed funds unleashed by COVID and mature financial products around cryptoassets. The result is DeFi Summer. A perfect summer storm with unimaginable rewards, leaving freedom to the fallen few who "profit".
But more recently, financial markets have begun to capitulate as the federal pullback amid persistent inflationary signals. The fat man is on his feet again, and the tide of overflowing funds ebbs and flows into the financial ether. When the fat man started to implement hawkish strategies, raise interest rates, etc., investment firms readjusted their valuation models, pulled back liquid investments, and searched for the new normal under the lower layers of the market to re-enter. During this transition period, entering the chapter of brutal stakeholder mismatch, (3,3) flips to (3,-3).
For some projects, the shift in the market coincided with the expiration of a large number of token supply positions of the team and investors. From a purely financial standpoint, ditching the baggage is their best option. After all, there is no glory in a cemetery. The golden heart has no mortgage value.
Introduction to Stablecoins
Introduction to Stablecoins
If you are familiar with top stablecoin projects, please skip
There is one class of tokens that is completely immune to bear markets: collateralized stablecoins. $USDT, $USDC and $BUSD are the leaders in terms of market capitalization. The first two are collateralized by large traditional obfuscated assets, while the third is directly collateralized by USD. Anchoring the primary reserve currency of traditional finance, they provide a safe haven from native volatility to emerging ecosystems.
image description
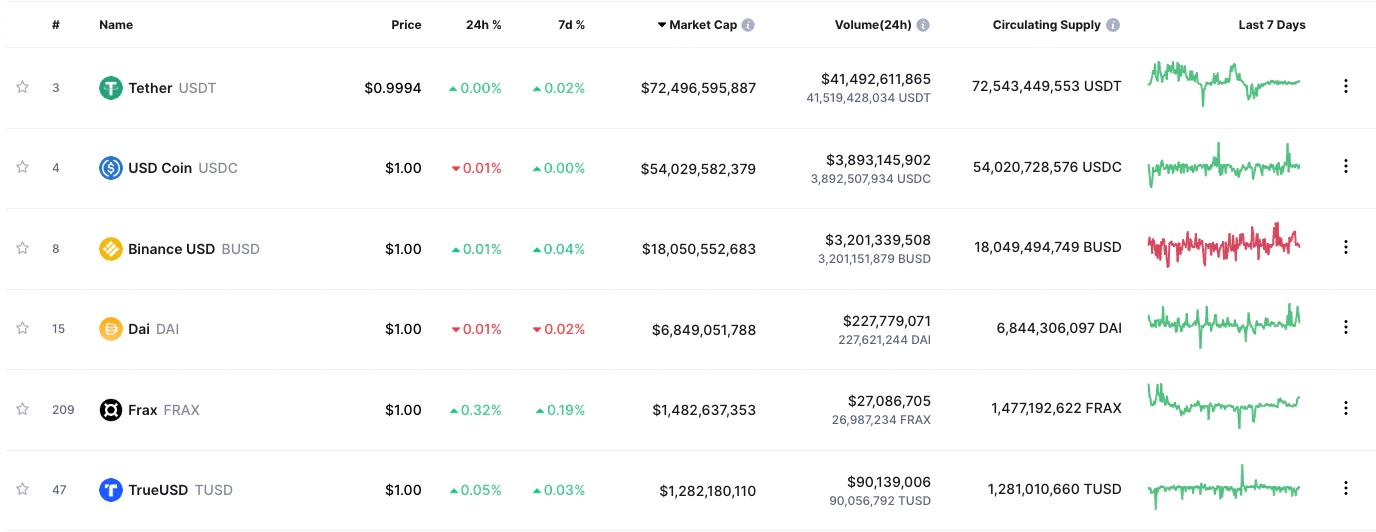
Top stablecoins ranked by market capitalization (coinmarketmap on June 22)
Maker's $DAI is interesting because a large portion of its collateral consists of highly volatile assets on-chain. It maintains solvency through fluctuations in the price of its collateral by requiring borrowers to over-collateralize into the protocol-controlled Maker Vault when minting/borrowing $DAI. So holders of $DAI can rest easy, because even if the value of the collateral shrinks, $DAI will not, because the protocol will automatically liquidate the collateral in the vault to guarantee the repayment. At the time of writing, the protocol holds about 10.6 billion collateral to back the $6.9 billion supply of $DAI, which fluctuates at about 150% at this stage.
And $FRAX is undercollateralized. It achieves better capital efficiency than similar products by means of partial algorithmic stability. The core innovation of the team in the first version is (1) $FRAX’s sliding CR based on the price pressure in the open market (2) Based on the market price of the governance token $FXS, implement incentive swaps for $FRAX and $FXS + $USDC. If this sounds familiar, it's because (2) is similar to the Luna minting mechanism, but with a large amount of $USDC as stable collateral and fewer adrenaline-inducing memes.
Lessons from price control
Skip if you understand the core mechanics of $DAI and $FRAX
image description
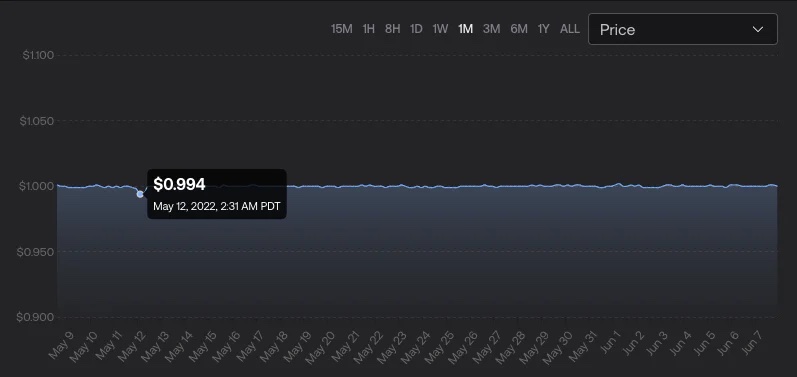
$FRAX, largest price deviation since Luna crash, source: https://app.frax.finance
They are governed by what is loosely described as collateral-based supply control. In the case of $DAI, when the Vault breaches the lower limit of acceptable CR, the borrower's collateral is automatically exchanged for the outstanding balance of $DAI on the open market. The purchased $DAI will be destroyed, reducing the total supply of $DAI, and any remaining collateral will be returned to the borrower in its original form. With sufficient buffer space, the collateral locked in the protocol is always on excellent balance sheet and can be used as a committed supply of required $DAI.
herehereRead, based on price pressures dominating agreement CR and supply. When the demand for $FRAX drops and the price is kept below the anchor, the agreement encourages $USDC + $FXS<=>$FRAX to increase target CR and commit supply. $USDC is derived from the protocol reserve, while $FXS is minted based on market rates.
image description
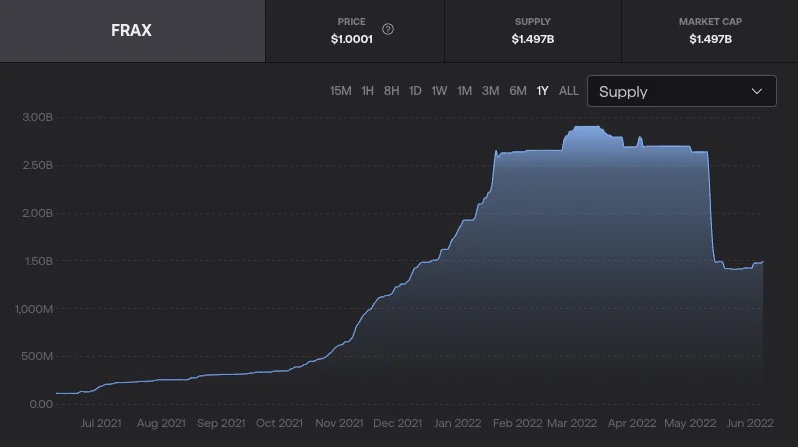
image description
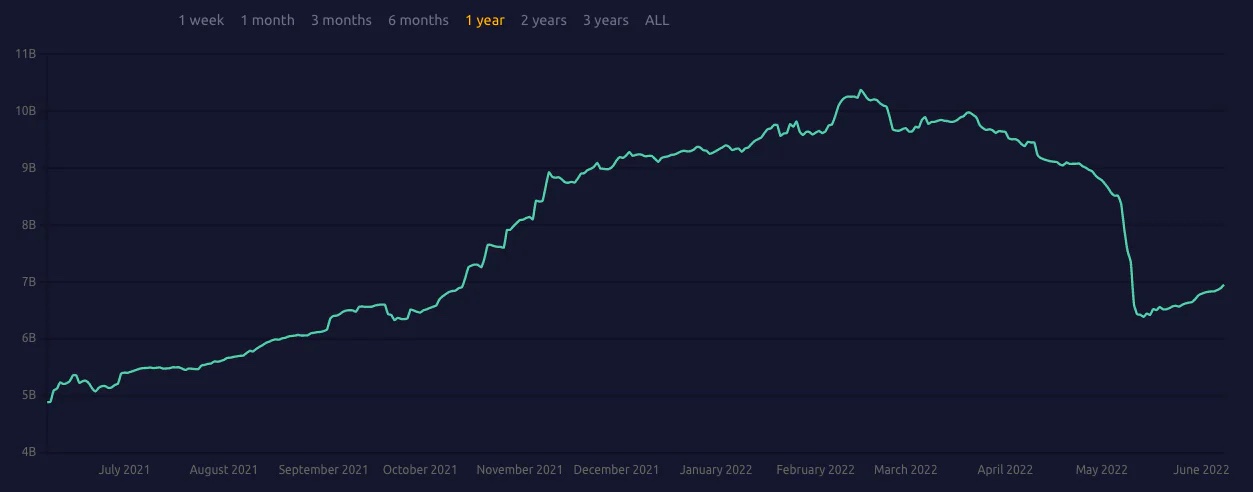
$DAI 1 Year Supply, Source: https://makerburn.com/#/charts/dai
These protocols can maintain the peg through instant supply acceptance of reduced demand. For $DAI, the impact of supply acceptance is even less, because $DAI is over-collateralized, so for a market redemption of $DAI at $1, Vault's balance sheet is always sufficient. However, for our undercollateralized counterparties, supply control is critical. They are used to balance the current supply of $FRAX with its market demand and maintain a pegged price.
Compare this to other classes of tokens that have dropped 80-95% from their peaks during this market cycle. Of course, for many of these tokens, price stability is not paramount, and operating with near-full collateral like a stablecoin project can hinder a team's ability to scale their network quickly. Having said that, a 90% drawdown of the protocol’s primary financial instrument would be a good thing for its community under any distorted narrative. But on the contrary, our bag holders now self-identify as down/very bad.
If collateral-based supply controls can enable a protocol to maintain its token within 0.5% of its price target during a major market crash, it's not hard to imagine one could use the same tools to design mechanisms that meet more relaxed stability requirements .
Let's explore these tradeoffs after a quick look at the author's childhood.
inspired mechanism
Drug market in Neochibis (role in shopkeep)
Skip if familiar with the price window (shopkeep = minting/destroying contracts)
There are several ways to enhance an open market economy to increase price stability, and they draw inspiration from the market structures common to gaming economies.
image description
Our local drug dealer (left) and our friend an0n (right)
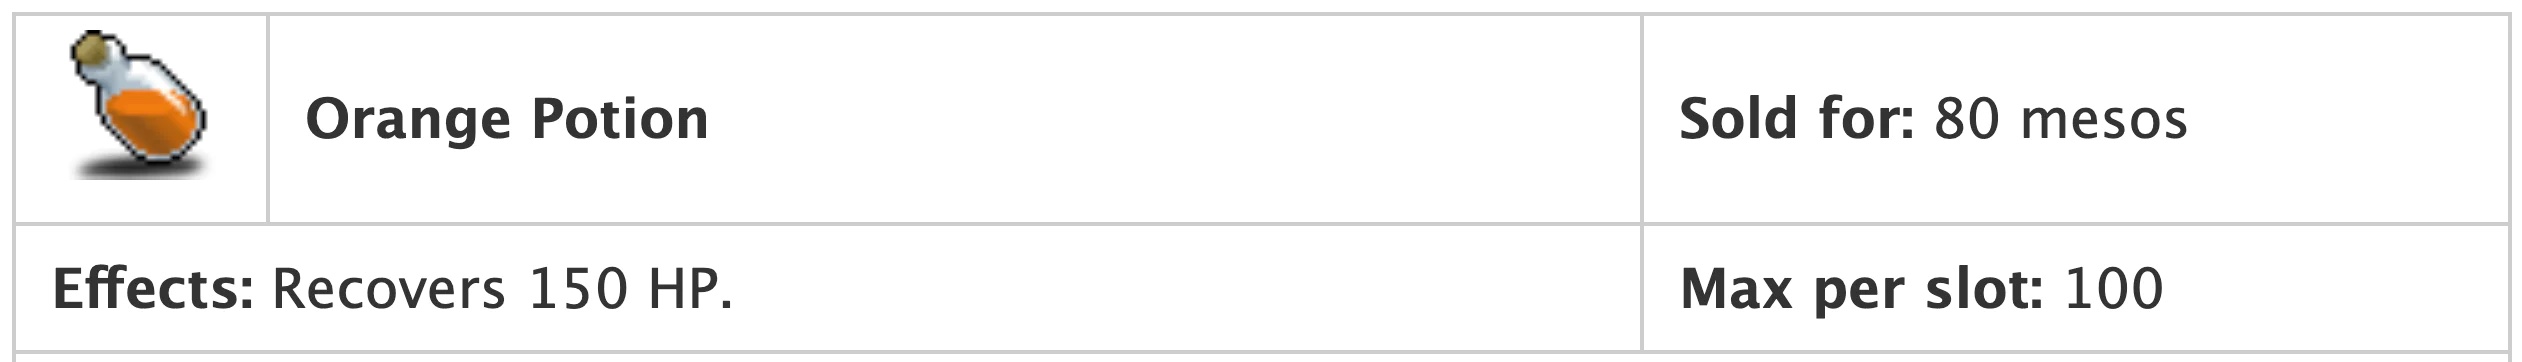
We can imagine the Orange Potion ($OP) in the shop window above circulating in the MapleStory economy. In the absence of a shopkeeper, our players are free to trade $OP with each other at any agreed upon price. The price of $OP can fluctuate, unbounded, up, down, and sideways based on the balance of supply and demand for $OP in the open market. An0n, our savvy Maple investor, started hoarding $OP as the modest increase in new players made her bullish on the expected change in demand for these mid-level potions.
But the MMORPG is at the mercy of its publisher, and Nexon (Maplestory's publisher) decided to make the game more friendly by drastically increasing the potion drop rate for orange mushrooms, a spawn that's usually hunted at lower levels.
image description

Do you want a $OP an0n? they are cheap
She woke up in a cold sweat, it was just a nightmare.
As she recovered from the shock, An0n remembered that Maplestory employed shopkeepers who always bought $OP from any user for 80 mesos. This 80meso price is what we call the $OP Price Floor: a market structure where a central authority acts as a buyer of last resort, preventing the market price of an asset from falling below a threshold. For example, if the fair market price of $OP drops to 75meso, the player will instead exchange their $OP with the shopkeeper for 80meso. Because why wouldn't they?
image description
You laughed, but I've come across less addictive IRL drugs
Therefore, An0n always guarantees an exit price of 80mesos per $OP. Maybe she should apply for a second mortgage. After all, it was 2007, MapleStory was new, MapleStory was popular, and the influx of new players was inevitable. She checks the price of $OP on her toji terminal. Um. She turns it off and goes back to sleep, why?
Well, $OP is currently trading at 150meso. And, yes, she's taking on a fair amount of downside risk even with a price floor, but if her investment assumptions about maple fever are correct, then that shouldn't be too much of a concern. After all, the world isn't going into financial crisis anytime soon. She expects prices to rise, hopefully moon, as has been the case for her home over the past few years. She is more concerned with price caps. Our shop owner doesn't just buy the OP for $80. They also sell $OP for 160 Mesos, rain or shine, all day, every day. It's business, dee some crooks FR.nd business.
image description
If the price of $OP falls below either limit of the price window, the user will instead trade with our shopkeeper at the bound price
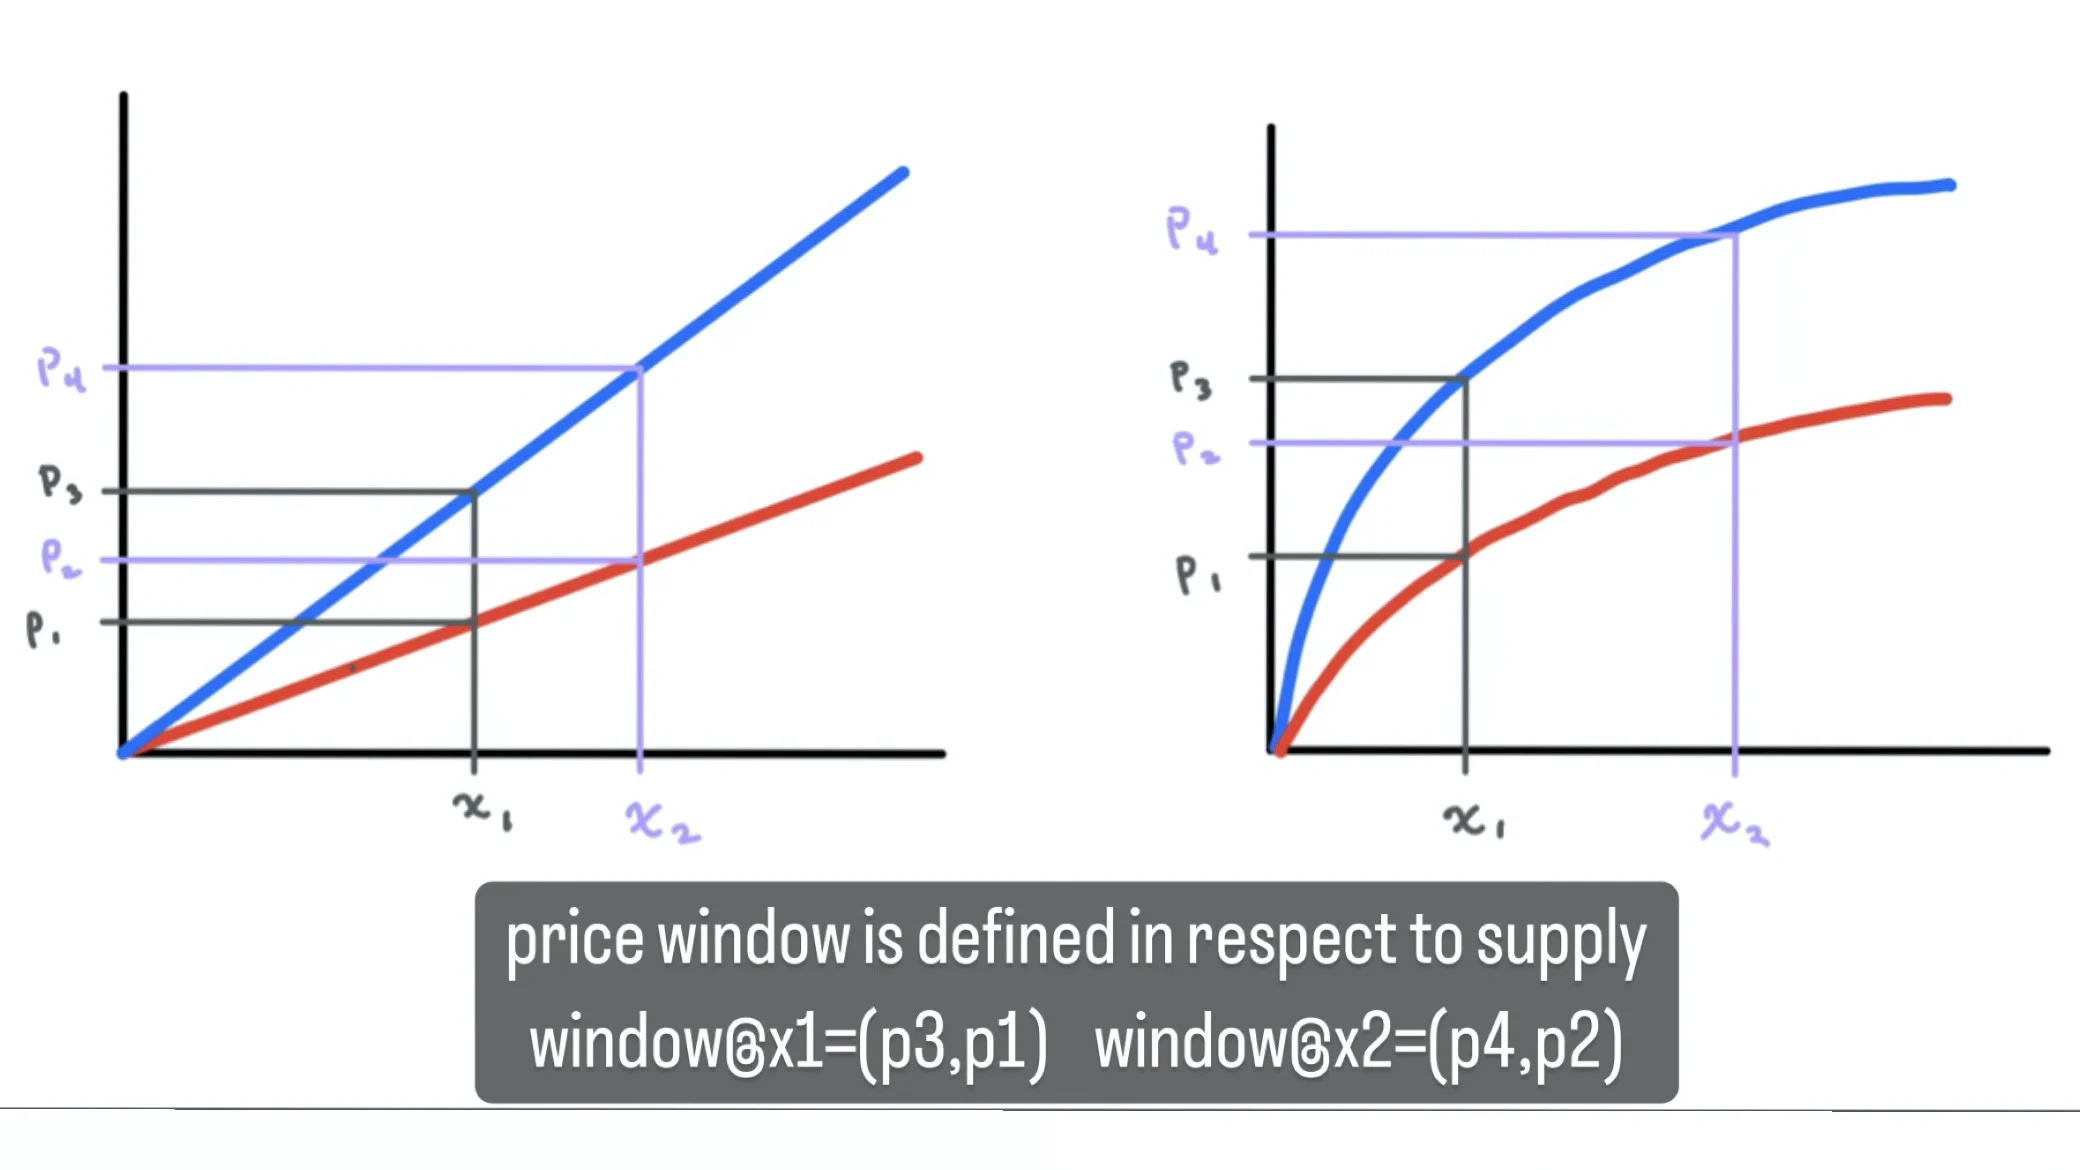
The market structure we see here is called a price window: bounded by a price ceiling and bounded by a price floor. The market price of $OP can fluctuate to any price within this window, but cannot exceed the upper or lower limit set by Nexon Pharma Cartel. For the sake of discussion, we refer to these market structures more broadly as "mechanisms" because of their ease of integration into token models as composable building blocks.
The Continuous Token Model: What, Why & What?
Skip if you are familiar with the continuous token model
During the previous cryptocurrency bull market (c. 2017), several people proposedContinuous Token Modelconcept (CTM). A token issuance method open to the public directly through contracts, infinitely scalable and pegged to a reserve currency (token). This model is largely prosaic as founders prefer to have full control over their supply from the start. The idea of a fixed supply is also more attractive to institutional investors, who push founders to emulate the model proposed by L1 and only describe the unclearDeflationary token model.
But what good is a "supply-constrained" or "deflationary model" when circulating supply is vastly expanded through emissions? Even the price doesn't help. All of this is to disproportionately reward those who join the protocol early, with relatively tight schedules and rates arbitrarily chosen up front by founders who I suppose have limited experience in predicting the future. That's not the kind of hand we want. Inadvertently gatekeeping and severely penalizing mass adopters, more or less by being born a little later (sound familiar?).
Yes, as founders we want to incentivize adoption, we want to reward those who are early. But distributing tokens to wallets just because they own them is not only lazy but also selfish. Suppose you can put "20% of the founding team" into the pitch deck as a virtue signal, and then turn around and get half of the "60% of community tokens" through the emission of token holders. From a distance, the game is almost comical. Up close, it's quite painful.
As such, it is unclear whether this model could surface as a modus operandi of choice for the protocol founders. Only humility can refuse the throne. It is an inhuman discipline to accept blitzscaling at ridiculous amounts of capital before a product launch if such an option exists. understandable. So maybe this synergy of stagflation with our economy is exactly what we need, gradually raising interest rates in a 1970s fashion to get rid of leverage and force institutional investment to dry up in favor of venture capital.
image description
how many times
So what is this alternative? What is a Bonding Curve?
Bonding curves are at the heart of the continuous token model. This is the mapping between input and output. The redline tachometer begs you to shift gears, expanding supply when it's over-exuberant, contracting when the market begs for mercy. The bonding curve acts as a buffer against declines. Is a dampening function for the price movement of shitcoins.
image description

Foundry side linear bonding curves, source: https://thegraph.academy/curators/introduction-to-bonding-curves/
Bonding Curve is the store in your favorite MMORPG, sell the OP for $160 and buy it back for $80. She sets the token’s price window by providing mint and burn prices relative to the reserve token, in this case meso. Only on the chain, the shopkeeper can update the price at his own discretion according to the contract and under the guidance of the invisible hand.
Autonomous pricing based on time of day, market fluctuations and even the token balance in your wallet is possible. Still, the wisest, most efficient, and most elegant way, in the name of the Holy Spirit, is dynamic price stability, and the price should depend on the current supply of minted tokens. We'll explore why later. But given these axes, X and Y, the mission of the bonding curve — its purpose — is to constrain tokens within a price window given the current supply.
technical perspective
Monomial Curves, Shapes, and Uses
Skip if you are familiar with sublinear curves
Consider the monomial function p (x) = x^a as a candidate for the equation; the basis of our CTM bonding curve is the equation that maps token supply to price.
image description
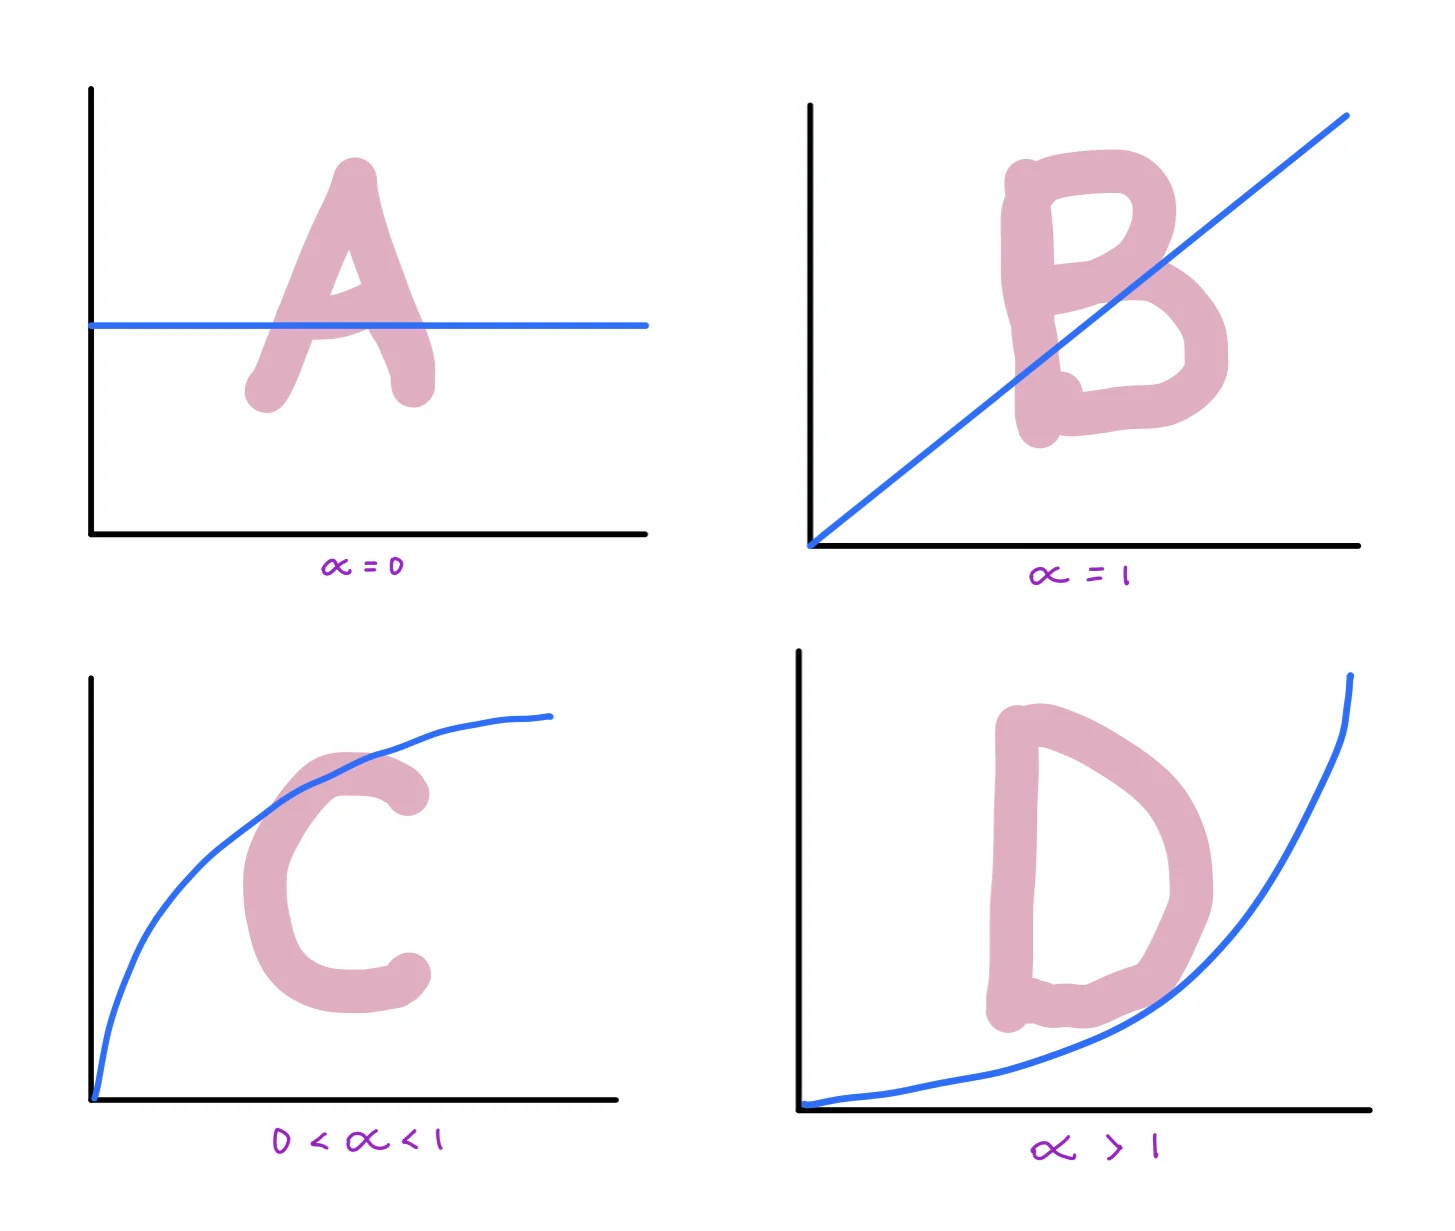
(A) Constant (B) Linear (C) Sublinear (D) Superlinear - featuring some homemade graphs.. Please bear with me
Our CTM bonding curve determines the price window for the tokens that underpin our protocol's entire economy. So, as simple as our expression may be, it says a lot. The nuances matter, and it's worth hearing what each of these shapes have to say about themselves.
Constant: king
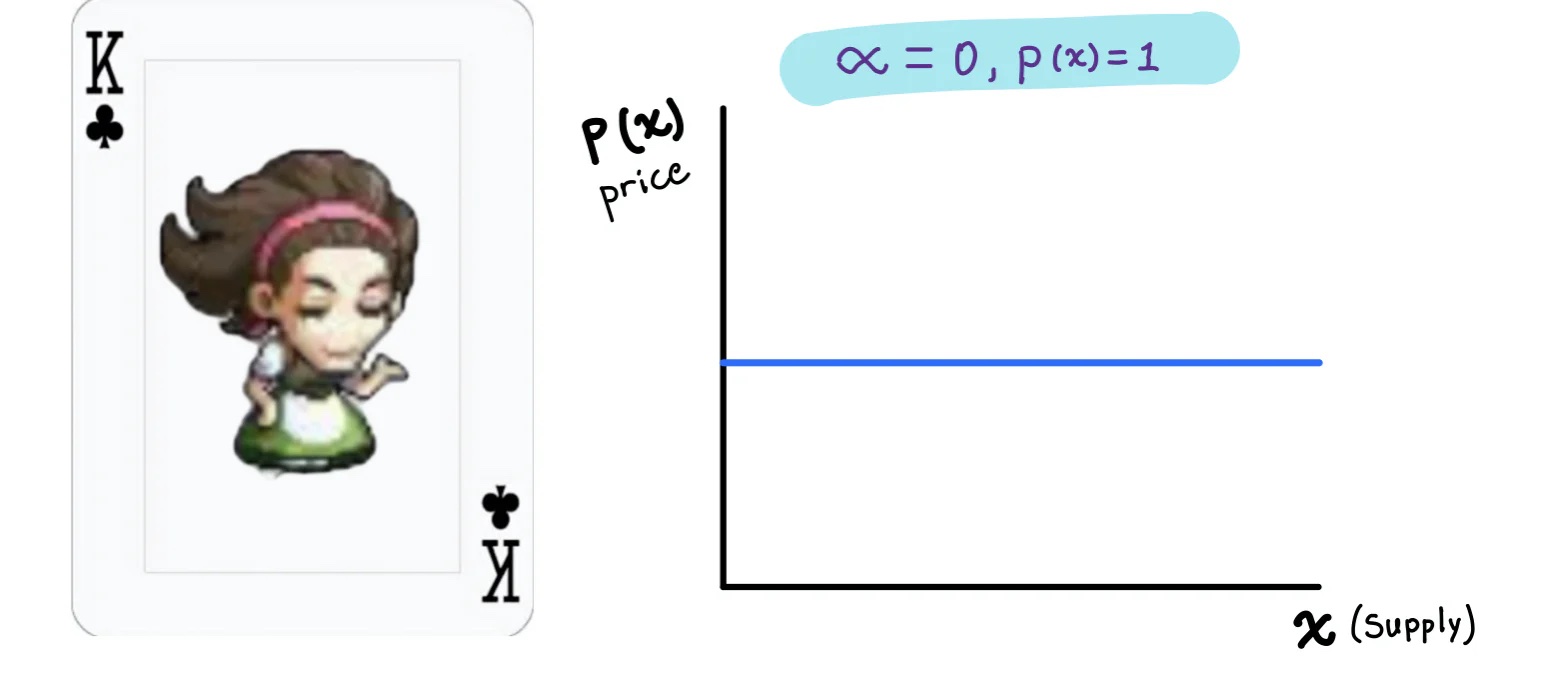
Let's start with a constant curve where a = 0, which simplifies to p(x) = x^0 = 1. Supply is flat. By analogy, the constant curve is our kingly way. By divine right, the king ordered the price of the coin. She is absolute and stands by her decrees. Her exchange rate is the law, no matter how the supply grows or shrinks.
Kings are most commonly seen in video games. Take our Maplestory store as an example. She set the price window at 160/80 and hasn't looked back. Rain or shine, surplus or squeeze, these are her rates. Take it or leave it.
In the real world, kings are rare. King is iconic. How much does a can of Arizona Green Tea cost? How about a Costco hot dog? Do you have to search too? No you don't. Because these are kings, firm and absolute, not like McDonald's 20 McNuggets or the old kings of integrity that the dollar store used to have. ⁷ But kingship in the real world is always temporary. Even the mighty Costco hot dog will eventually succumb to rising prices. After all, these commodities are denominated in inflationary fiat currency. Not that they necessarily "cost" more. It's just... your money will ✨not be worth it✨
On-chain, however, this pattern is much more common. In fact, a major class of tokens tends to be a constant curve as a personality trait, or even a core identity. As mentioned above, stablecoins are a typical example. While nearly all innovations in stablecoin protocols go beyond simple constant curves, at heart they all aspire to a common idea: X dollars in, X dollars out. Rain or shine, surplus or squeeze, those are their rates. Take it or leave it. What we mean by a "peg", simply put, is a very narrow price window that is either codified in law or incentivized by the agreement through various mechanisms.
Linear: Jack
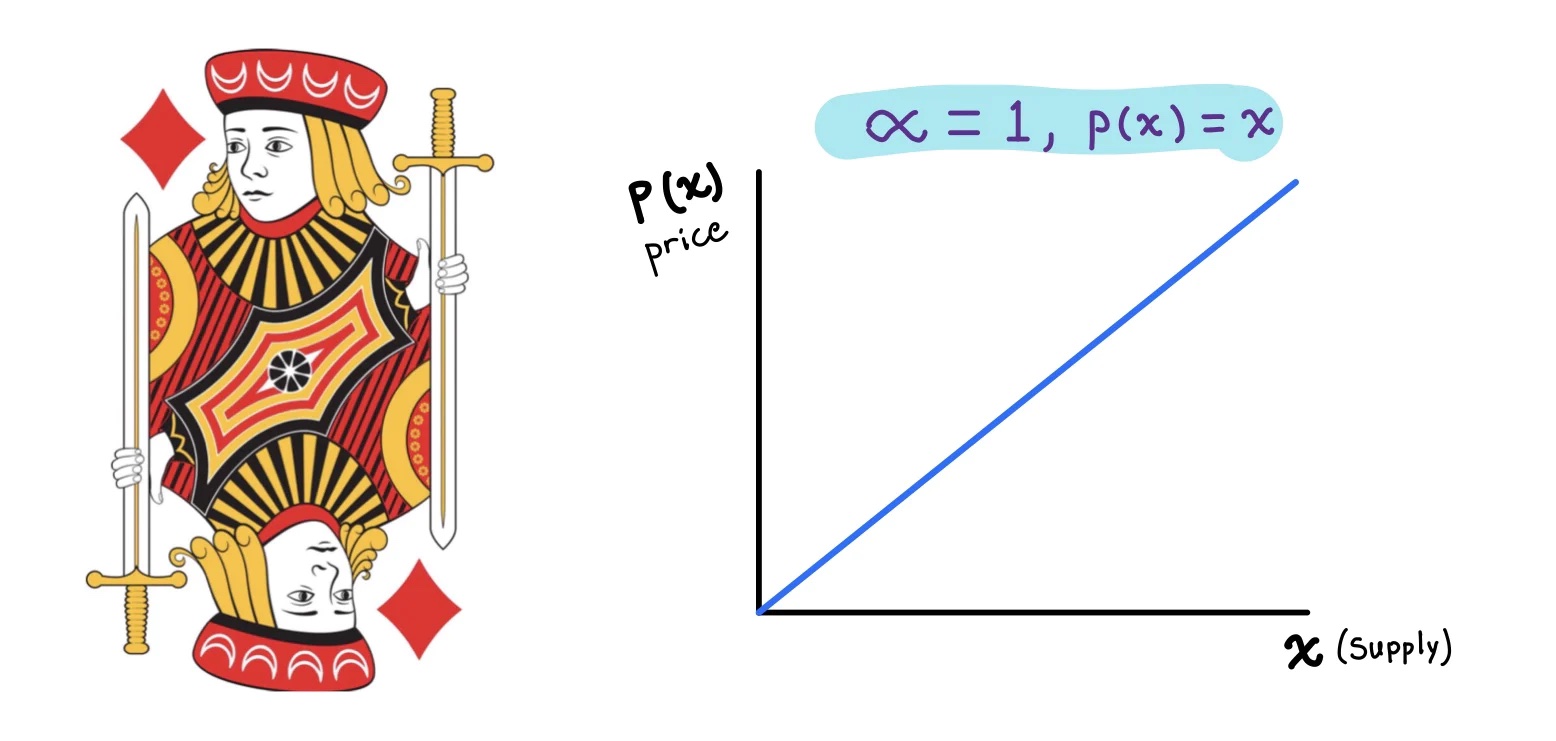
Next comes the linear curve, our Jack, our rascal. Here a=1, p(x) = x. A simple soldier, really. easy to understand. Easy to implement. With Jack, the price rises in tandem with the supply. He cares about whether our early adopters are rewarded for the risks they take. Not much else.
Our Jack was the first to be described as monotonically increasing, which is an odd way of saying that as X increases, Y also increases. In the context of our mapping between supply and price, all of this means that the earlier you are, the less expensive it is to mint coins. Unlike our constant curve, this positive price mapping allows the token price, not just the token supply, to absorb changes in demand. Essentially, allowing prices to rise and encouraging early investment. ~ A reason to imitate ~
But we can do more than incentivize early-stage investment. The nuance of how much our curves add along the cast is important.
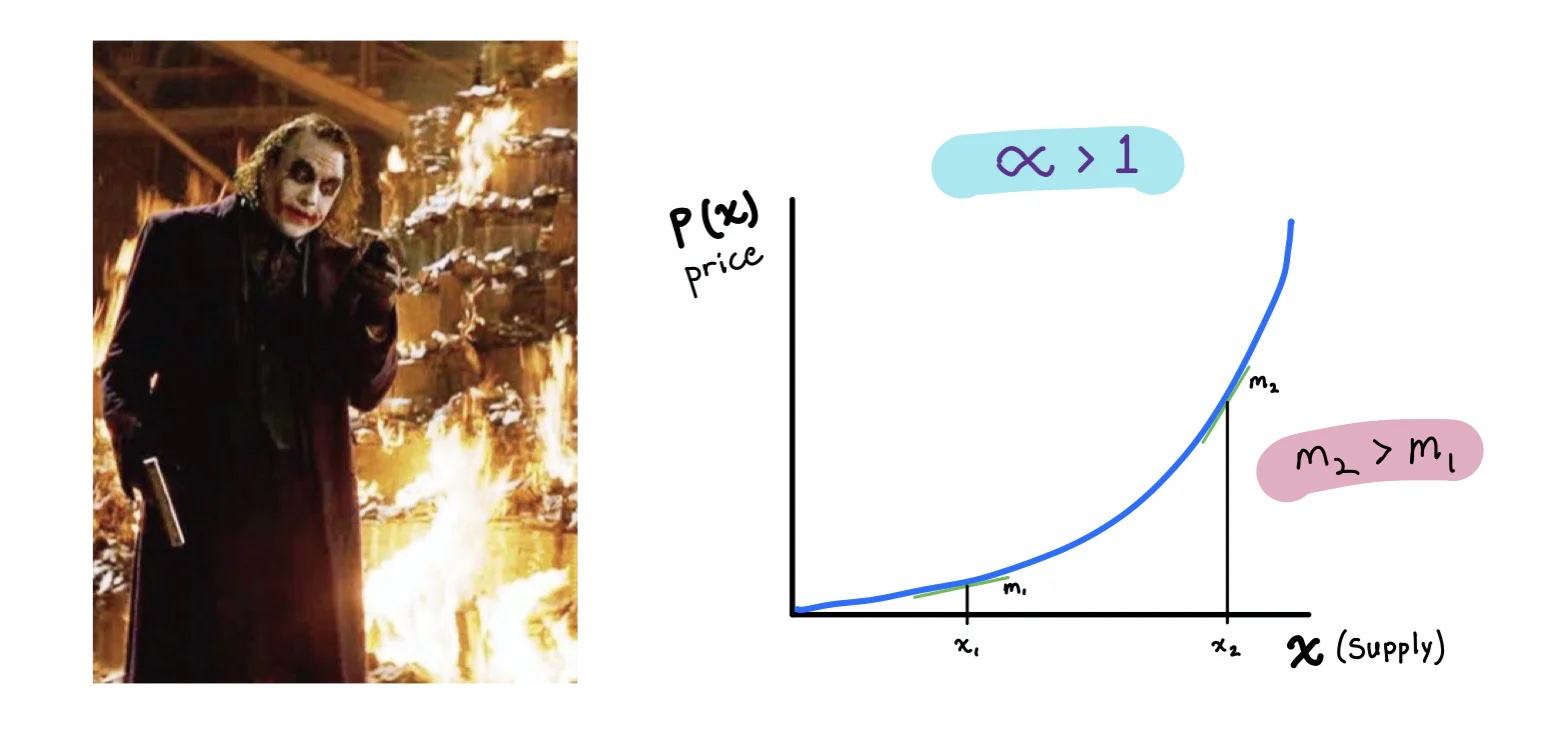
Sublinear: Ace
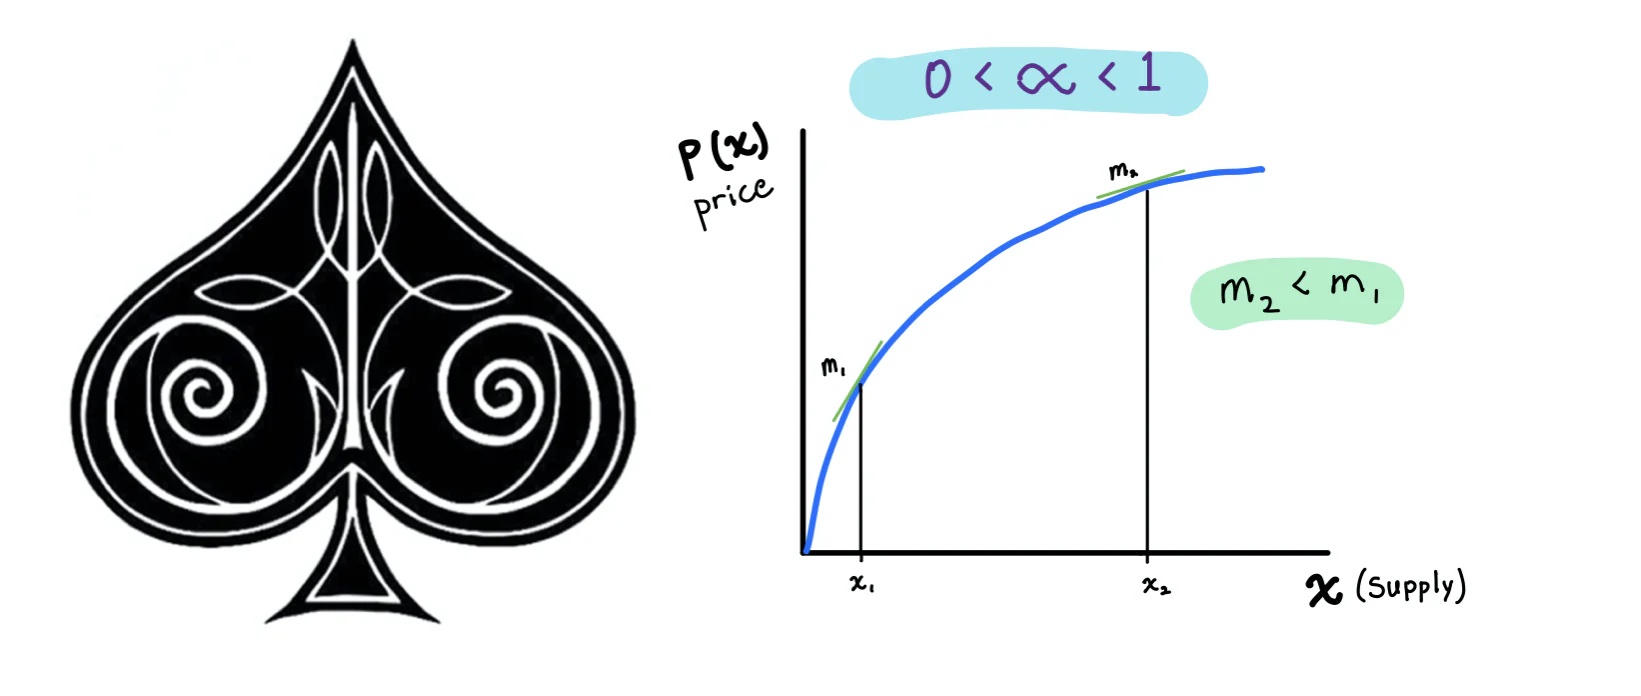
So the sublinear curve is our Ace. This is a curve that adjusts its quality according to the needs of the protocol. Early in a project's lifecycle, when utility is low, the derivative of price with respect to supply is relatively high; we see large increases in token price with each new mint. This encourages early adoption and offers minted teams a low price for their first tokens, as long as they don't mint too many.
As we further expand the supply, the rate of change decreases. As the project matures and reaches greater supply, the slope flattens out to near zero. This expansion to near zero means that, once mature, our sublinear curves start to look a lot like our constant curves. Our Ace needs increasingly large supply changes to have a meaningful impact on the price window. Supply, not price, absorbs fluctuations in token demand. However, this is not to say that tokens of established protocols are not suitable for investment. The token's price growth may slow down, but the price is free to scale up to the code limit.
The beauty of monotypes is that no matter how much you zoom in or out, the shape looks the same. That is, an increase in supply by X% will always result in a Y% increase in the mint price, regardless of the current supply. (1.1x)^a = (1.1)^a * x^a whatever x is.
Hyperlinear: Joker
You expect a queen, but it's hard to impart any sense of awe to this curve. So we show the clown. Why? Because clowns are hard to understand, why the hell would you do that? interesting.
The clown calls out your greed, lulls you to sleep with the promise of riches, only to shoot you in the head and burn the massive amount of cash you donated to his heist. Joker might be as easy to implement on-chain as a simple EXP operation, even elegant. But your dance with court fools will only end in disaster. It's utterly baffling why anyone would trust the Joker, and why anyone would root for the lunatic in their writing.
Our Joker takes all the goodness from our Ace and reverses the game. What started as a slow, slow climb in the price of the token, saw a sharp rise in price volatility as the project matured. As prices fluctuate and wealth increases, one can visualize the inevitable carpet and resulting price history of any token that achieves "adoption" through this method. It exudes a scent reminiscent of PMF's pre-high fever blitz attempt. While you might like some smokiness to your dishes, it's not advisable to accept overcharging in your portfolio.
Quite simply, anyone playing the Joker is either an idiot, or a Ponzi scheme masquerading as an idiot, trying to force forecast hypergrowth in the wrong dimensions.
But even Joker has a saving grace: he promises founders cheaper token capital than any of his peers, a relatively low minting price. It's an offer that's hard to refuse. After all, the hockey stick curve triggers Pavlovian responses in the best of us. This is investor first. But wipe off that drool and remember: Hockey stick success is measured over time, not supply. Price stability at maturity is a good thing for long-term investment and protocol health. Tokens are more than investing in equity. They are part of an ecosystem that is creating value, a means of earning and rewarding utility in the context of the protocol.
(Supply) Based Price Control
If you have a deep understanding of the concept of the encryption industry, please skip
image description
Don't know where I found this bottom line, but I keep him
Good question, An0n. Remember our stablecoins from earlier? Remember how they maintained a tight peg, even when the market crashed? How did they do that?
That's right, our stablecoin protocol maintains the peg by contracting supply. They are able to maintain their price peg by adjusting the supply of their tokens in response to falling demand. Of course, $FRAX and $DAI have their own mechanics, which are less straightforward than shopkeepers, but have similar effects. Following the $UST crash, increased market volatility and declining confidence in stablecoins created significant selling pressure on these tokens. If their circulating supply holds up through this ordeal, it's unlikely that either will remain pegged.
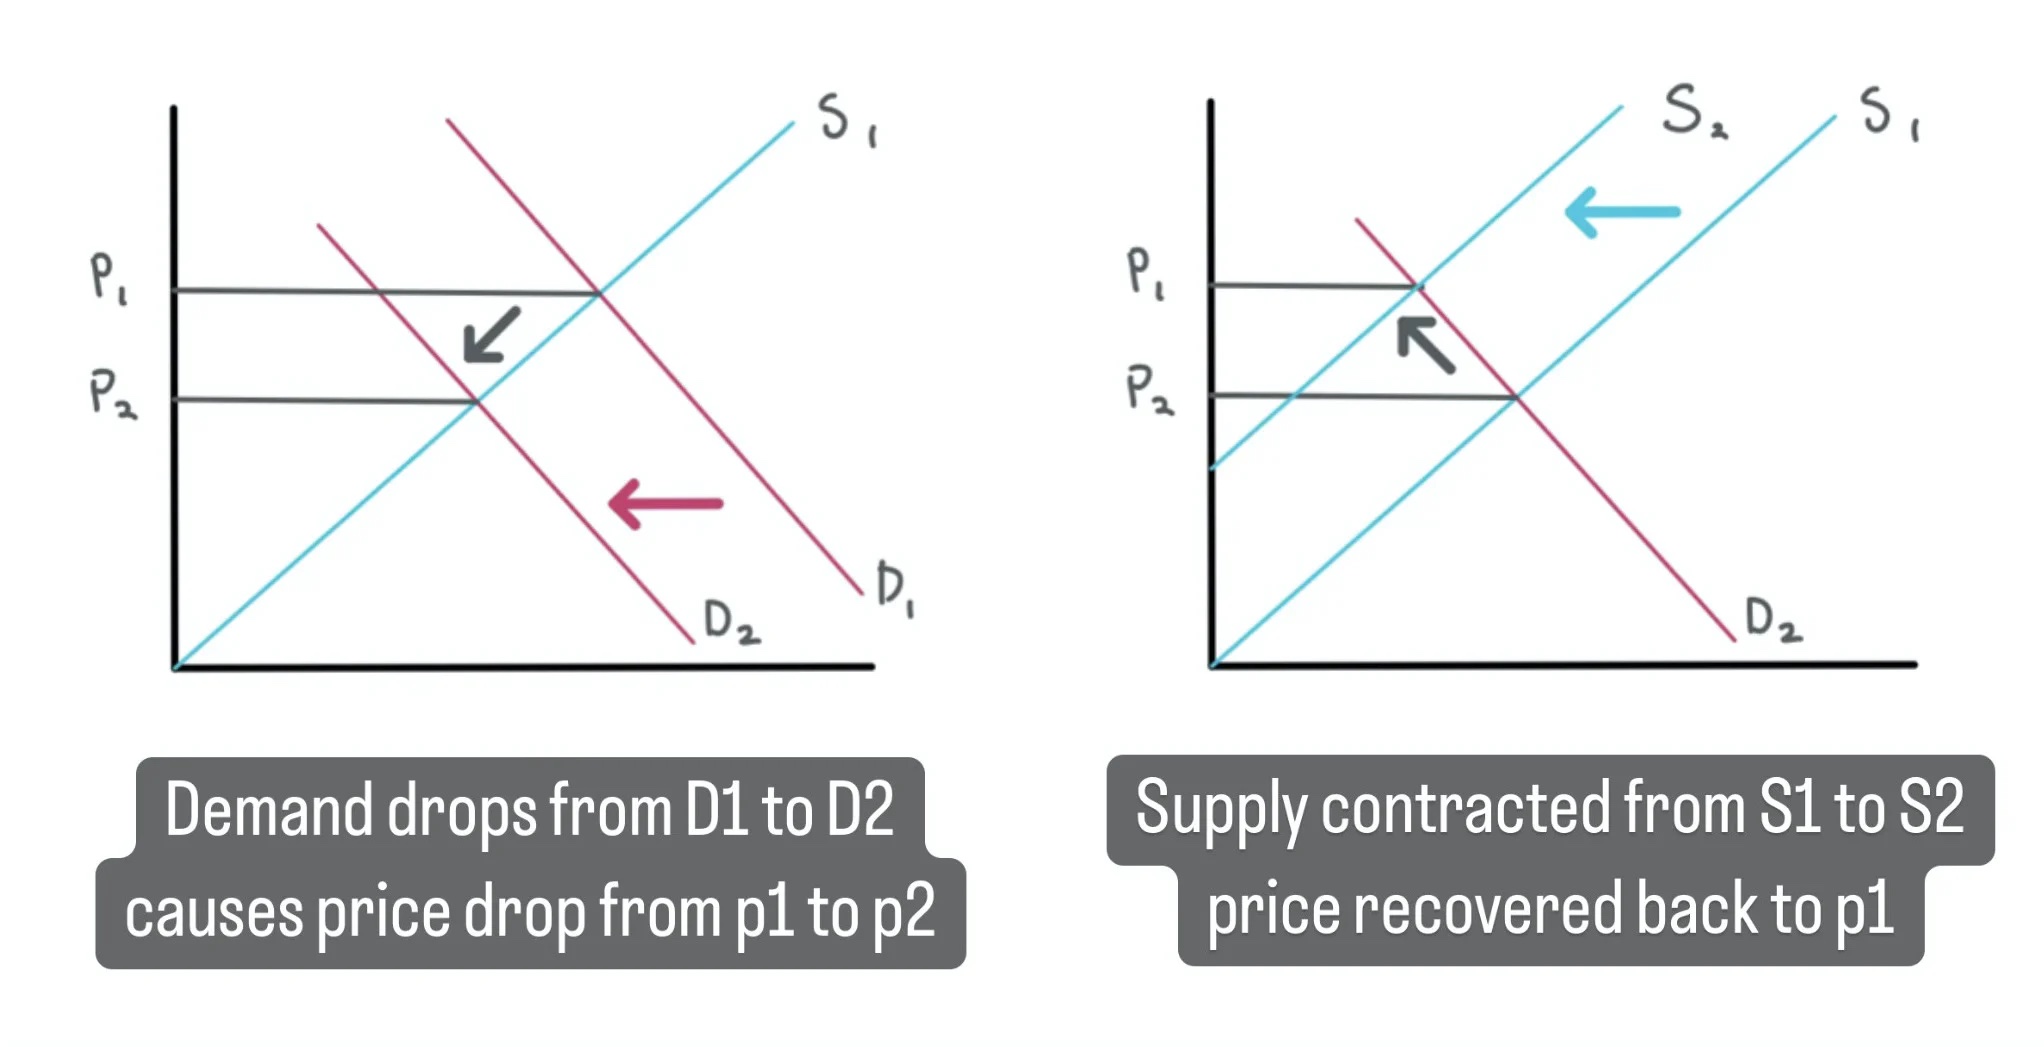
There is no doubt that this is simple economics. At any point in time, the price of an asset is determined by the balance of supply and demand for the asset. Intuitively, when overall demand falls, so does price because supply remains constant. Abstractly speaking, this is a left shift of the demand curve, as shown above.
Our protocol has limited tools to influence demand in these situations. They can only list coins to Coinbase multiple times. There's only so much PSYOP activity going on until CT catches on. So, assuming we have negligible control over demand, we have only one option: supply control.
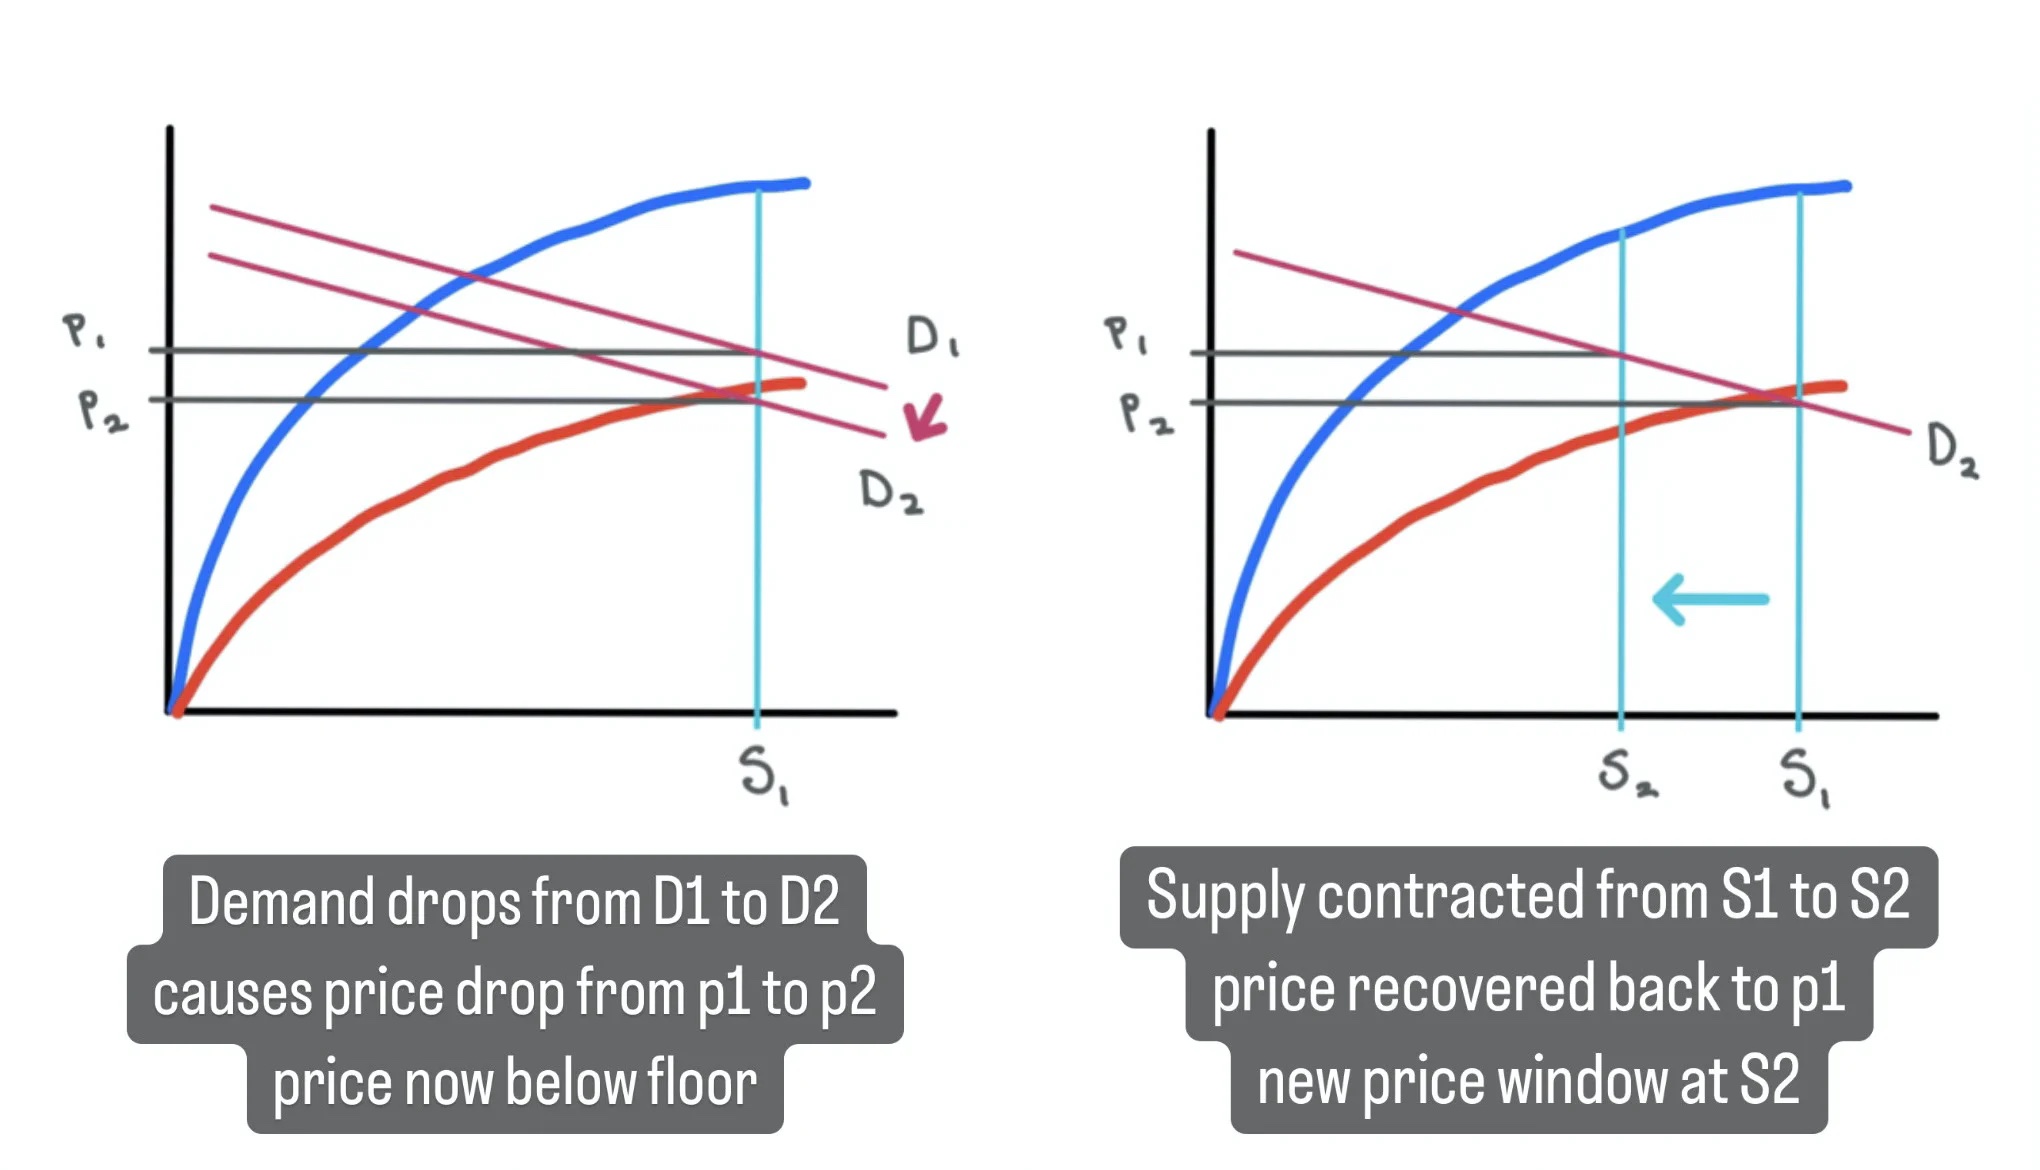
image description

did not draw another
Now, let's flip the script and consider what happens at the other end of the window, when excess demand for the token pushes the price to the ceiling. Of course, buyers would prefer to transact with stores that offer tokens at a below-market price, allowing our sellers to match at lower prices as supply expands. This is a major compromise of the continuous token model; it acts as a neutral party, reducing price volatility in both directions. But it is worth noting that the price window of the contract moves in the opposite direction of the suppression, allowing the price to develop according to the market's wishes.
From a protocol perspective, this happens passively. The shopkeeper here is just a contract that anyone can interact with, exchanging derivative tokens for reserve tokens and vice versa. To this end, the store also acts as a treasury (1) honoring redemptions on the burn curve and (2) maintaining any balances beyond the burn curve, the unallocated area between minting and burn curves.
fractional reserve requirement
5% joy, 50% pain, 100% growl to remember the game
image description
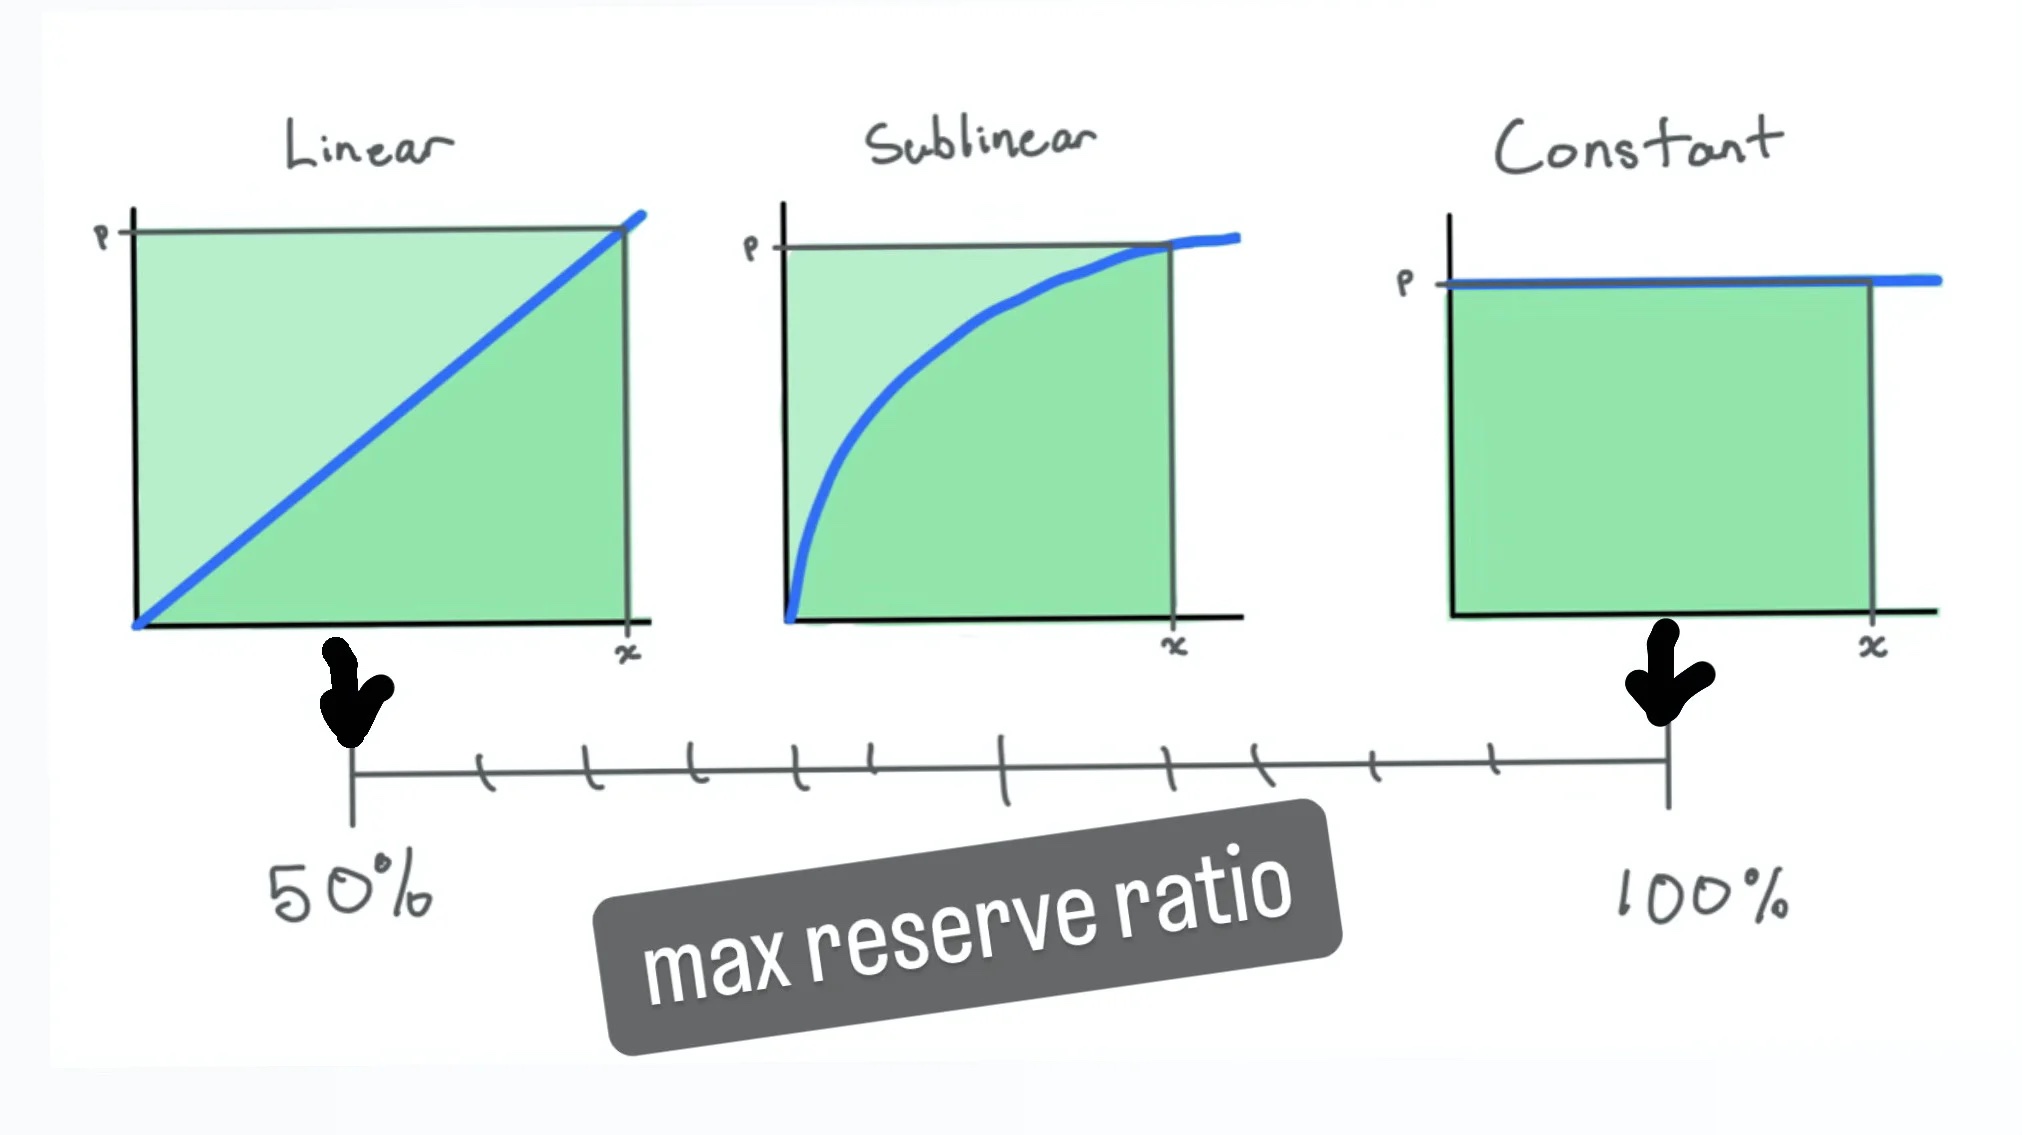
Sublinear curves have a maximum reserve ratio between 50-100%
image description

POV: Riding on a bumpy magic carpet
Today, we see agreements trying to create entire economies out of thin air. Why? Because training wheels don't make for great sales. They limit the speed. Investors like speed, not security features. They don't understand security features. Because security isn't sexy. Security doesn't lead to hypergrowth. Security doesn't blitzscale. Security is not what VCs crave. What VCs crave is exit liquidity. Outperform the market deal. And we've been bred to give it to them in exorbitant amounts at the expense of our own (protocol) health.
So elasticity is not attractive, even more so when the money is dangling around. Elasticity is the antithesis of just-in-time manufacturing, the enemy of "capital efficiency," and inconsistent with high-speed growth. We are not leaving any slack for the swans. Instead, we're doing something sexy. Minting our entire supply from the start, signing off on criminal clauses for capital, and taking credit for squeezing our tokens to the moon when temporarily constrained supply. Well, those criminal term sheets are back to haunt you, right now. No amount of holy water or salt will get rid of skeletons in your closet.
image description
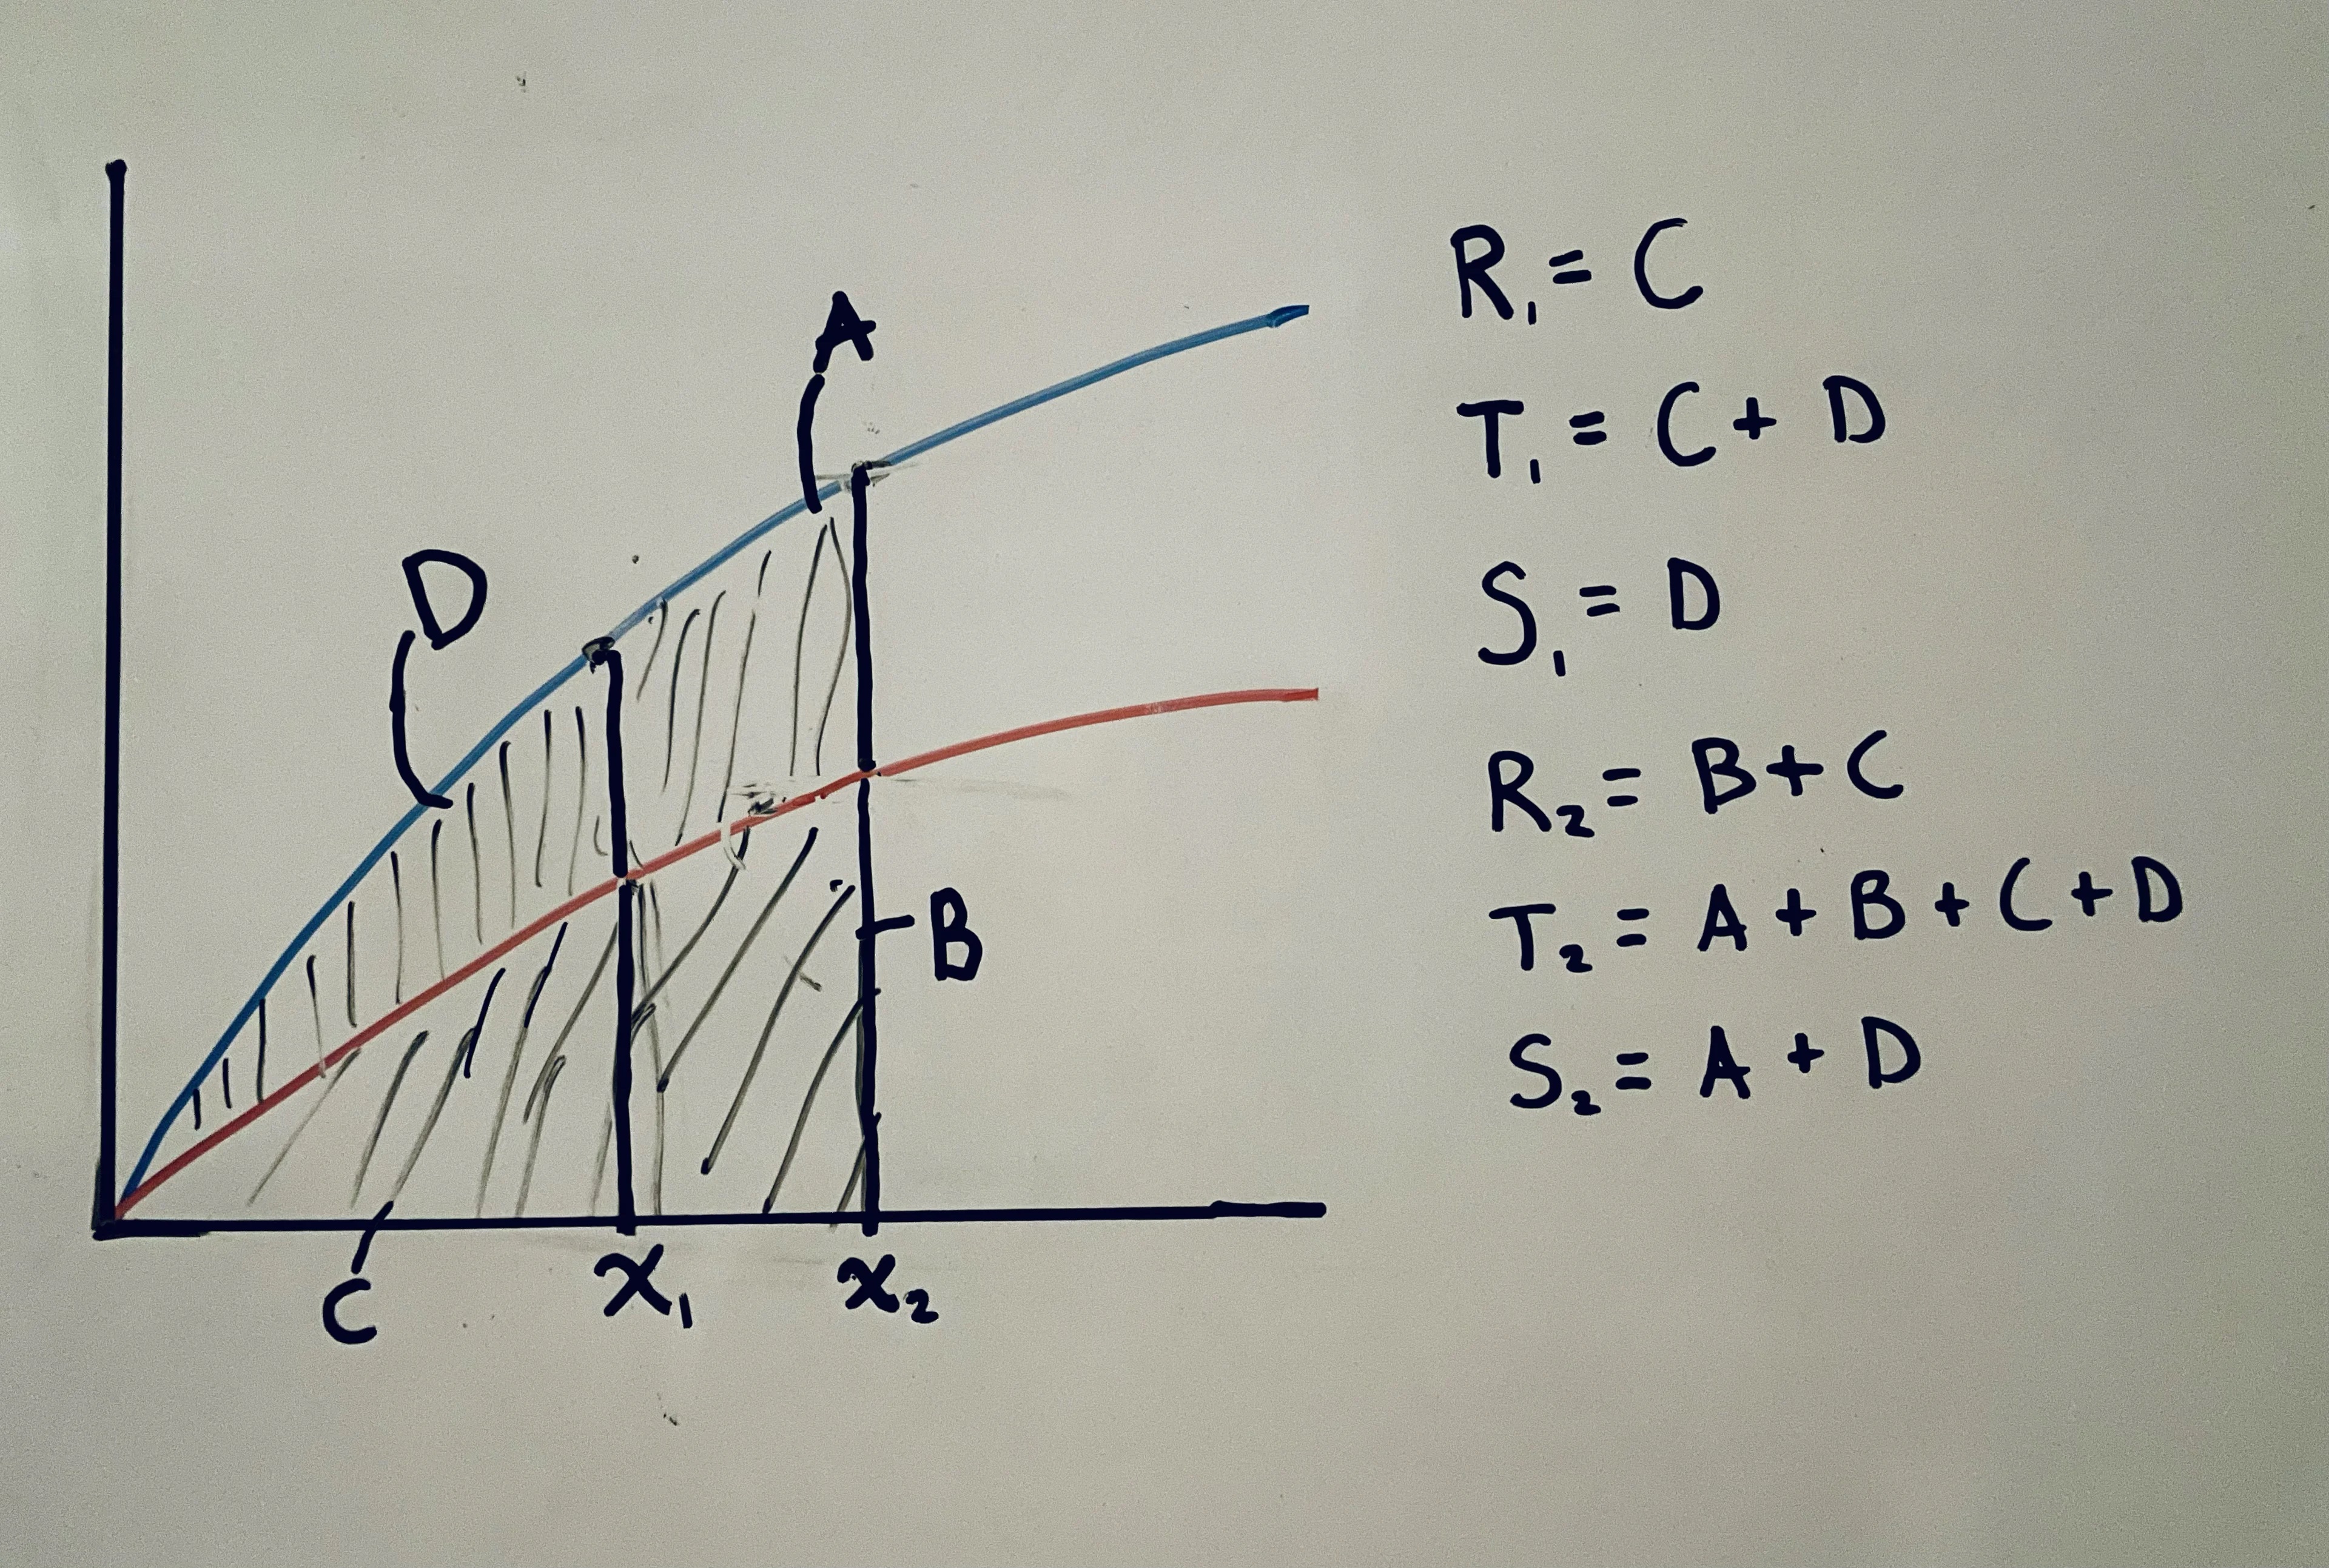
R = reserve requirements, T = treasury balance, S = discretionary spending
We've discussed the maximum reserve ratios for each of these shapes, but those assume the minting and burning curves are the same. The above setup leaves no room for tokens to be traded on the open market, as buyers and sellers must be matched within the gap between the shopkeeper's mint and burn prices. There must be a gap for PvP trading to take place.
For example, let's say our burn curve is a 70% scale replica of our mint curve. With this setup, we could see the token price drop by up to 30% from the peak before our supply controls start to help curb the free fall. Within this 30% gap, the market is free to trade up, down or sideways. However, if the price breaks either line, the player will make a deal with the storekeeper to move the window again.
For a linear bonding curve with this gap, the actual reserve ratio would be 35% (RR_actual = RR_max * BurnMintRatio = 0.50 * 0.70 = 0.35), meaning that the Treasury must maintain 35% of the token's current market cap as a reserve requirement. Of course, this is just an example, and the shape of the curve and the gap between the minting and burning curves can be adjusted to suit the needs of the protocol.
IRL
Get project funding through CTM
The meme factory is out, this section is for founders
It’s worth reiterating that this reserve isn’t necessarily funded by the founders, VCs, or any party in particular. It is built from the contributions of all our minters, with the area under the burn curve allocated to the reserve, while the area above is available for discretionary funds. Thus, the scalar gap between the mint and burn curves, rather than the shape of the curve, determines the proportion of invested funds available to our founders for discretionary spending. For example, if our burn curve is 0.6 times our minting curve, our founders will get 40% of their investment funds to realize their dreams. This is true whether the curve is constant, linear, sublinear, or clinically insane.
Additionally, founders can mint their own tokens at a discount. Since the area above the burn curve is unallocated and available as discretionary funds, founders effectively mint at the burn price, which is always below the market price due to the burn curve acting as our price floor. A neat consequence of windowing settings.
So that's cool, but what about destroying the area under the curve?
Yes, we still have reserve requirements, which are integral to the burn curve of the current supply. Unfortunately, we cannot reveal new tokens out of thin air using the model described so far. This is a strict requirement, even for our founders, a hard cash requirement for minting tokens. Despite getting the best rates, even permanently discounted rates, for being the first minter, most founders would consider the early capital requirements a deal breaker, the fatal flaw of the model. I tend to agree.
After all, the reserve ratio cannot be ignored. Founders need an initial balance of tokens to motivate their community and align their teams with the success of the protocol.
I can talk about potential solutions (doubtful) in future more rigorous writings. For now, though, let's just say there are some workarounds. Free minting and delayed reserve requirements during contract releases come to mind. Given that this model will ultimately result in founders receiving a smaller portion of their "fully diluted" token supply at launch, it's important that we don't increase the capital burden on founders looking to launch a shopkeep-stabilized token protocol.
Sublinear Curves in Practice
Skip this unless you are solid in math and know solidity
Someone may ask, why a single curve? In short, they are easy to integrate and easy to approximate. Just look at the comparison of on-chain approximations of sigmoids and logarithms. I'm probably a little rusty with the math, but the integrals to approximate and implement them on-chain don't seem ideal. In contrast, the Babylonian method is elegant and has been used to semi-efficiently approximate the square root of sqrtLibrary.sol on-chain. I've applied this toExtension of the Babylonian Method, this method generalizes the property of quadratic convergence to any n roots.
Monomials are also easy. It is easier to communicate with the audience. And their properties, such as point derivatives, are easy to reason about and thus easy to design. For example, the generalized equation for the maximum reserve ratio is 1/(1+a). Elegant original intention?
Such a solution has not yet appeared, mainly (I assume) due to a lack of innovative interest in this direction. Founders and investors have not unanimously chosen the continuous token model as the preferred funding model in the short term. For those who've thought about it, it's not entirely obvious that a sublinear curve is something we prefer, as evidenced by the conversation so far around CTM joint curves. If it's obvious, the sublinear option is definitely more challenging than its counterpart.
So without a clear reason to seek such a solution, I can't imagine anyone risking the less traveled path. Some of you may have noticed the obscurity of the cited paper. Cited six times in its 23-year life, it's not exactly popular. This is certainly not the first option to explore. The path to discovering it is tortuous and painful, full of dead ends and disappointments.
But this solution holds promise. As many of you probably know, there is no general, low-level abstraction for representing floating point in Solidity. As a result, calculating fractional indices proved impossible. Bad news for anyone trying to map sublinear monomials. This is our motivation for applying the Babylonian method to the square root approximation of quadratic voting. Now, imagine if we had a tool that could efficiently approximate any n-root, not just the square root. Well, we can use that primitive.
By expressing our sublinear monomial as a fractional exponent x^(m/n), it simply becomes the n roots of x^m, where m and n are both positive integers. Since each cycle in this approximation is quite expensive (~30 Gas), it is important to tighten the initial estimate to minimize the number of cycles before convergence. We can do this by constraining the subtotal x^m to be a power of 2 and doing some bit shifting (brute force atm, but can be cleaned up with binary search). fortestIn all cases covered in , the loop converges to the nearest integer within 10 iterations.
It's not hard to imagine on-chain uses for these approximations. A key use case that comes to mind is sublinear stake-to-vote weight mapping. Sublinear mappings in voting, coupled with anti-Sybil practices (outside the scope of this article) are prerequisites for moving away from the purely plutocratic voting system we employ today.
If only for that reason, I'm eager to see this implementation go to a higher standard. In fact, this implementation is sufficient for the CTM bonding curve described in this paper, and may even achieve sufficiently high mint/burn balances on the Ethereum mainnet. Further gas optimization will support higher frequency use cases such as vote mapping, at least on L2s and PoS systems.
herehereAs an extension of ERC20. I'll be finishing testing and cleaning up the code to make it open source in the next few weeks.
With only a few months (?) to develop in Solidity now, I have a lot to do in this industry. I would like to take this opportunity to announce my presence. Attract collaborators who are more capable than me. And identify some mentors who are willing to answer some of the inevitable hindsight obvious questions. Hopefully some of you are seeing the same values as me in sublinear mapping. Hopefully this CTM use case is compelling enough to be adopted as a building block.
Again, my DMs are open. Let's talk token economics :^)
in nuce (🔩 , 🥜)
Continuous Token Model Allows for Better Alignment Between Investors
Reserves can control supply to curb price volatility
Sliding price window soft-pegs tokens while allowing full scalability
Sublinear monomial curves work best and are already cheap enough for L2
source link notion)


