In addition to the under-attack S2F, what other common analysis models does PlanB have?
Original editor: Colin Wu
Original editor: Colin Wu
Recently, Twitter KOL PlanB cited several indicator models that are commonly used to assist decision-making besides the well-known S2F. In view of the current volatile market trend and the bottom-hunting sentiment after the plunge, we will introduce these indicator models for reference as needed.
Interestingly, Vitalik just made a critique of S2F. He said that the S2F model does not look very good now. I know things like schadenfreude are bad manners, but I think financial models give people a sense of false certainty and predetermined numbers will increase, which is harmful and they deserve all the scorn. PlanB just said that the S2F model works well from March 2019 to March 2022. According to the S2F model, either BTC is currently extremely undervalued and rebounds quickly, or S2F becomes less useful in the future.
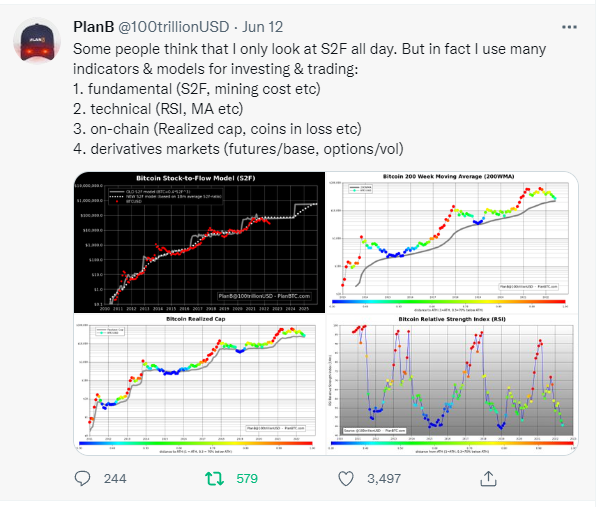
Bitcoin Stock-to-Flow Model (S2F)
The S2F model was originally used to measure the scarcity of commodities such as gold and silver. It mainly considers two variables, the existing supply (Stock) and the annual output of assets (Flow). Just because the total amount and output of bitcoins are clearly recorded on the blockchain, it makes sense to apply S2F to bitcoins.
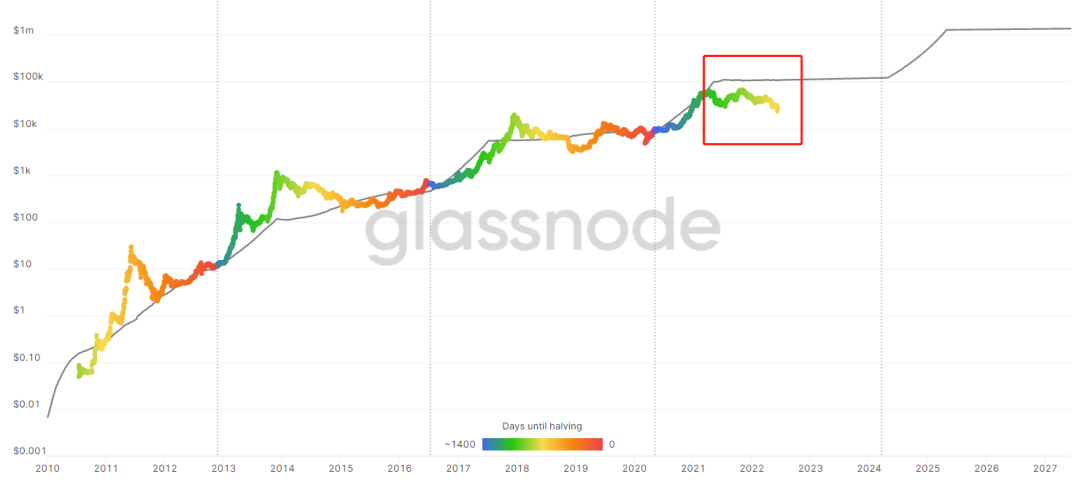
Whereas PlanB compares the Bitcoin S2F model to the price and performs a linear regression using the power law to potentially predict its future value change.
However, the model also has some irrationality, such as only considering scarcity, ignoring market demand, and some logical problems.
At present, this indicator has seriously deviated and failed. After all, according to the trend of this model, the current Bitcoin will reach 100,000 US dollars, and even break through 10 million US dollars in 10 years.
Cost Pricing Method (Bitcoin Mining Machine Price)
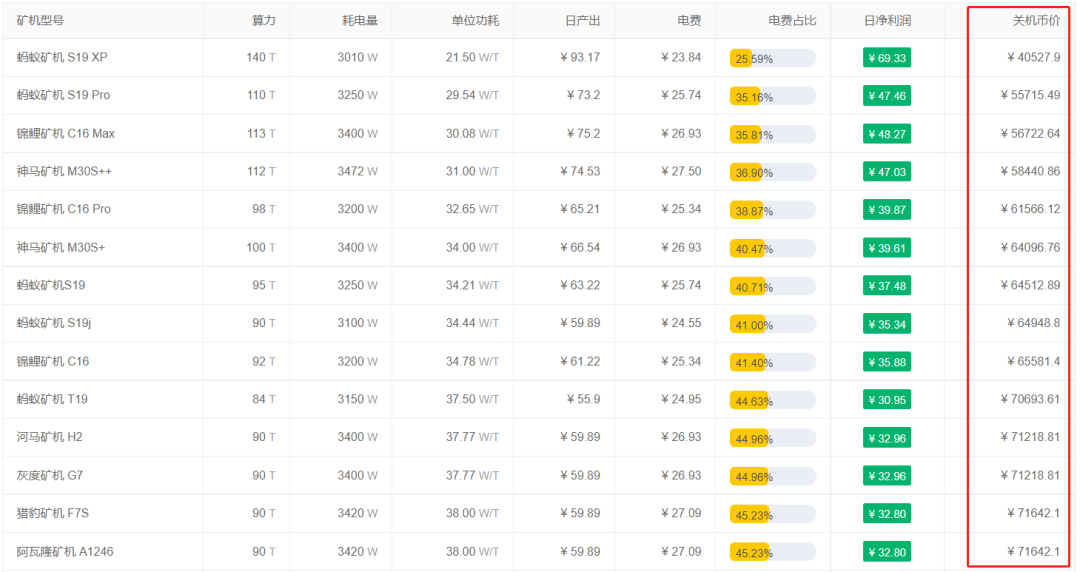
The cost pricing method is the most intuitive cryptocurrency valuation method. Its core idea is to regard the production cost of cryptocurrencies (such as the mining cost of Bitcoin) as the lower limit indicator of the value of cryptocurrencies. Therefore, taking Bitcoin as an example, perhaps its shutdown currency price range can be used as the bottom price range for investors to refer to. Like the current bitcoin price, it has fallen to the shutdown price of some mining machines.
Realized Cap and related evolution indicators
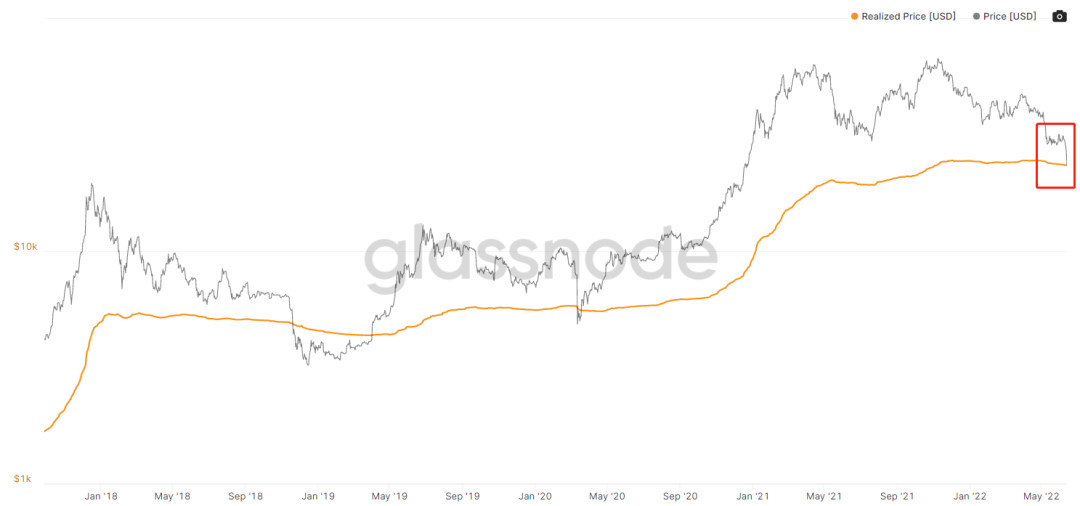
The calculation method of the realized market value (Realized Cap) is: to estimate the market value based on the price of all bitcoins at the last movement, which can be understood as the average cost of all currency holders.
Therefore, we can assess how high or low the current Bitcoin price is by comparing Bitcoin's current market capitalization in circulation with its realized market capitalization. Now many on-chain indicator models are also optimized based on the realized market value indicator, making the so-called top-bottom interval easier to observe. Similar indicators include MVRV Z-Score and so on.
According to the current price of Bitcoin, the current market value of Bitcoin is already close to the realized market value.
Relative Strength Index RSI
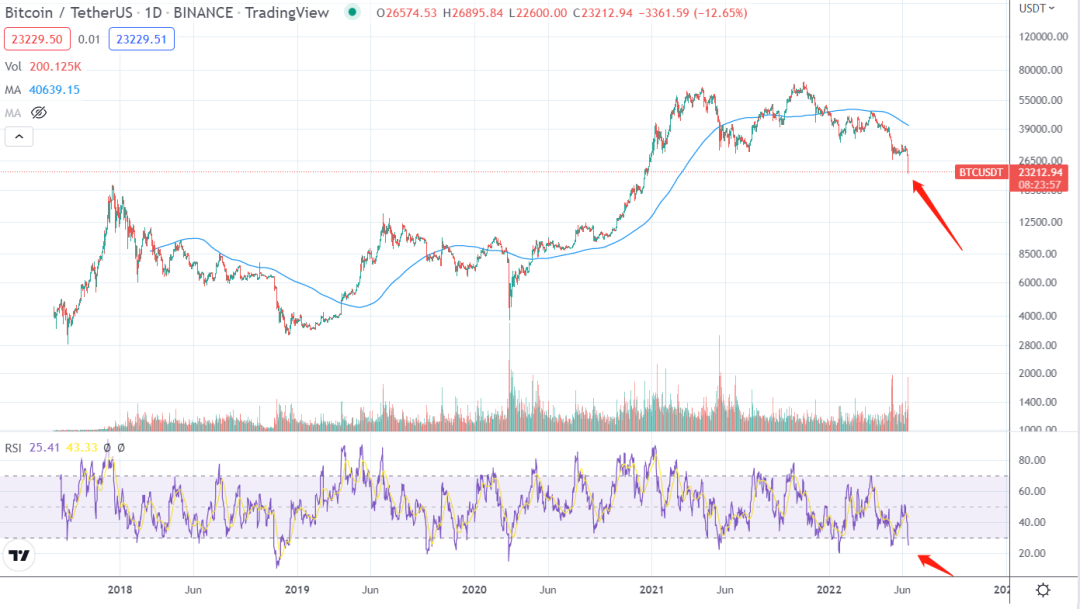
The Relative Strength Index (RSI) is an indicator of the internal relative strength of the currency price itself. It can show the oversold and overbought conditions of the market, measure the range of price changes in a certain period of time, and the trend of expected prices to fall or rise, etc., but RSI It can only be used as a foreseeable indicator signal, and it does not mean that the trend of the market will necessarily develop in this direction.
MA
The moving average refers to the arithmetic moving average within a certain trading period. The moving average is formed by connecting the points calculated every day. The 5-day moving average is the weighted average price of the closing prices of the 5 trading days. According to the length of time, the moving average can be divided into short-term moving average, medium-term moving average and long-term moving average.
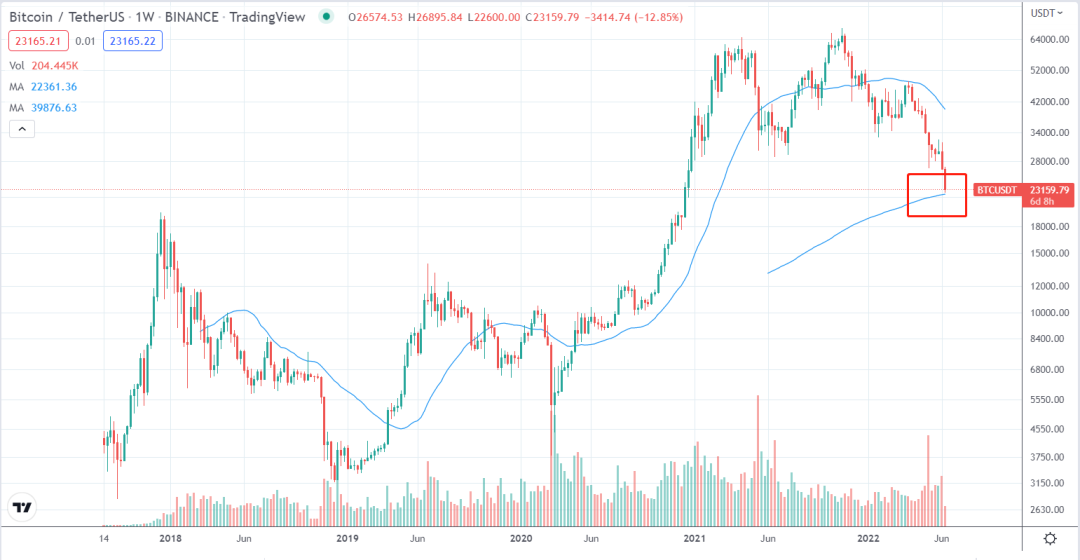
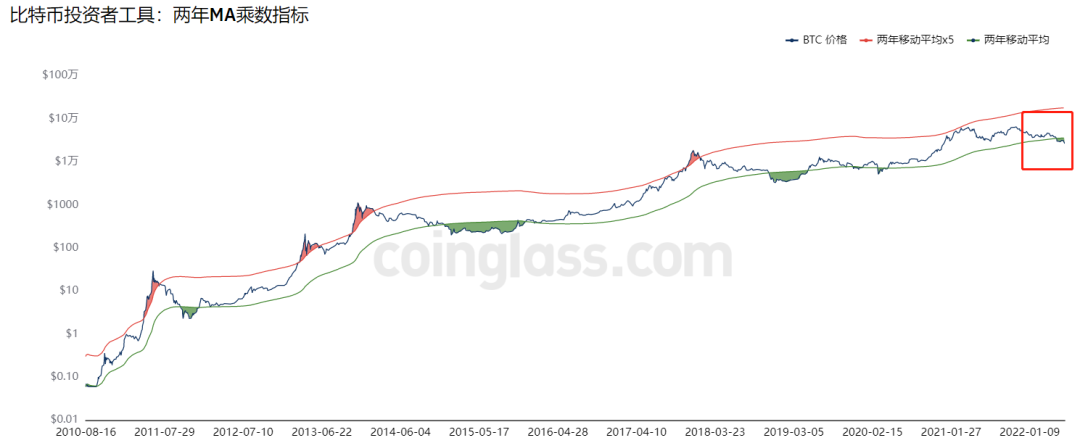
For example, Philip Swift has derived a two-year MA multiplier indicator based on the MA indicator. It is intended to be used as a long-term investment tool. It highlights the periods in which buying and selling Bitcoin will generate large returns.
It is worth mentioning that Chris Burniske, a partner of the investment institution placeholder, once said that he regarded the 200-week K-line MA of BTC & ETH as an important support, and expected that it might fall below this support level. With the recent plunge, BTC & ETH have reached this support level.
Basis
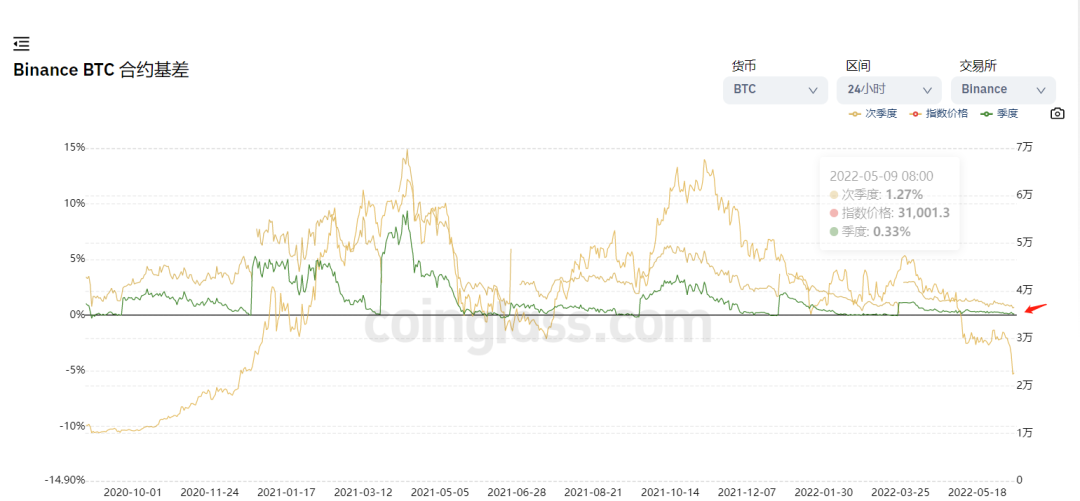
Basis is the difference between the spot price and the futures price of a particular commodity at a particular time and place. By measuring the spread between the futures market and the regular cash market, traders can gauge how bullish the market is.
Whenever bulls are overly optimistic, quarterly futures contracts trade at an annualized premium (basis) of 10% or more.
options
options
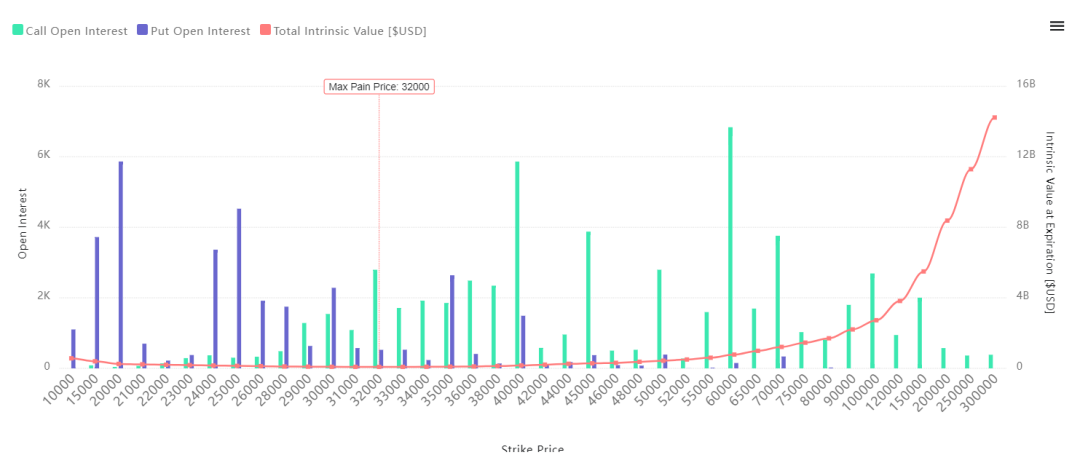
The above picture shows the option positions of Bitcoin at various strike prices (source: https://www.coinoptionstrack.com/), by viewing the put and call option positions of Bitcoin at a certain time in the future and at various prices, you can A general understanding of the general prediction of the future market trend.