
Binary Research: Enlightenment from the plunge, exploring the financial attribute cycle of encrypted assets
Original source: BinaryDAO
In the two-year encryption bull market, the highest increase of BTC has been 20 times; in half a year, BTC has fallen by 70% from its relative high point.
Everything has a cycle, and the cycle of financial asset investment is very obvious. The price of the traditional venture capital market fluctuates like a pendulum. After a big rise, there must be a big fall, and after a big drop, there must be a big rise. The price swing between these two extremes The process is the investment cycle.
Due to its special industrial attributes, the cycle logic of cryptocurrency has a somewhat unique narrative. We analyze it from three dimensions:
1. Scientific and technological attributes - technological development, optimization of productivity and production relations;
2. Commodity attributes - supply and demand relationship, supply and demand imbalance caused by BTC halving;
3. Financial attributes—the direction of liquidity, which is currently highly related to traditional risk financial markets, so it is greatly affected by the Fed's monetary policy, interest rate + balance sheet and other macro liquidity factors.
first level title
1. Merrill clock
The Merrill Lynch clock is a representative model for analyzing the fundamental cycle, and it is also one of the common tools for locating the market cycle stage. It links the economic cycle with the rotation of assets and industries to guide asset allocation.
image description
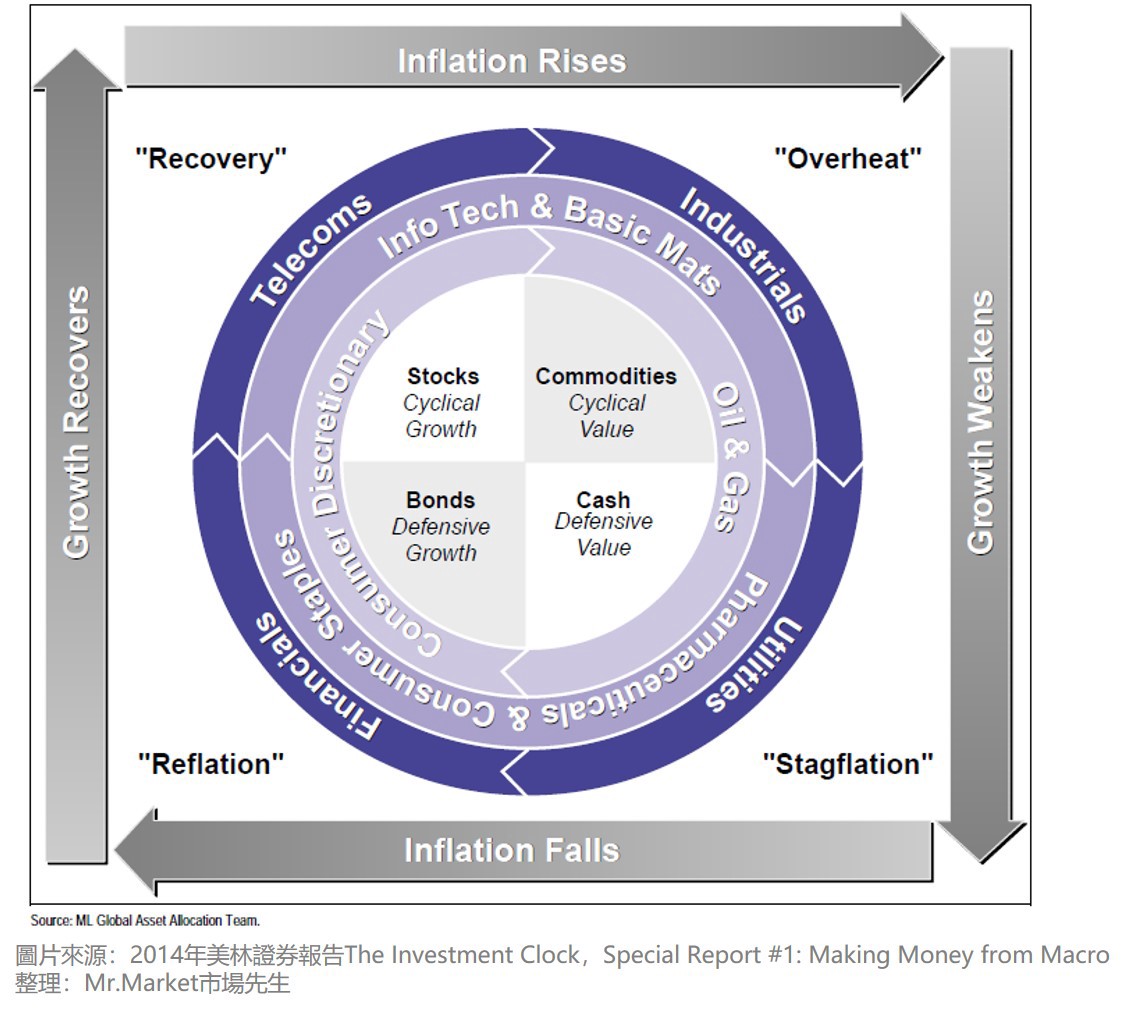
Figure 1: Merrill Clock
The classic boom-to-bust economic cycle starts from the bottom left and progresses clockwise through four phases, divided into four phases: reflation, recovery, overheat, and stagflation.
image description
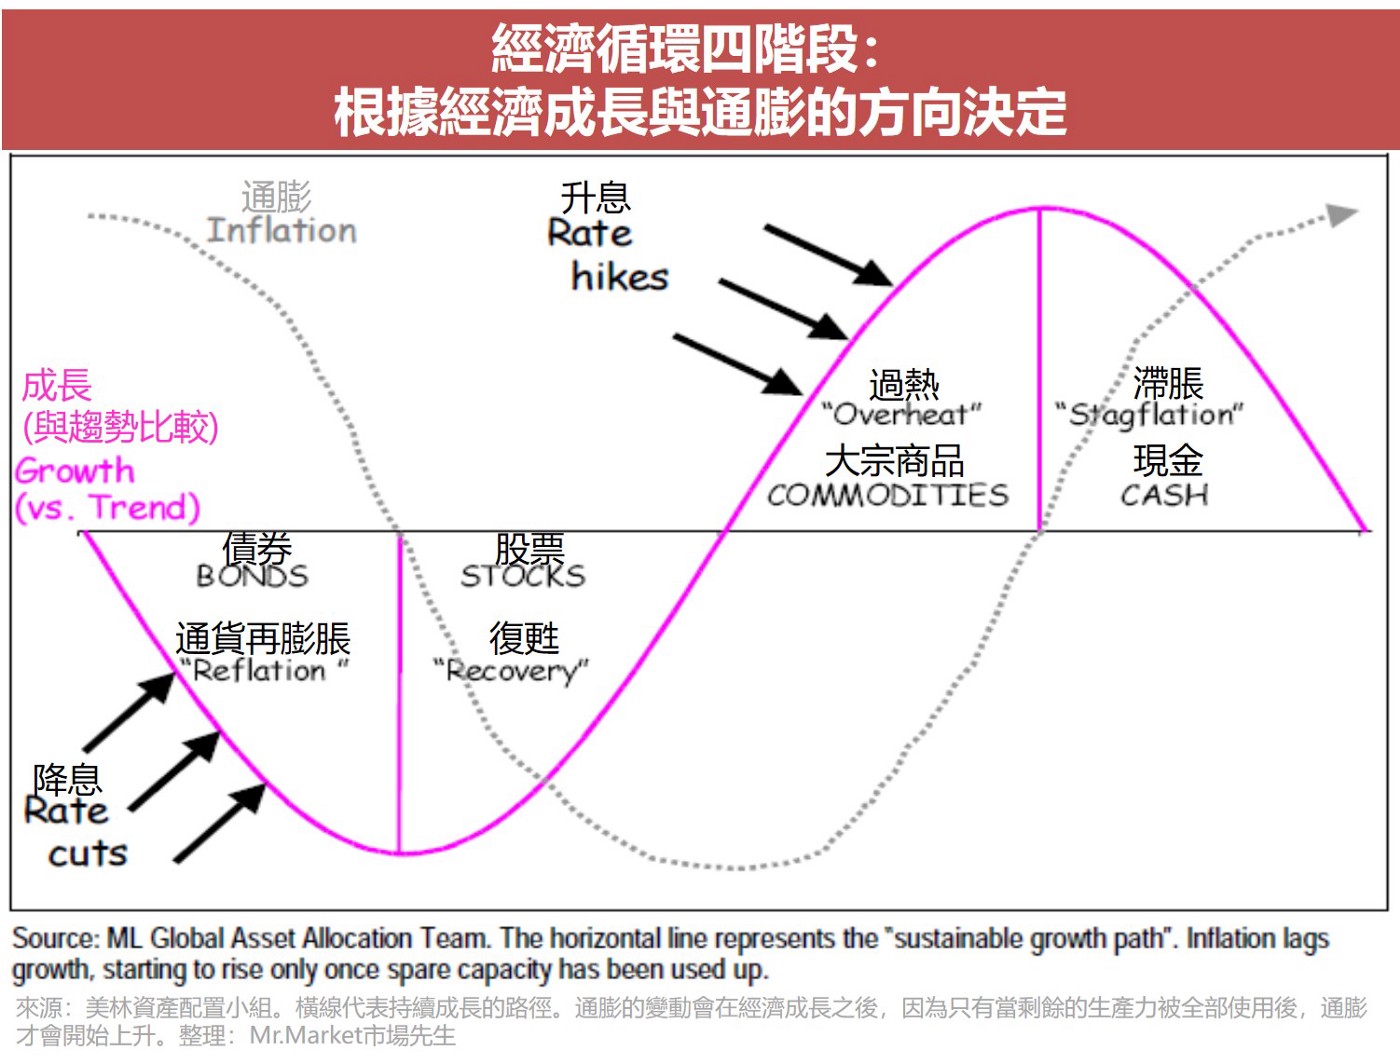
Figure 2: Merrill Lynch cycle corresponding asset map
Challenges in Merrill Lynch's practice. In reality, not every cycle will be rotated sequentially; even if it is rotated sequentially, the dwell time is difficult to judge, especially in a recession, due to the Fed’s policy adjustment, the bottom and turnaround may occur very quickly — big cycle and small cycles. At the same time, not all capital markets respond to the macro economy in a timely manner, such as A shares, such as the encryption market.
The most important thing is that asset trends are gradually deviating from economic fundamentals, and the mapping relationship between the economic cycle and the financial cycle is broken. For example, after March 2020 is not the period of economic recovery, but risky assets are rising; Bull pattern; at the same time, commodities began to enter a slow downward channel, even if the US economy from recovery to a strong stage, the commodity market is still bleak.
first level title
2. Analysis cycle
Combined with the Merrill Lynch clock, according to the past price trends of different assets at different stages, we can see the following states from the financial attribute cycle of encrypted assets:
Easing cycle: start to cut interest rates → start QE → stop interest rate cuts;
image description
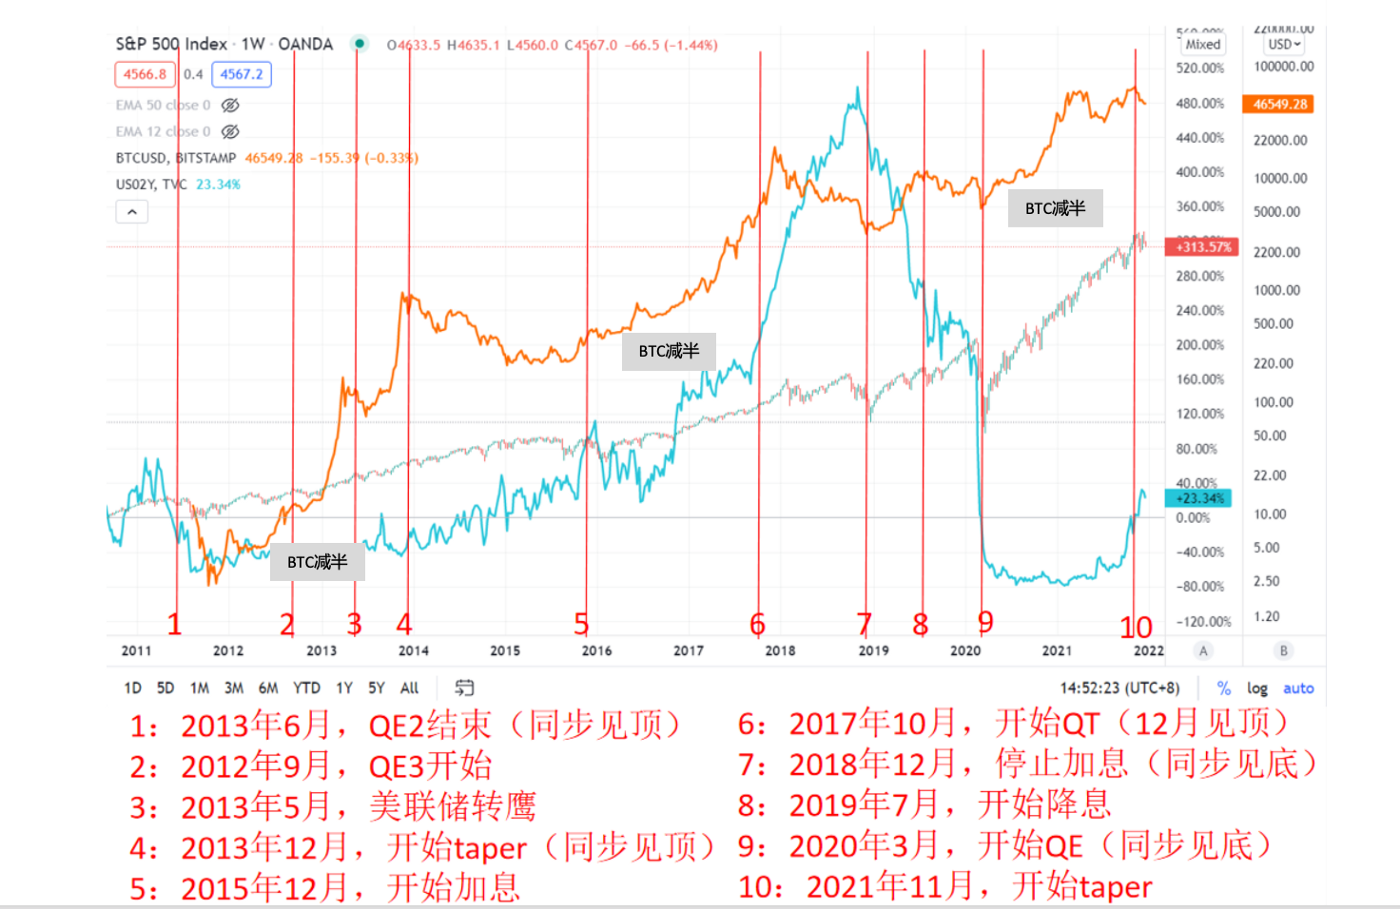
Figure 3: Asset performance at different stages of the cycle
The corresponding reaction of US stocks and encrypted assets:
Easing cycle: It starts to rise, the market’s acceptance of risk increases, the risk premium decreases, and bubbles appear in extreme cases;
image description
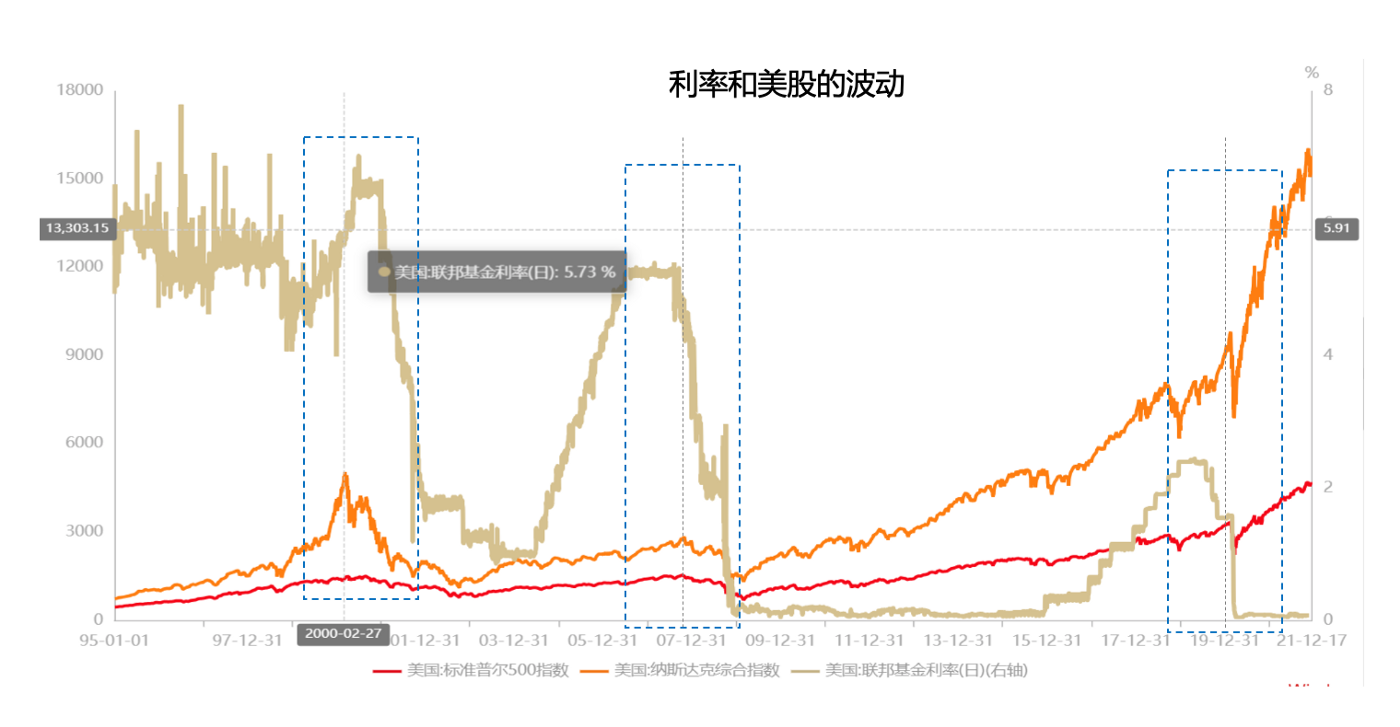
Figure 4: Interest rates and U.S. stock volatility at different stages
image description
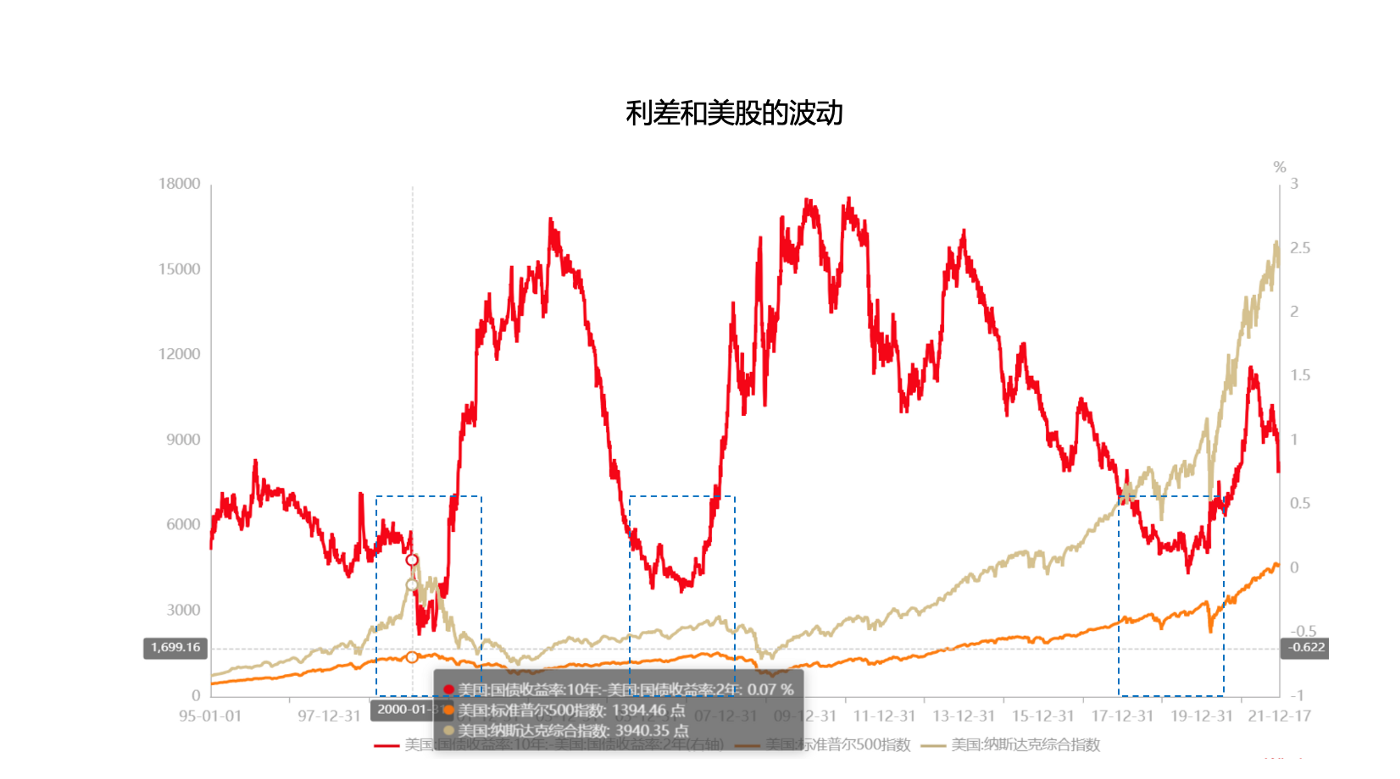
Figure 5: Interest rate spreads and US stock volatility at different stages
first level title
III. Current stage
Judging from the current market situation, inflation remains high, GDP value-added rate slows down, and the market is in a stage of stagflation.
image description
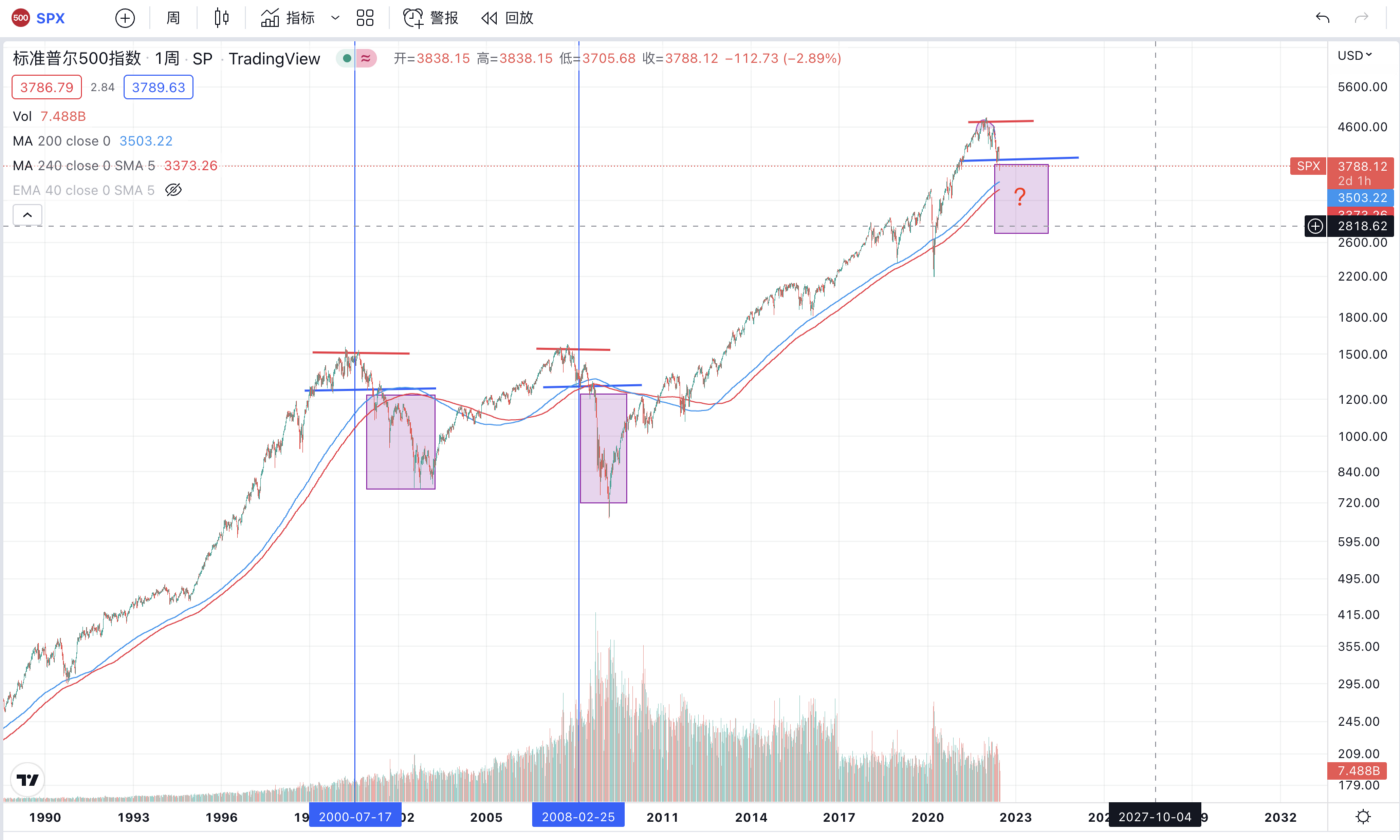
Figure 6: Three downtrends of SPX since 2000
image description
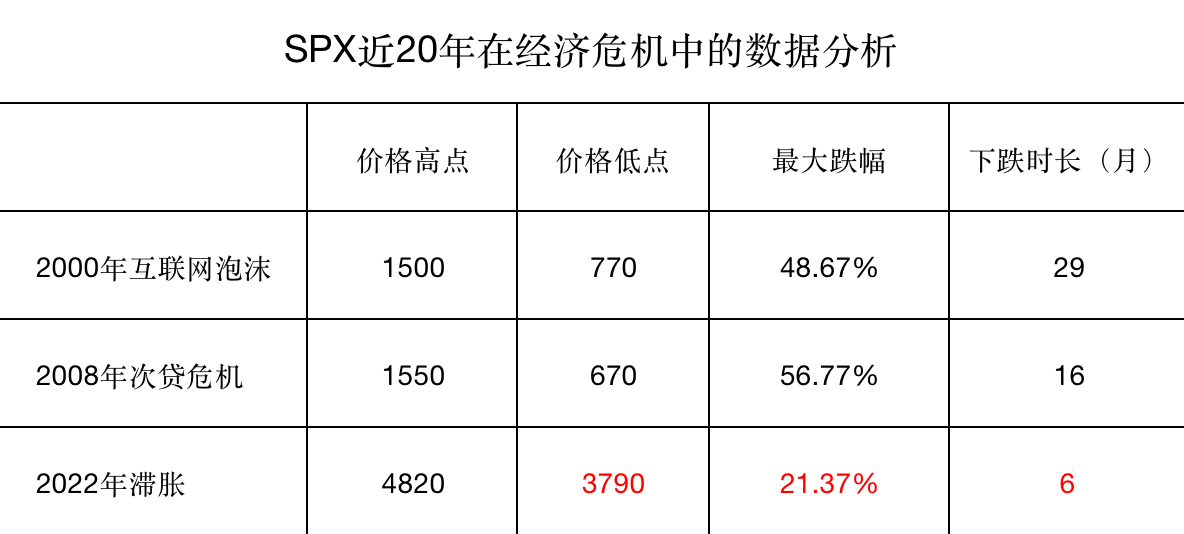
Figure 7: Data analysis of SPX in the economic crisis in the past 20 years
first level title
4. Positive judgment
Judging by the current situation, the U.S. stock market will still face a big sell-off. According to past rules, it may be the July/August financial report season, or the November/December financial report season, but the Fed may adjust its policy in time, so the FOMC meeting in September More critically, the crisis may not last for a long time, and it is expected to be until the end of 2022.
Generally speaking, U.S. stocks fall in two stages, but this time is different. The complex internal and external environment makes the Fed also in a dilemma. This time the stock market decline may go out of three stages:
The first stage is caused by the fear of inflation;
The second stage is that the rise in U.S. bond interest rates kills valuations;
The third stage will be that the economic recession kills the fundamentals;
However, we believe that the third stage has not really come, because the liquidity premium of US stocks has been very high in the past ten years, and the real value return has not yet been realized, and the liquidity risk and credit risk have not been fully released (US high yield bonds OAS is only half way through to price in credit event scenarios).
end
end
Original link


